OPEN-SOURCE SCRIPT
Climax Detector (Buy & Sell)
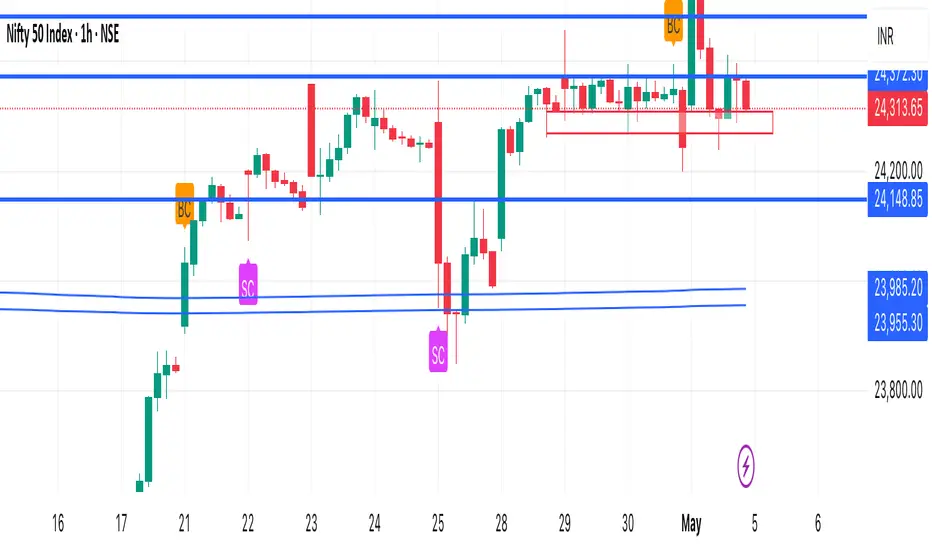
This indicator identifies potential Buying Climax (BC) and Selling Climax (SC) events based on volume spikes relative to historical averages.
• Buying Climax (BC):
• Detected when a green candle forms with volume significantly higher than the average (default: 2×).
• Often signals the end of an uptrend or distribution phase.
• Selling Climax (SC):
• Detected when a red candle forms with very high volume (default: 2× average).
• Often occurs at the end of a downtrend, suggesting panic selling and potential accumulation.
How it works:
• Calculates a moving average of volume over a user-defined period (default: 20 candles)
• Flags a climax when current volume exceeds the defined multiplier (default: 2.0×)
• Marks:
• BC with an orange triangle above the bar
• SC with a fuchsia triangle below the bar
Customizable Settings:
• Volume spike sensitivity
• Lookback period for average volume
Use Cases:
• Spot possible trend exhaustion
• Confirm Wyckoff phases
• Combine with support/resistance for reversal entries
Disclaimer: This tool is designed to assist in identifying high-probability exhaustion zones but should be used alongside other confirmations or strategies.
Open-source script
In true TradingView spirit, the creator of this script has made it open-source, so that traders can review and verify its functionality. Kudos to the author! While you can use it for free, remember that republishing the code is subject to our House Rules.
Disclaimer
The information and publications are not meant to be, and do not constitute, financial, investment, trading, or other types of advice or recommendations supplied or endorsed by TradingView. Read more in the Terms of Use.