OPEN-SOURCE SCRIPT
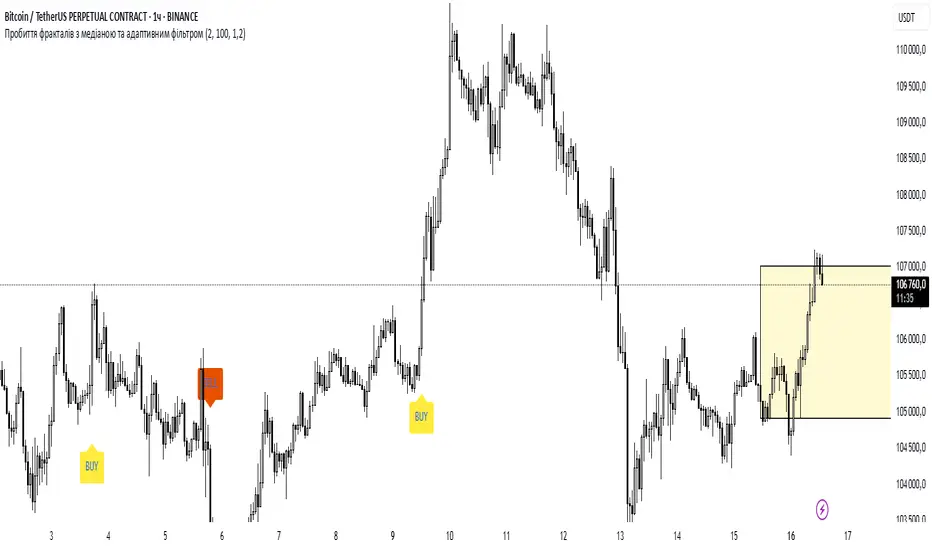
Пробиття фракталів з медіаною та адаптивним фільтром
We are going to describe the indicator in English. The indicator is based on the concept of fractal breakouts with volume confirmation using median and adaptive filtering.
### Indicator Description:
**Indicator Name:** Fractal Breakout with Volume Median and Adaptive Filter
**Overview:**
This indicator identifies breakout signals based on fractals (price reversals) and confirms them with volume analysis. The breakout signals (both buy and sell) are generated when the price breaks a fractal level (high for buy, low for sell) and the current volume exceeds the median volume of previous breakouts by a certain adaptive multiplier. The adaptive multiplier adjusts for different timeframes to provide more relevant signals.
**Key Features:**
1. **Fractal Detection:**
- Fractals are detected using a user-defined period (default is 2).
- A top fractal (bearish reversal pattern) is formed when there is a central bar with the highest high among `len` bars on both sides.
- A bottom fractal (bullish reversal pattern) is formed when there is a central bar with the lowest low among `len` bars on both sides.
2. **Breakout Logic:**
- A buy breakout occurs when the price closes above the last top fractal level.
- A sell breakout occurs when the price closes below the last bottom fractal level.
- The breakout must happen on the current bar (i.e., the breakout is new: the previous bar was not above the top fractal for buy, or below the bottom fractal for sell).
3. **Volume Confirmation:**
- The indicator maintains two arrays (one for buy breakouts and one for sell breakouts) that store the volumes of previous breakout bars.
- For a breakout to be confirmed, the current volume must exceed the median volume of the respective array (buy or sell) multiplied by an adaptive multiplier.
- The adaptive multiplier is calculated based on the current timeframe. It is designed to be lower on higher timeframes.
4. **Adaptive Multiplier:**
- The base multiplier is set by the user (default 1.2).
- The actual multiplier is adjusted by the formula: `baseMultiplier * (1.0 - min(timeframe_in_hours, 1.0) * 0.5)`. This reduces the multiplier on timeframes of 1 hour and above.
5. **Signal Alternation:**
- The indicator alternates between buy and sell signals. After a buy signal, only a sell signal can occur, and vice versa.
6. **Visualization:**
- Fractals are marked with triangles (red downward for top, green upward for bottom).
- Breakout signals are marked with labels (green "BUY" below the bar, red "SELL" above the bar).
7. **Alerts:**
- Alert conditions are set for both buy and sell breakouts.
**Input Parameters:**
- `Period Fractal (len)`: The number of bars used to detect fractals (default: 2).
- `Number of Breakouts for Median (volLookback)`: The number of previous breakouts to consider for median volume calculation (default: 10).
- `Base Volume Multiplier (baseMultiplier)`: The base volume multiplier (default: 1.2). This is adjusted for higher timeframes.
**How It Works:**
1. **On each bar:**
- Check for the formation of new top or bottom fractals.
- Update the last top and bottom fractal levels if new fractals are found.
2. **Breakout Conditions:**
- For a buy breakout:
- The previous bar was not above the last top fractal level (i.e., no breakout in progress).
- The current bar closes above the last top fractal level.
- The current volume is greater than the median volume of previous buy breakouts multiplied by the adaptive multiplier (or if there are no previous buy breakouts, the volume condition is skipped).
- Similarly for sell breakout.
3. **Update Arrays:**
- When a breakout occurs, the current volume is added to the respective array (buyVolumes for buy, sellVolumes for sell) and the array is trimmed to the specified lookback period.
4. **Signal Generation:**
- A buy signal is plotted as a green "BUY" label below the bar.
- A sell signal is plotted as a red "SELL" label above the bar.
5. **Alerts:**
- Alerts are triggered when a breakout signal occurs.
**Additional Notes:**
- The median is calculated as the middle value of the sorted array (or the average of the two middle values for even-sized arrays).
- The adaptive multiplier ensures that on higher timeframes (like 1 hour and above) the volume requirement is less strict because volume patterns differ.
**Potential Use:**
Traders can use this indicator to identify potential trend continuations or reversals with volume confirmation. The adaptive volume filter makes it suitable for multiple timeframes.
Open-source script
In true TradingView spirit, the creator of this script has made it open-source, so that traders can review and verify its functionality. Kudos to the author! While you can use it for free, remember that republishing the code is subject to our House Rules.
Disclaimer
The information and publications are not meant to be, and do not constitute, financial, investment, trading, or other types of advice or recommendations supplied or endorsed by TradingView. Read more in the Terms of Use.