OPEN-SOURCE SCRIPT
Updated Seasonal Trend by LogReturn
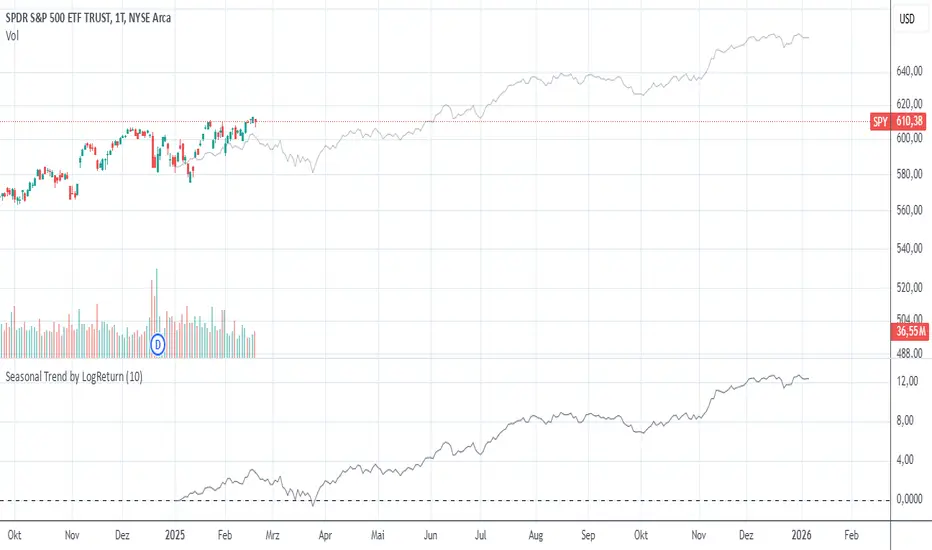
Seasonal trend in terms of stocks refers to typical and recurring patterns in stock prices that happen at a specific time of the year. There are many theories and beliefs regarding seasonal trends in the financial markets, and some traders use these patterns to guide their investment decisions.
This indicator calculates the trend by "Daily" logarithmic returns of the past years.
So, you should use this indicator with a "Daily" mainchart.
Note: If you select more years in the past than data is available, the line turns red.
This indicator calculates the trend by "Daily" logarithmic returns of the past years.
So, you should use this indicator with a "Daily" mainchart.
Note: If you select more years in the past than data is available, the line turns red.
Release Notes
refactoringRelease Notes
# added absolute values to main chartRelease Notes
added absolute values for entire yearRelease Notes
fixed bugOpen-source script
In true TradingView spirit, the creator of this script has made it open-source, so that traders can review and verify its functionality. Kudos to the author! While you can use it for free, remember that republishing the code is subject to our House Rules.
Disclaimer
The information and publications are not meant to be, and do not constitute, financial, investment, trading, or other types of advice or recommendations supplied or endorsed by TradingView. Read more in the Terms of Use.
Open-source script
In true TradingView spirit, the creator of this script has made it open-source, so that traders can review and verify its functionality. Kudos to the author! While you can use it for free, remember that republishing the code is subject to our House Rules.
Disclaimer
The information and publications are not meant to be, and do not constitute, financial, investment, trading, or other types of advice or recommendations supplied or endorsed by TradingView. Read more in the Terms of Use.