PINE LIBRARY
Updated mZigzag
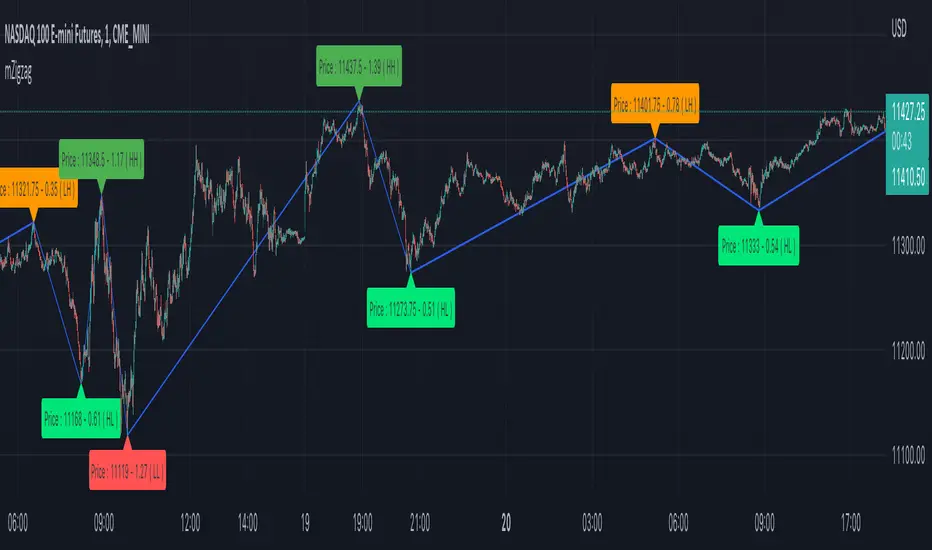
Library "mZigzag"
Matrix implementation of zigzag to allow further possibilities.
Main advantage of this library over previous zigzag methods is that you can attach any number of indicator/oscillator information to zigzag
calculate(length, ohlc, indicatorHigh, indicatorLow, numberOfPivots) calculates zigzag and related information
Parameters:
length: is zigzag length
ohlc: array of OHLC values to be used for zigzag calculation
indicatorHigh: Array of indicator values calculated based on high price of OHLC
indicatorLow: Array of indicators values calculated based on low price of OHLC
numberOfPivots: Number of pivots to be returned
Returns: pivotMatrix Matrix containing zigzag pivots, pivot bars, direction, ratio, and indicators added via indicatorHigh/indicatorLow
newZG is true if a new pivot is added to array
doubleZG is true if last calculation returned two new pivots (Happens on extreme price change)
draw(length, ohlc, indicatorLabels, indicatorHigh, indicatorLow, numberOfPivots, lineColor, lineWidth, lineStyle, showHighLow, showRatios, showIndicators) draws zigzag and related information
Parameters:
length: is zigzag length
ohlc: array of OHLC values to be used for zigzag calculation
indicatorLabels: Array of name of indicators passed
indicatorHigh: Array of indicator values calculated based on high price of OHLC
indicatorLow: Array of indicators values calculated based on low price of OHLC
numberOfPivots: Number of pivots to be returned
lineColor: zigzag line color. set to blue by default
lineWidth: zigzag line width. set to 1 by default
lineStyle: zigzag line style. set to line.style_solid by default
showHighLow: show HH, HL, LH, LL labels
showRatios: show pivot retracement ratios from previous zigzag
showIndicators: show indicator values
Returns: pivotMatrix Matrix containing zigzag pivots, pivot bars, direction, ratio, and indicators added via indicatorHigh/indicatorLow
zigzaglines array of zigzag lines
zigzaglabels array of zigzag labels
Release Notes
v2Updated:
draw(length, ohlc, indicatorLabels, indicatorHigh, indicatorLow, numberOfPivots, lineColor, lineWidth, lineStyle, showLabel, showIndicators) draws zigzag and related information
Parameters:
length: is zigzag length
ohlc: array of OHLC values to be used for zigzag calculation
indicatorLabels: Array of name of indicators passed
indicatorHigh: Array of indicator values calculated based on high price of OHLC
indicatorLow: Array of indicators values calculated based on low price of OHLC
numberOfPivots: Number of pivots to be returned
lineColor: zigzag line color. set to blue by default
lineWidth: zigzag line width. set to 1 by default
lineStyle: zigzag line style. set to line.style_solid by default
showLabel: Show pivot label
showIndicators: Include indicators in labels. If set to false, indicators are shown as tooltips
Returns: valueMatrix Matrix containing zigzag pivots for price and indicators
directionMatrix Matrix containing direction of price and indicator values at pivots
ratioMatrix Matrix containing ratios of price and indicator values at pivots
barArray Array containing pivot bars
zigzaglines array of zigzag lines
zigzaglabels array of zigzag labels
Release Notes
v3Updated:
calculate(length, ohlc, indicatorHigh, indicatorLow, numberOfPivots, supertrendLength) calculates zigzag and related information
Parameters:
length: is zigzag length
ohlc: array of OHLC values to be used for zigzag calculation
indicatorHigh: Array of indicator values calculated based on high price of OHLC
indicatorLow: Array of indicators values calculated based on low price of OHLC
numberOfPivots: Number of pivots to be returned
supertrendLength: is number of pivot history to calculate supertrend
Returns: valueMatrix Matrix containing zigzag pivots for price and indicators
directionMatrix Matrix containing direction of price and indicator values at pivots
ratioMatrix Matrix containing ratios of price and indicator values at pivots
divergenceMatrix matrix containing divergence details for each indicators
doubleDivergenceMatrix matrix containing double divergence details for each indicators
barArray Array containing pivot bars
supertrendDir is direction of zigzag based supertrend
supertrend is supertrend value of zigzag based supertrend
newZG is true if a new pivot is added to array
doubleZG is true if last calculation returned two new pivots (Happens on extreme price change)
Release Notes
v4Added:
calculate2(length, ohlc, indicatorHigh, indicatorLow, numberOfPivots, supertrendLength) calculates zigzag and related information uses shift/unshift rather than pop and push
Parameters:
length: is zigzag length
ohlc: array of OHLC values to be used for zigzag calculation
indicatorHigh: Array of indicator values calculated based on high price of OHLC
indicatorLow: Array of indicators values calculated based on low price of OHLC
numberOfPivots: Number of pivots to be returned
supertrendLength: is number of pivot history to calculate supertrend
Returns: valueMatrix Matrix containing zigzag pivots for price and indicators
directionMatrix Matrix containing direction of price and indicator values at pivots
ratioMatrix Matrix containing ratios of price and indicator values at pivots
divergenceMatrix matrix containing divergence details for each indicators
doubleDivergenceMatrix matrix containing double divergence details for each indicators
barArray Array containing pivot bars
supertrendDir is direction of zigzag based supertrend
supertrend is supertrend value of zigzag based supertrend
newZG is true if a new pivot is added to array
doubleZG is true if last calculation returned two new pivots (Happens on extreme price change)
Release Notes
v5Added:
calculateplain(length, ohlc, indicatorHigh, indicatorLow, numberOfPivots) calculates zigzag and related information uses shift/unshift rather than pop and push. Also does not calculate divergence and ratios.
Parameters:
length: is zigzag length
ohlc: array of OHLC values to be used for zigzag calculation
indicatorHigh: Array of indicator values calculated based on high price of OHLC
indicatorLow: Array of indicators values calculated based on low price of OHLC
numberOfPivots: Number of pivots to be returned
Returns: valueMatrix Matrix containing zigzag pivots for price and indicators
directionArray Matrix containing direction of price and indicator values at pivots
barArray Array containing pivot bars
newZG is true if a new pivot is added to array
doubleZG is true if last calculation returned two new pivots (Happens on extreme price change)
Removed:
calculate2(length, ohlc, indicatorHigh, indicatorLow, numberOfPivots, supertrendLength) calculates zigzag and related information uses shift/unshift rather than pop and push
Release Notes
v6Updated:
calculateplain(length, ohlc, indicatorHigh, indicatorLow, numberOfPivots) calculates zigzag and related information uses shift/unshift rather than pop and push. Also does not calculate divergence and ratios.
Parameters:
length: is zigzag length
ohlc: array of OHLC values to be used for zigzag calculation
indicatorHigh: Array of indicator values calculated based on high price of OHLC
indicatorLow: Array of indicators values calculated based on low price of OHLC
numberOfPivots: Number of pivots to be returned
Returns: valueMatrix Matrix containing zigzag pivots for price and indicators
directionArray Matrix containing direction of price and indicator values at pivots
barArray Array containing pivot bars
newZG is true if a new pivot is added to array
doubleZG is true if last calculation returned two new pivots (Happens on extreme price change)
Release Notes
v7Release Notes
v8Fixed an edge case highlighted by mortdiggiddy
Release Notes
v9Release Notes
v10Release Notes
v11Release Notes
v12Pine library
In true TradingView spirit, the author has published this Pine code as an open-source library so that other Pine programmers from our community can reuse it. Cheers to the author! You may use this library privately or in other open-source publications, but reuse of this code in publications is governed by House Rules.
Trial - trendoscope.io/trial
Subscribe - trendoscope.io/pricing
Blog - docs.trendoscope.io
Subscribe - trendoscope.io/pricing
Blog - docs.trendoscope.io
Disclaimer
The information and publications are not meant to be, and do not constitute, financial, investment, trading, or other types of advice or recommendations supplied or endorsed by TradingView. Read more in the Terms of Use.
Pine library
In true TradingView spirit, the author has published this Pine code as an open-source library so that other Pine programmers from our community can reuse it. Cheers to the author! You may use this library privately or in other open-source publications, but reuse of this code in publications is governed by House Rules.
Trial - trendoscope.io/trial
Subscribe - trendoscope.io/pricing
Blog - docs.trendoscope.io
Subscribe - trendoscope.io/pricing
Blog - docs.trendoscope.io
Disclaimer
The information and publications are not meant to be, and do not constitute, financial, investment, trading, or other types of advice or recommendations supplied or endorsed by TradingView. Read more in the Terms of Use.