OPEN-SOURCE SCRIPT
Updated Plots CAGR lines for a given set of rates
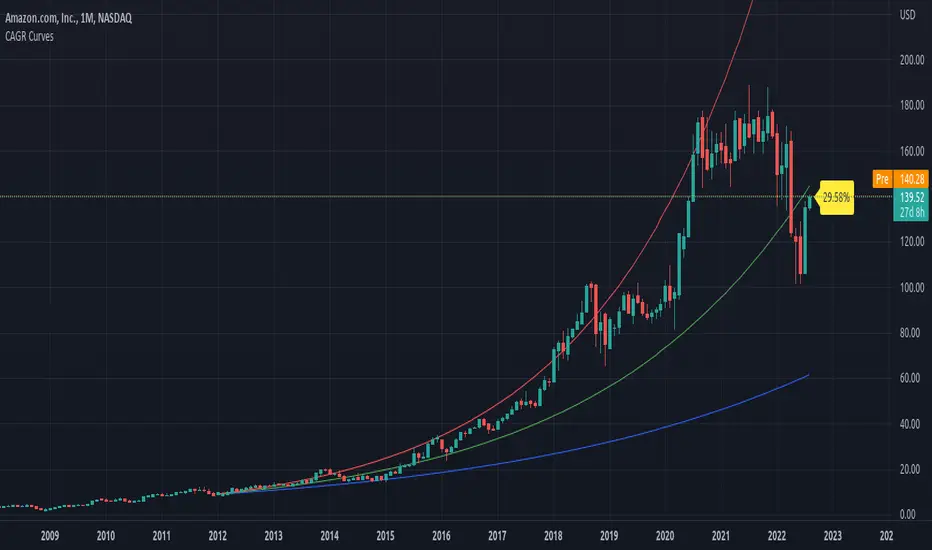
Plots CAGR lines for a given set of rates from a specified time. It will be helpful to see how the rate of growth of a security's price is changing over a period of time. It also calculates the current CAGR from the time specified. Works on D, W, M timeframes.
Release Notes
Added an ability to set custom start date on/off. If this option is unchecked (by default unchecked) earliest date available in TradingView for the security will be used as start date.Open-source script
In true TradingView spirit, the creator of this script has made it open-source, so that traders can review and verify its functionality. Kudos to the author! While you can use it for free, remember that republishing the code is subject to our House Rules.
Disclaimer
The information and publications are not meant to be, and do not constitute, financial, investment, trading, or other types of advice or recommendations supplied or endorsed by TradingView. Read more in the Terms of Use.
Open-source script
In true TradingView spirit, the creator of this script has made it open-source, so that traders can review and verify its functionality. Kudos to the author! While you can use it for free, remember that republishing the code is subject to our House Rules.
Disclaimer
The information and publications are not meant to be, and do not constitute, financial, investment, trading, or other types of advice or recommendations supplied or endorsed by TradingView. Read more in the Terms of Use.