OPEN-SOURCE SCRIPT
Updated Volume Performance Table (Weekdays Only)

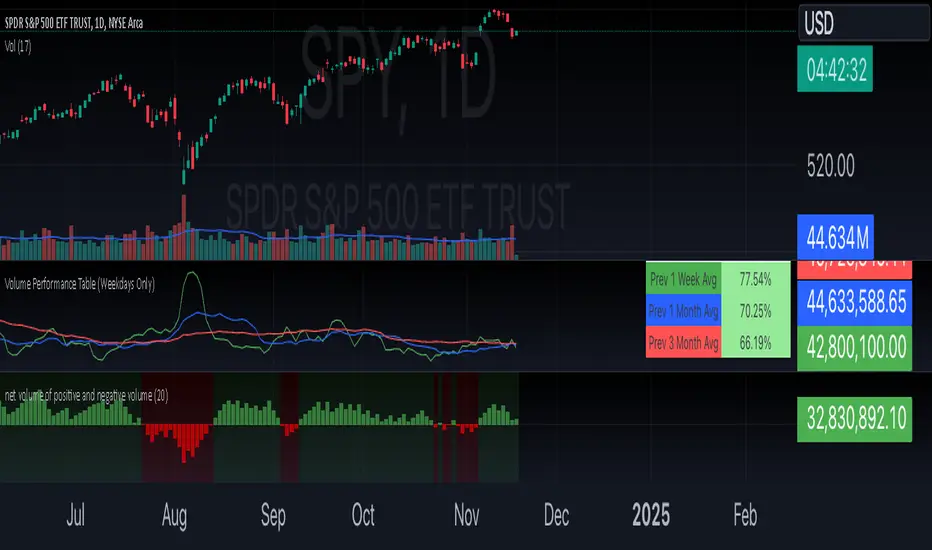
This is a volume performance table that compares the volume from the previous trading day to the average daily volume from the previous week, month, 3-month, 6-month, and 12-month period in order to show where the rate of change of volume is contributing to the price trend.
For example, if the price trend is bullish and volume is accelerating, that is a bullish confirmation.
If the price is bearish and volume is accelerating, that is a bearish confirmation.
If the price is bullish and volume is decelerating, that is a bearish divergence.
If the price is bearish and volume is decelerating, that is a bullish divergence.
This does not include weekend trading when applied to digital assets such as cryptocurrencies.
Release Notes
This is a volume performance table that compares the volume from the previous trading day to the average daily volume from the previous week, 1-month, and 3-month period in order to show how the rate of change of volume is contributing to the price trend.Green = Average 1-week volume
Blue = Average 1-month volume
Red = Average 3-month volume
For example, if the price trend is bullish and volume is accelerating, that is a bullish confirmation.
If the price is bearish and volume is accelerating, that is a bearish confirmation.
If the price is bullish and volume is decelerating, that is a bearish divergence.
If the price is bearish and volume is decelerating, that is a bullish divergence.
This does not include weekend trading when applied to digital assets such as cryptocurrencies.
Release Notes
Updated time framesOpen-source script
In true TradingView spirit, the creator of this script has made it open-source, so that traders can review and verify its functionality. Kudos to the author! While you can use it for free, remember that republishing the code is subject to our House Rules.
Disclaimer
The information and publications are not meant to be, and do not constitute, financial, investment, trading, or other types of advice or recommendations supplied or endorsed by TradingView. Read more in the Terms of Use.
Open-source script
In true TradingView spirit, the creator of this script has made it open-source, so that traders can review and verify its functionality. Kudos to the author! While you can use it for free, remember that republishing the code is subject to our House Rules.
Disclaimer
The information and publications are not meant to be, and do not constitute, financial, investment, trading, or other types of advice or recommendations supplied or endorsed by TradingView. Read more in the Terms of Use.