OPEN-SOURCE SCRIPT
Updated 10X Market Direction
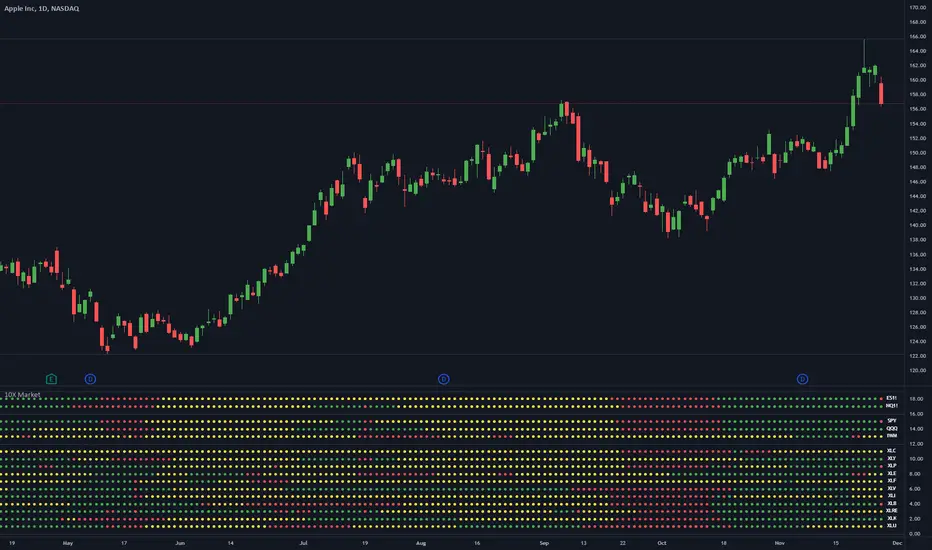
My interpretation of John Carter's popular Simpler Trading 10X Bars indicator. Now you can see directional market strength for a variety of key futures , indices and industry groups for quick comparison with individual stocks.
Momentum is displayed to quickly see the quality and strength of a trend based on a calculation of the Directional Movement Index (DMI). The DMI is an indicator developed by J. Welles Wilder in 1978 that identifies in which direction the price of an asset is moving. The DMI is calculated by comparing prior highs and lows and produces 2 measurements illustrating the strength of the current trend:
-> a positive directional movement line ( +DI ); and
-> a negative directional movement line ( -DI ).
The average directional index ( ADX ) measures the strength of the current trend, either +DI or +DI ; a reading above 20 typically indicates a strong trend.
-> Green bars indicate an uptrend i.e. when +DI is above -DI and ADX is greater than 20 - there is more upward pressure than downward pressure in the price;
-> Red bars indicate a downtrend i.e. when -DI is above +DI and ADX is greater than 20 - there is more downward pressure on the price; and
-> Yellow bars indicate no strong directional trend and potential for a reversal.
This indicator should compliment other popular indicators, as confirmation whether to stay in a position or not.
Release Notes
Changed the overlay setting so that the indicator moves to a new pane when addedOpen-source script
In true TradingView spirit, the creator of this script has made it open-source, so that traders can review and verify its functionality. Kudos to the author! While you can use it for free, remember that republishing the code is subject to our House Rules.
Disclaimer
The information and publications are not meant to be, and do not constitute, financial, investment, trading, or other types of advice or recommendations supplied or endorsed by TradingView. Read more in the Terms of Use.
Open-source script
In true TradingView spirit, the creator of this script has made it open-source, so that traders can review and verify its functionality. Kudos to the author! While you can use it for free, remember that republishing the code is subject to our House Rules.
Disclaimer
The information and publications are not meant to be, and do not constitute, financial, investment, trading, or other types of advice or recommendations supplied or endorsed by TradingView. Read more in the Terms of Use.