OPEN-SOURCE SCRIPT
Updated Dynamic Momentum Bands | AlphaAlgos
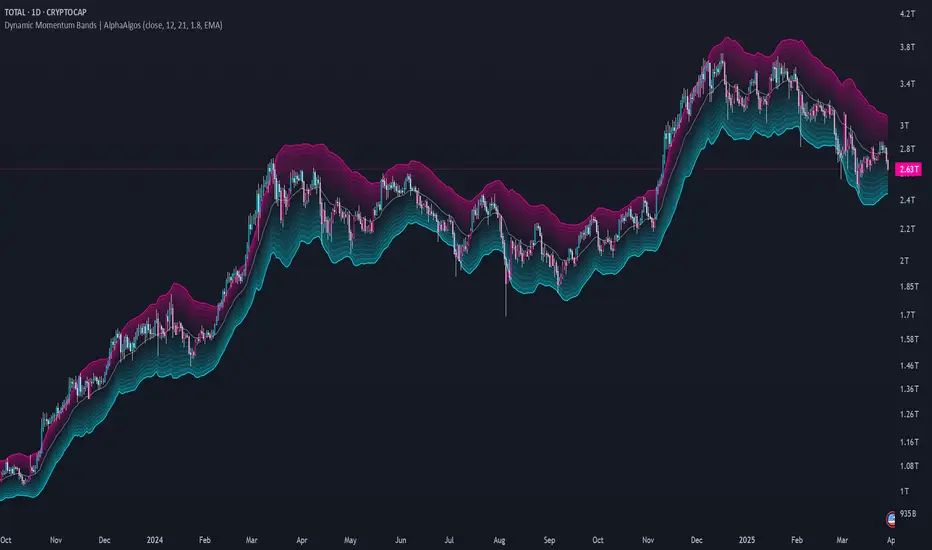
Dynamic Momentum Bands | AlphaAlgos
Overview
The Dynamic Momentum Bands indicator is an advanced technical analysis tool that combines multiple analytical techniques to provide a comprehensive view of market momentum and trend dynamics. By integrating RSI (Relative Strength Index), volatility analysis, and adaptive moving averages, this indicator offers traders a nuanced perspective on market conditions.
Key Features
Technical Methodology
The indicator employs a sophisticated approach to market analysis:
1. Momentum Calculation
2. Band Construction
Configuration Options
Core Settings:
Visual Settings:
Trend Identification
The indicator provides trend insights through:
Trading Applications
Trend Following:
- Use band position relative to price as trend indicator
- Identify momentum shifts through color changes
- Utilize gradient zones for trend strength assessment
Volatility Analysis:
Best Practices
This indicator is provided for informational purposes only. Always use proper risk management when trading. Past performance is not indicative of future results. Not financial Advise
Overview
The Dynamic Momentum Bands indicator is an advanced technical analysis tool that combines multiple analytical techniques to provide a comprehensive view of market momentum and trend dynamics. By integrating RSI (Relative Strength Index), volatility analysis, and adaptive moving averages, this indicator offers traders a nuanced perspective on market conditions.
Key Features
- Adaptive band calculation based on price momentum
- Integrated RSI-driven volatility scaling
- Multiple moving average type options (EMA, SMA, VWMA)
- Smooth, gradient-based band visualization
- Optional price bar coloring for trend identification
Technical Methodology
The indicator employs a sophisticated approach to market analysis:
1. Momentum Calculation
- Calculates RSI using a customizable length
- Uses RSI to dynamically adjust band volatility
- Scales band width based on distance from the 50 RSI level
2. Band Construction
- Applies a selected moving average type to the price source
- Calculates deviation using ATR (Average True Range)
- Smooths band edges for improved visual clarity
Configuration Options
Core Settings:
- Price Source: Choose the price data used for calculations
- RSI Length: Customize the RSI calculation period (1-50)
- Band Length: Adjust the moving average period (5-100)
- Volatility Multiplier: Fine-tune band width
- Band Type: Select between EMA, SMA, and VWMA
Visual Settings:
- Bar Coloring: Toggle color-coded price bars
- Gradient-based band visualization
- Smooth color transitions for trend representation
Trend Identification
The indicator provides trend insights through:
- Color-coded bands (blue for bullish, pink for bearish)
- Smooth gradient visualization
- Optional price bar coloring
Trading Applications
Trend Following:
- Use band position relative to price as trend indicator
- Identify momentum shifts through color changes
- Utilize gradient zones for trend strength assessment
Volatility Analysis:
- Observe band width changes
- Detect potential breakout or consolidation periods
- Use RSI-driven volatility scaling for market context
Best Practices
- Adjust RSI length to match trading timeframe
- Experiment with different moving average types
- Use in conjunction with other technical indicators
- Consider volatility multiplier for different market conditions
This indicator is provided for informational purposes only. Always use proper risk management when trading. Past performance is not indicative of future results. Not financial Advise
Release Notes
Update to UI ColoringOpen-source script
In true TradingView spirit, the creator of this script has made it open-source, so that traders can review and verify its functionality. Kudos to the author! While you can use it for free, remember that republishing the code is subject to our House Rules.
Disclaimer
The information and publications are not meant to be, and do not constitute, financial, investment, trading, or other types of advice or recommendations supplied or endorsed by TradingView. Read more in the Terms of Use.
Open-source script
In true TradingView spirit, the creator of this script has made it open-source, so that traders can review and verify its functionality. Kudos to the author! While you can use it for free, remember that republishing the code is subject to our House Rules.
Disclaimer
The information and publications are not meant to be, and do not constitute, financial, investment, trading, or other types of advice or recommendations supplied or endorsed by TradingView. Read more in the Terms of Use.