OPEN-SOURCE SCRIPT
EMA Crossover with RSI Filter
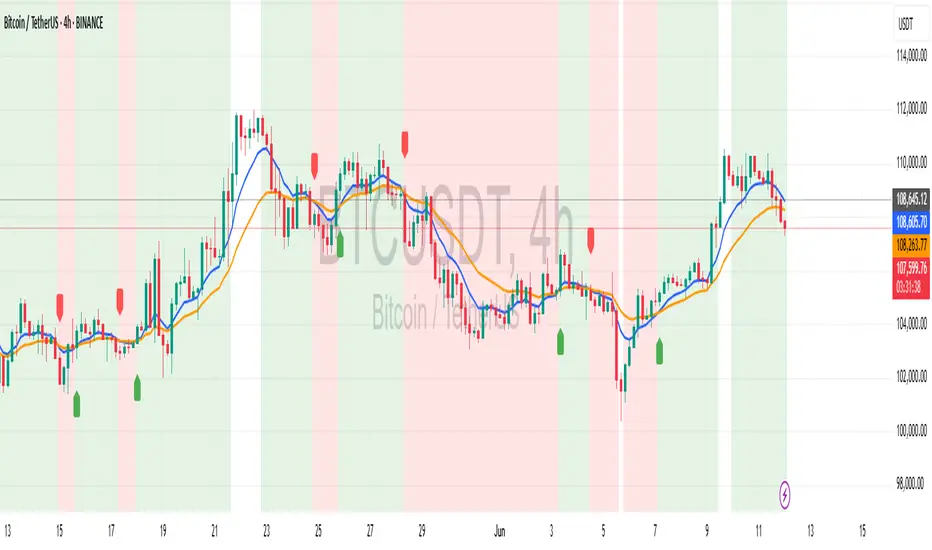
What this indicator does:
Plots two EMAs (default: 9 & 21).
Uses RSI to filter entries (avoids buy signals when RSI is overbought, sell signals when RSI is oversold).
Gives simple visual buy/sell signals when EMA crossovers occur and RSI confirms.
Light background color to visualize bullish/bearish conditions.
Plots two EMAs (default: 9 & 21).
Uses RSI to filter entries (avoids buy signals when RSI is overbought, sell signals when RSI is oversold).
Gives simple visual buy/sell signals when EMA crossovers occur and RSI confirms.
Light background color to visualize bullish/bearish conditions.
Open-source script
In true TradingView spirit, the creator of this script has made it open-source, so that traders can review and verify its functionality. Kudos to the author! While you can use it for free, remember that republishing the code is subject to our House Rules.
Disclaimer
The information and publications are not meant to be, and do not constitute, financial, investment, trading, or other types of advice or recommendations supplied or endorsed by TradingView. Read more in the Terms of Use.