OPEN-SOURCE SCRIPT
[LeonidasCrypto]Volume Force Index
Volume Force Index (VFI)
Overview
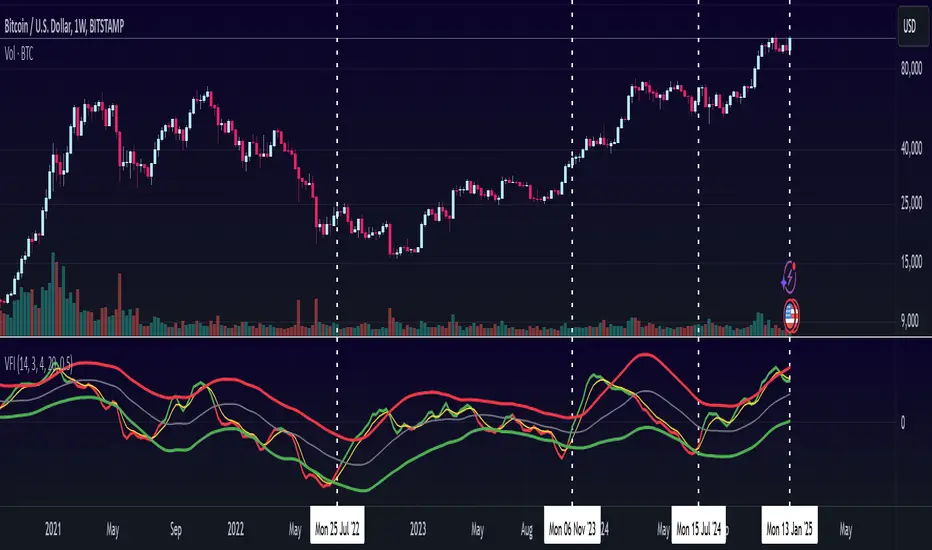
The Volume Force Index (VFI) is a technical indicator that measures the balance between buying and selling pressure in the market by analyzing volume patterns. It helps traders identify potential trend reversals and confirm trend strength.
What It Measures
Buying vs. selling volume pressure
Market momentum
Potential overbought/oversold conditions
Volume trend strength
How to Read the Indicator
Main Components:
Main Line (Green/Red)
Green: Buying pressure is dominant
Red: Selling pressure is dominant
The steeper the slope, the stronger the pressure
Signal Line (Yellow)
Fast EMA that helps identify trend changes
Acts as an early warning system for potential reversals
Dynamic Bands (Red/Green lines)
Adapt to market volatility
Help identify extreme conditions
Based on actual market volatility rather than fixed levels
Signals to Watch
Trend Direction:
Rising oscillator = Increasing buying pressure
Falling oscillator = Increasing selling pressure
Signal Line Crossovers:
Main line crosses above signal line = Potential bullish signal
Main line crosses below signal line = Potential bearish signal
Band Touches:
Touching upper band = Possible buying exhaustion
Touching lower band = Possible selling exhaustion
Color Changes:
Green to Red = Shift to selling pressure
Red to Green = Shift to buying pressure
Best Practices
When to Use:
Trend confirmation
Identifying potential reversals
Volume analysis
Market strength assessment
Tips:
Use in conjunction with price action
Look for divergences with price
More reliable on higher timeframes
Consider market context
Default Settings:
MA Period: 14 (volume calculation)
Smooth Length: 3 (noise reduction)
EMA Period: 4 (signal line)
Volatility Period: 20 (band calculation)
Volatility Multiplier: 1.5 (band width)
Best Markets to Apply
Any market with reliable volume data
Summary
The VFI is a powerful tool that combines volume analysis with trend identification. Its adaptive nature makes it suitable for various market conditions, but it should be used as part of a complete trading strategy, not in isolation.
Overview
The Volume Force Index (VFI) is a technical indicator that measures the balance between buying and selling pressure in the market by analyzing volume patterns. It helps traders identify potential trend reversals and confirm trend strength.
What It Measures
Buying vs. selling volume pressure
Market momentum
Potential overbought/oversold conditions
Volume trend strength
How to Read the Indicator
Main Components:
Main Line (Green/Red)
Green: Buying pressure is dominant
Red: Selling pressure is dominant
The steeper the slope, the stronger the pressure
Signal Line (Yellow)
Fast EMA that helps identify trend changes
Acts as an early warning system for potential reversals
Dynamic Bands (Red/Green lines)
Adapt to market volatility
Help identify extreme conditions
Based on actual market volatility rather than fixed levels
Signals to Watch
Trend Direction:
Rising oscillator = Increasing buying pressure
Falling oscillator = Increasing selling pressure
Signal Line Crossovers:
Main line crosses above signal line = Potential bullish signal
Main line crosses below signal line = Potential bearish signal
Band Touches:
Touching upper band = Possible buying exhaustion
Touching lower band = Possible selling exhaustion
Color Changes:
Green to Red = Shift to selling pressure
Red to Green = Shift to buying pressure
Best Practices
When to Use:
Trend confirmation
Identifying potential reversals
Volume analysis
Market strength assessment
Tips:
Use in conjunction with price action
Look for divergences with price
More reliable on higher timeframes
Consider market context
Default Settings:
MA Period: 14 (volume calculation)
Smooth Length: 3 (noise reduction)
EMA Period: 4 (signal line)
Volatility Period: 20 (band calculation)
Volatility Multiplier: 1.5 (band width)
Best Markets to Apply
Any market with reliable volume data
Summary
The VFI is a powerful tool that combines volume analysis with trend identification. Its adaptive nature makes it suitable for various market conditions, but it should be used as part of a complete trading strategy, not in isolation.
Open-source script
In true TradingView spirit, the creator of this script has made it open-source, so that traders can review and verify its functionality. Kudos to the author! While you can use it for free, remember that republishing the code is subject to our House Rules.
Trading for living!
Disclaimer
The information and publications are not meant to be, and do not constitute, financial, investment, trading, or other types of advice or recommendations supplied or endorsed by TradingView. Read more in the Terms of Use.