OPEN-SOURCE SCRIPT
Updated basifx 3 SMA cross
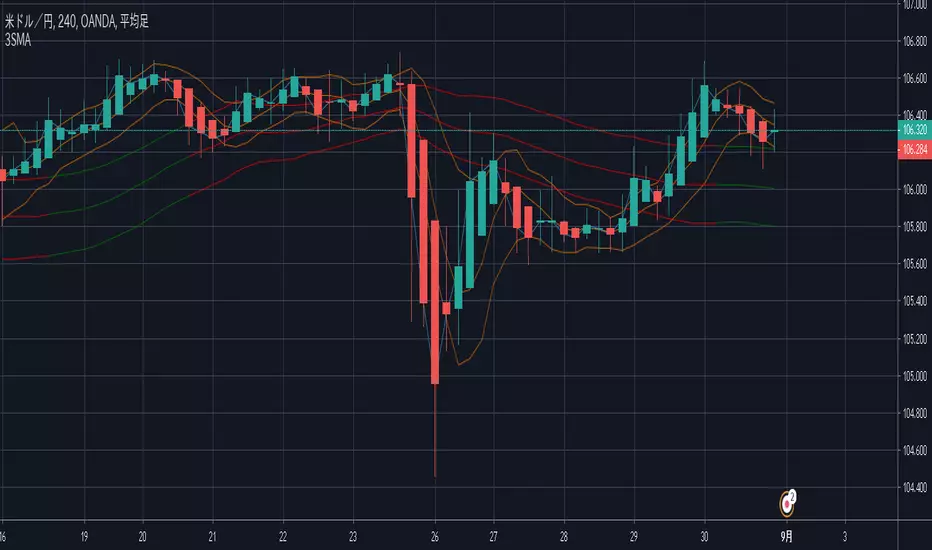
5 SMA(high, low, close) = short-term line(Orange)
34 SMA(high, low, close) = long-term line(Green & Red)
If 5 SMA is above 34 SMA = Green color, If 5 SMA is below 34 SMA = Red color
34 SMA(high, low, close) = long-term line(Green & Red)
If 5 SMA is above 34 SMA = Green color, If 5 SMA is below 34 SMA = Red color
Release Notes
plot title modifiedOpen-source script
In true TradingView spirit, the creator of this script has made it open-source, so that traders can review and verify its functionality. Kudos to the author! While you can use it for free, remember that republishing the code is subject to our House Rules.
Disclaimer
The information and publications are not meant to be, and do not constitute, financial, investment, trading, or other types of advice or recommendations supplied or endorsed by TradingView. Read more in the Terms of Use.
Open-source script
In true TradingView spirit, the creator of this script has made it open-source, so that traders can review and verify its functionality. Kudos to the author! While you can use it for free, remember that republishing the code is subject to our House Rules.
Disclaimer
The information and publications are not meant to be, and do not constitute, financial, investment, trading, or other types of advice or recommendations supplied or endorsed by TradingView. Read more in the Terms of Use.