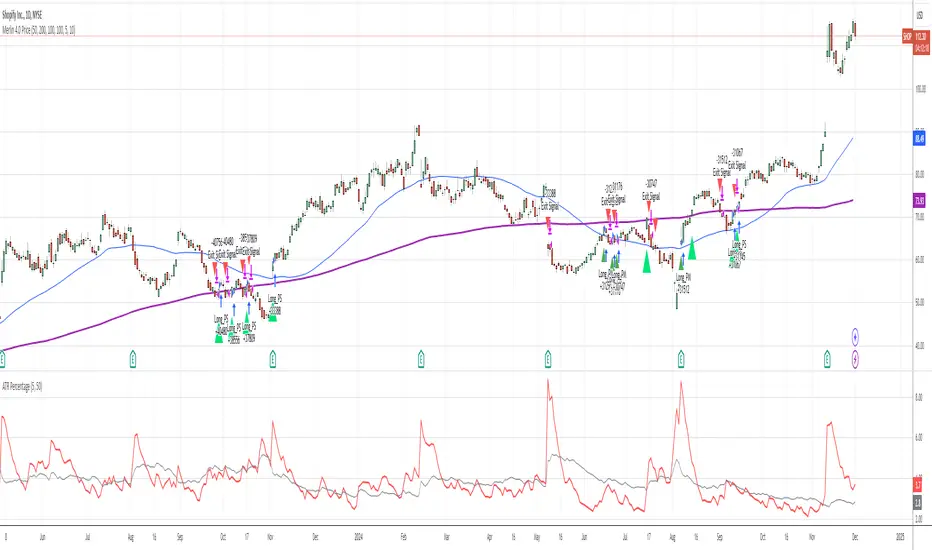
ATR % Line from LoD/HoDATR % Line Trading Indicator - Entry Filter Tool
This Pine Script creates a sophisticated ATR (Average True Range) percentage-based entry filter indicator for TradingView that helps traders avoid buying overextended stocks and identify optimal entry zones based on volatility.
Core Functionality - Entry Discipline
The script calculates a maximum entry threshold by taking a percentage of the Average True Range (ATR) and projecting it from the current day's low. This creates a dynamic "no-buy zone" that adapts to market volatility, helping traders avoid purchasing stocks that have already moved too far from their daily base.
Key Calculation:
Measures the ATR over a specified period (default: 14 bars)
Takes a user-defined percentage of that ATR (default: 25%)
Projects this distance from the day's low to establish a maximum entry threshold
Entry Rule: Avoid buying when price exceeds this ATR% level from the daily low or high.
Visual Features
Entry Threshold Line:
Draws a horizontal line at the calculated maximum entry level
Line extends forward for clear visualization of the "no-buy zone"
Red zones above this line indicate overextended conditions
Fully customizable appearance with color, width, and style options
Smart Entry Alerts:
Optional labels show the ATR percentage threshold and exact price level
Visual confirmation when stocks are trading in acceptable entry zones vs. extended areas
Real-Time Monitoring Table:
Displays current distance from daily low as ATR percentage
Shows whether current price is in "safe entry zone" or "extended territory"
Customizable display options for clean chart analysis
Practical Applications for Entry Management
Avoiding Extended Entries:
Primary Use: Don't initiate long positions when price is more than X% ATR from the daily low
Prevents buying stocks that have already made their daily move
Reduces risk of buying at temporary tops within the trading session
Entry Zone Identification:
Price trading below the ATR% line = potential entry opportunity
Price trading above the ATR% line = wait for pullback or skip the trade
Combines volatility analysis with momentum discipline
Risk Management Benefits:
Improved Entry Timing: Enter closer to daily support levels
Better Risk/Reward: Shorter distance to stop loss (daily low)
Reduced Chasing: Systematic approach prevents FOMO-driven entries
Volatility Awareness: Higher volatility stocks get wider acceptable entry ranges
Configuration for Entry Filtering
Key Settings for Entry Management:
ATR Percentage: Set your maximum acceptable extension (15-30% common for day trading)
Reference Point: Use "Low" to measure extension from daily base
Line Style: Make highly visible to clearly see entry threshold
Alert Integration: Visual confirmation of entry-friendly zones
Typical Usage Scenarios:
Conservative Entries: 15-20% ATR from daily low
Moderate Extensions: 25-35% ATR for stronger momentum plays
Aggressive Setups: 40%+ ATR for breakout situations (use with caution)
Entry Strategy Integration
Pre-Market Planning:
Set ATR% threshold based on stock's typical volatility
Identify key levels where entries become unfavorable
Plan alternative entry strategies for extended stocks
Intraday Execution:
Monitor real-time ATR% extension from daily low
Avoid new long positions when threshold is exceeded
Wait for pullbacks to re-enter acceptable entry zones
This tool transforms volatility analysis into practical entry discipline, helping traders maintain consistent entry standards and avoid the costly mistake of chasing overextended stocks. By respecting ATR-based extension limits, traders can improve their entry timing and overall trade profitability.
Atrpercentage
ATR Plots + OverlayATR Plots + Overlay
This tool calculates and displays Average True Range (ATR)-based levels on your chart for any selected timeframe, giving traders a quick visual reference for expected price movement relative to the most recent bar’s open price. It plots guide levels above and below that open and shows how much of the typical ATR-based range has already been covered—all in one interactive table and on-chart overlay.
What It Does
ATR Calculation:
Uses true range data over a user-defined period (default 14), smoothed via RMA, SMA, EMA, or WMA, on the selected timeframe (e.g., 1h, 4h, daily) to calculate the ATR value.
Projected Levels:
Plots four reference levels relative to the open price of the most recent bar on the chosen timeframe:
+100% ATR: Open + ATR
+50% ATR: Open + 50% of ATR
−50% ATR: Open − 50% of ATR
−100% ATR: Open − ATR
Coverage %:
Tracks high and low prices for the current session on the selected timeframe and calculates what percentage of the ATR has already been covered:
Coverage % = (High − Low) ÷ ATR × 100
Interactive Table:
Shows the ATR value and current coverage percentage in a customizable table overlay. Position, color scheme, borders, transparency, and an optional empty top row are all adjustable via settings.
Customization Options
Table Settings:
Position the table (top/bottom × left/right).
Customize background color, text color, border color, and thickness.
Optionally add an empty top row for spacing.
Line Settings:
Choose color, line style (solid/dotted/dashed), and width.
Lines automatically update with each new bar on the selected timeframe, anchored to that bar’s open price.
General Inputs:
ATR length (number of bars).
Smoothing method (RMA, SMA, EMA, WMA).
Timeframe selection for ATR calculations (e.g., 15m, 1h, Daily).
How to Use It for Trading
Measure Volatility: Quickly gauge the expected price movement based on ATR for any timeframe.
Identify Overextension: Use the coverage % to see how much of the expected ATR range is already consumed.
Plan Entries & Exits: Align trade targets and stops with ATR levels for more objective planning.
Visual Reference: Horizontal guide lines and table update automatically as new bars form, keeping information clear and actionable.
Ideal For
Intraday traders using ATR levels to frame trades.
Swing traders wanting ATR-based reference points for larger timeframes.
Anyone seeking a volatility-based framework for planning stops, targets, or identifying overextended conditions.

ATR Buy, Target, Stop + OverlayATR Buy, Target, Stop + Overlay
This tool is to assist traders with precise trade planning using the Average True Range (ATR) as a volatility-based reference.
This script plots buy, target, and stop-loss levels on the chart based on a user-defined buy price and ATR-based multipliers, allowing for objective and adaptive trade management.
*NOTE* In order for the indicator to initiate plotted lines and table values a non-zero number must be entered into the settings.
What It Does:
Buy Price Input: Users enter a manual buy price (e.g., an executed or planned trade entry).
ATR-Based Target and Stop: The script calculates:
Target Price = Buy + (ATR × Target Multiplier)
Stop Price = Buy − (ATR × Stop Multiplier)
Customizable Timeframe: Optionally override the ATR timeframe (e.g., use daily ATR on a 1-hour chart).
Visual Overlay: Lines are drawn directly on the price chart for the Buy, Target, and Stop levels.
Interactive Table: A table is displayed with relevant levels and ATR info.
Customization Options:
Line Settings:
Adjust color, style (solid/dashed/dotted), and width for Buy, Target, and Stop lines.
Choose whether to extend lines rightward only or in both directions.
Table Settings:
Choose position (top/bottom, left/right).
Toggle individual rows for Buy, Target, Stop, ATR Timeframe, and ATR Value.
Customize text color and background transparency.
How to Use It for Trading:
Plan Your Trade: Enter your intended buy price when planning a trade.
Assess Risk/Reward: The script immediately visualizes the potential stop-loss and target level, helping assess R:R ratios.
Adapt to Volatility: Use ATR-based levels to scale stop and target dynamically depending on current market volatility.
Higher Timeframe ATR: Select a different timeframe for the ATR calculation to smooth noise on lower timeframe charts.
On-the-Chart Reference: Visually track trade zones directly on the price chart—ideal for live trading or strategy backtesting.
Ideal For:
Swing traders and intraday traders
Risk management and trade planning
Traders using ATR-based exits or scaling
Visualizing asymmetric risk/reward setups
How I Use This:
After entering a trade, adding an entry price will plot desired ATR target and stop level for visualization.
Adjusting ATR multiplier values assists in evaluating and planning trades.
Visualization assists in comparing ATR multiples to recent support and resistance levels.

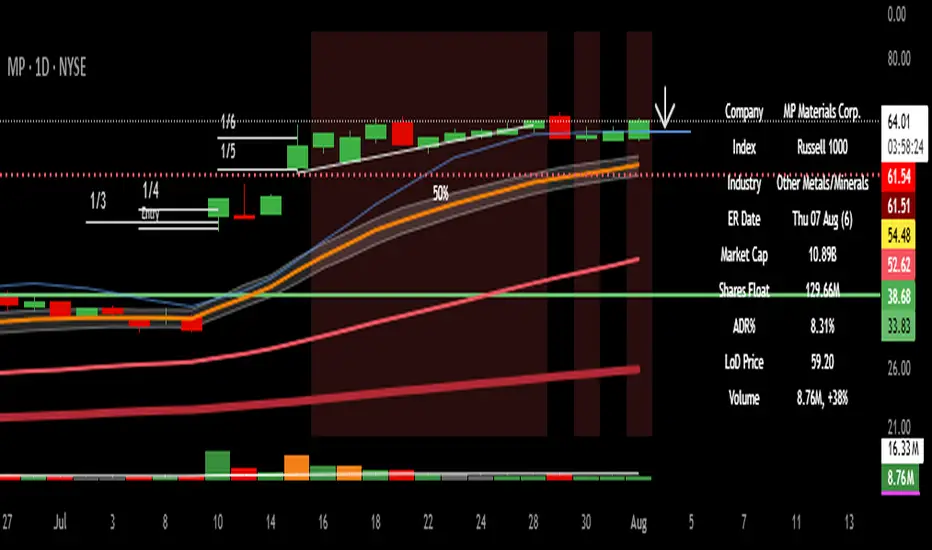
ADR, ATR & VOL OverlayThis is a combined version of 2 of my other indicators:
ADR / ATR Overlay
VOL / AVG Overlay
This indicator will display the following as an overlay on your chart:
ADR
% of ADR
ADR % of Price
ATR
% of ATR
ATR % of Price
Custom Session Volume
Average For Selected Session
Volume Percentage Comparison
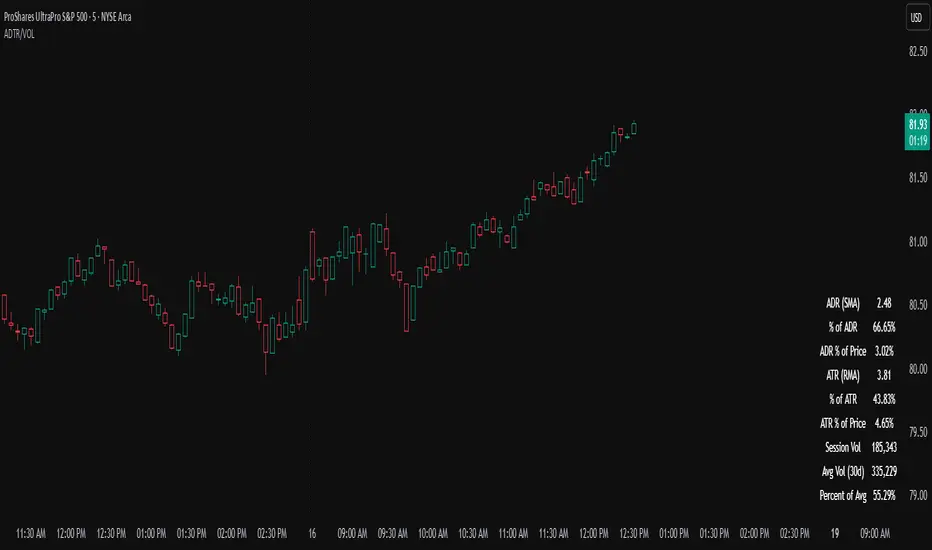
Description:
ADR : Average Day Range
% of ADR : Percentage that the current price move has covered its average.
ADR % of Price : The percentage move implied by the average range.
ATR : Average True Range
% of ATR : Percentage that the current price move has covered its average.
ATR % of Price : The percentage move implied by the average true range.
Custom Session Volume : User chosen time frame to monitor volume
Average For Selected Session : Average for the custom session volume
Volume Percentage Comparison : Current session compared to the average (calculated at session close)
Options:
ADR/ATR:
Time Frame
Length
Smoothing
Volume:
Set Custom Time Frame For Calculations
Set Custom Time Frame For Average Comparison
Set Custom Time Zone
Table:
Enable / Disable Each Value
Change Text Color
Change Background Color
Change Table location
Add/Remove extra row for placement
ADR / ATR Example:
The ADR and ATR can be used to provide information about average price moves to help set targets, stop losses, entries and exits based on the potential average moves.
Example: If the "% of ADR" is reading 100%, then 100% of the asset's average price range has been covered, suggesting that an additional move beyond the range has a lower probability.
Example: "ADR % of Price" provides potential price movement in percentage which can be used to asses R/R for asset.
Example: ADR (D) reading is 100% at market close but ATR (D) is at 70% at close. This suggests that there is a potential (coverage) move of 30% in Pre/Post market as suggested by averages.
Custom Volume Session Example:
Set indicator to 30 period average. Set custom time frame to 9:30am to 10:30am Eastern/New York.
When the time frame for the calculation is closed, the indicator will provide a comparison of the current days volume compared to the average of 30 previous days for that same time frame and display it as a percentage in the table.
In this example you could compare how the first hour of the trading day compares to the previous 30 day's average, aiding in evaluating the potential volume for the remainder of the day.
Notes:
Times must be entered in 24 hour format. (1pm = 13:00 etc.)
Volume indicator is for Intra-day time frames, not > Day.
How I use these values:
I use these calculations to determine if a ticker symbol has the necessary range to achieve target gains, to determine if the price oscillation is within "normal" ranges to determine if the trading day will be choppy, and to determine placement of stops and targets within average ranges in combination with support, resistance and retracement levels.
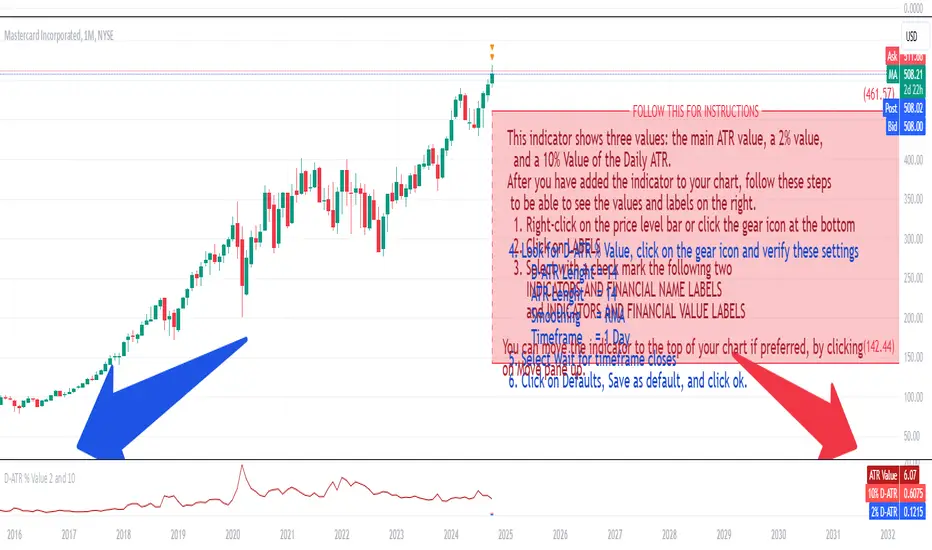
Daily ATR 2 and 10 Percent Value
This indicator shows three values: the main ATR value, a 2% value,
and a 10% Value of the Daily ATR.
After you have added the indicator to your chart, follow these steps
to be able to see the values and labels on the right.
1. Right-click on the price level bar or click the gear icon at the bottom
2. Click on LABELS
3. Select with a check mark the following two
INDICATORS AND FINANCIAL NAME LABELS
and INDICATORS AND FINANCIAL VALUE LABELS
4. Look for D-ATR % Value, click on the gear icon and verify these settings
- D-ATR Lenght = 14
- ATR Lenght = 14
- Smoothing = RMA
- Timeframe = 1 Day
5. Select Wait for timeframe closes
6. Click on Defaults, Save as default, and click ok.
You can move the indicator to the top of your chart if preferred, by clicking
on Move pane up.
Slightly modifications from other indicators.
ATR PercentageThe ATR is a great indicator, but for me, it does not define the volatility of an asset I am looking at well enough. So I've adjusted it to be displayed as the usual ATR and a percentage of the closing prince (which to me tells a better story). I find this useful if I am looking through many assets and have to create a quick picture of volatility.
Indicator Definition: The script starts by defining an indicator named "ATR Percentage" that will be displayed in a separate pane (not overlayed on the price chart).
Input for ATR Period: The user can set the period for calculating the ATR through an input field.
ATR Calculation: The ta.atr function calculates the Average True Range based on the specified period.
ATR Percentage Calculation: The ATR value is converted to a percentage of the current closing price using (atrValue / close) * 100.
Plotting:
The script plots both the ATR value and its percentage on the chart.
A horizontal line at zero is added for reference.
Label Display: An optional label displays the current ATR percentage at every 10th bar to avoid cluttering the chart.
Background Color: A light blue background is added to visually separate the ATR indicator from other indicators.
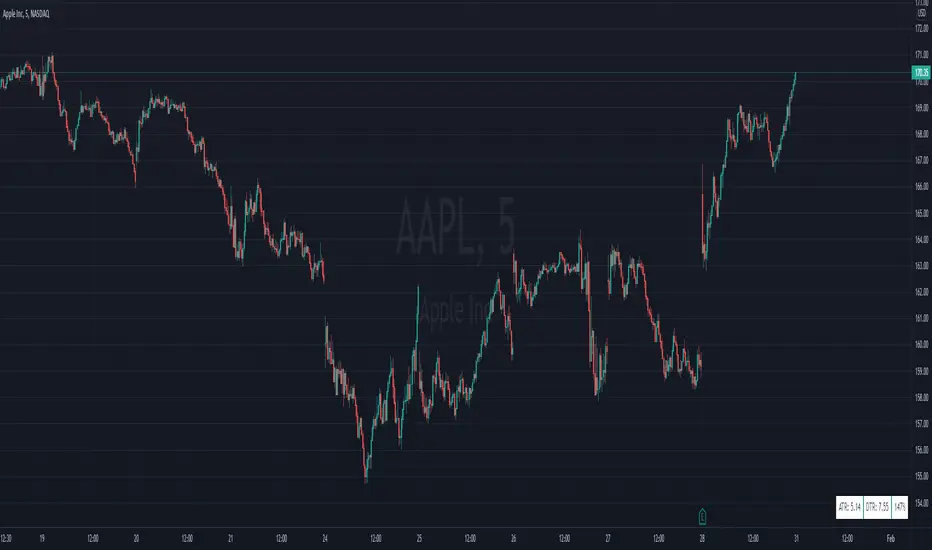
ATR vs Day Trading Range and PercentageThis indicator displays the Current Daily ATR vs the current Day Range and displays the percentage.
For example if the Daily ATR is $5 and the current range of the day is $10 this would be 200% the original move.
It is color coded (and can be modified) to change color when the Daily range is over 100% the ATR.
The time frame can be changed from Daily just be aware you must be on a lower timeframe then selected. So if you want to compare the current 30 minute ATR to the current 30 minute range you will need to be showing a 30 min chart or lower for it to calculate correctly.