Average Price LineThis was published in substitute of the original AVG price line that was already implemented into TradingVIew.
Get the average price in the desired range you want.
Average
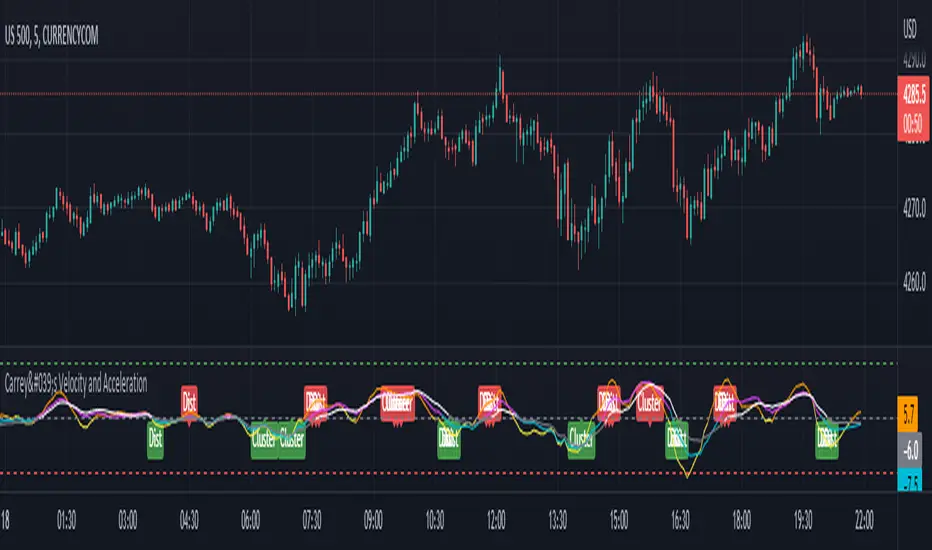
Carrey's Velocity and AccelerationThis is initially based on the MA Speed indicator from TradeStation () and expanded upon greatly. This implements 3 different variable MAs and calculates and plots both speed and acceleration of each. Also, a single line composite option is included for both speed and acceleration that changes color based on directional confluence of each MA's speed/acceleration. Additionally, optional labels are included to show where the 3 MAs are clustered, and a volatile move is expected, and where they are more distributed, expecting a temporary reversal.
The additional acceleration concept comes from kinematics in physics. Utilizing time-based derivatives, we can calculate the velocity and acceleration of the moving averages, which can help us identify momentum of price action and locate reversals sooner.
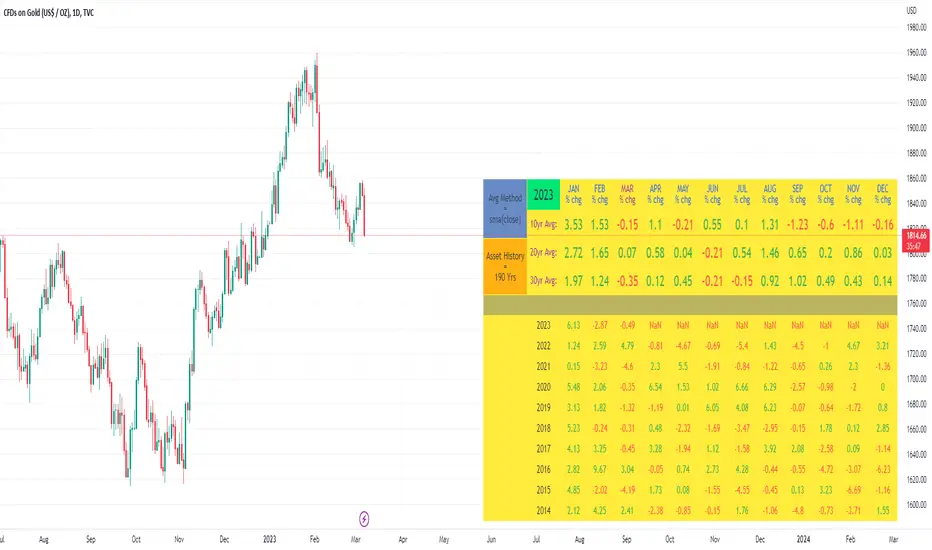
10yr, 20yr, 30yr Averages: Month/Month % Change; SeasonalityCalculates 10yr, 20yr and 30yr averages for month/month % change
~shows seasonal tendencies in assets (best in commodities). In above chart: August is a seasonally bullish month for Gold: All the averages agree. And January is the most seasonally bullish month.
~averages represent current month/previous month. i.e. Jan22 average % change represents whole of jan22 / whole of dec21
~designed for daily timeframe only: I found calling monthly data too buggy to work with, and I thought weekly basis may be less precise (though it would certainly reduce calculation time!)
~choose input year, and see the previous 10yrs of monthly % change readings, and previous 10yrs Average, 20yr Average, 30yr Average for the respective month. Labels table is always anchored to input year.
~user inputs: colors | label sizes | decimal places | source expression for averages | year | show/hide various sections
~multi-yr averges always print, i.e if only 10yrs history => 10yr Av = 20yr Av = 30yr Av. 'History Available' label helps here.
Based on my previously publised script: "Month/Month Percentage % Change, Historical; Seasonal Tendency"
Publishing this as seperate indicator because:
~significantly slower to load (around 13 seconds)
~non-premium users may not have the historical bars available to use 20yr or 30yr averages =>> prefer the lite/speedier version
~~tips~~
~after loading, touch the new right scale; then can drag the table as you like and seperate it from price chart
##Debugging/tweaking##
Comment-in the block at the end:
~test/verifify specific array elements elements.
~see the script calculation/load time
~~other ideas ~~
~could tweak the array.slice values in lines 313 - 355 to show the last 3 consecutive 10yr averages instead (i.e. change 0, 10 | 0,20 | 0, 30 to 0, 10 | 10, 20 | 20,30)
~add 40yr average by adding another block to each of the array functions, and tweaking the respective labels after line 313 (though this would likely add another 5 seconds to the load time)
~use alternative method for getting obtaining multi-year values from individual month elements. I used array.avg. You could try array.median, array.mode, array.variance, array.max, array.min (lines 313-355)
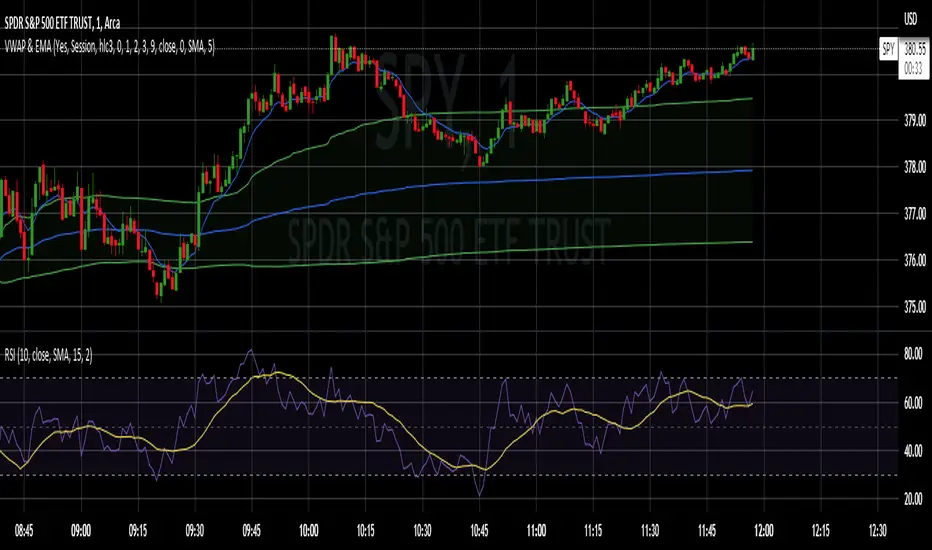
VWAP With EMA Overlay (Adjustable Anchor)For those who want the classic Volume Weighted Average Price and Ema on the same overlay.
This script utilizes the same protocols as the VWAP and EMA you currently use. Just frees up an indicator space.
KEEP UP TO DATE
Are you a college student or graduate?
Join College Town Trade discord for helpful community specializing in trading stocks, options, and crypto.
Our staff consists of a group of college students with 10+ years of combined experience. Collectively we have profited and made well above an average yearly salary while being in college. The community aspect is everything and the team always listens and appreciates feedback. We all earn and learn together. There are free trials in place in order for you to see what it’s all about. These are in place so we can gain your trust and show transparency!
I look forward to seeing you in the community
advBtBjDhk
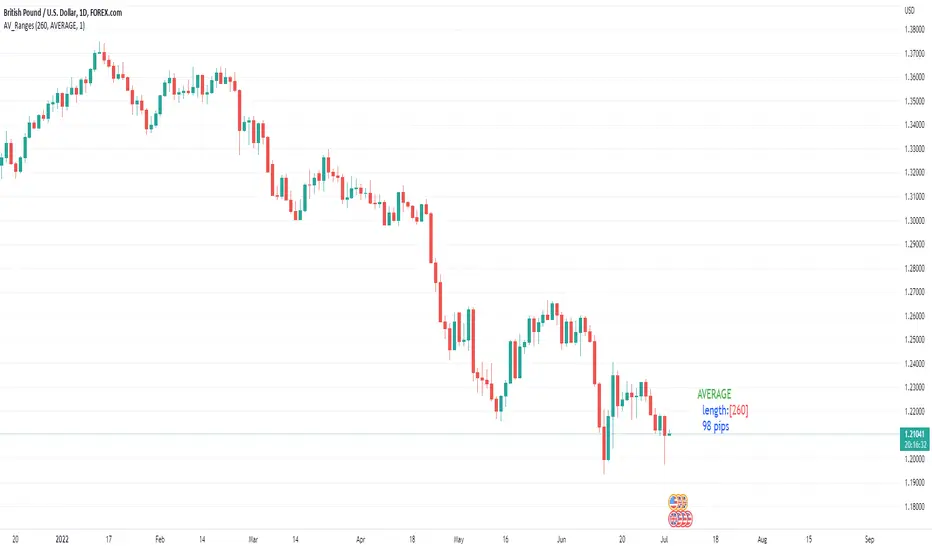
Average, Median, Mode, Biggest: Pip Range Measures & LabelsApply various simple statistical measures to series of full candle ranges over user input length (in bars).
Choose between AVERAGE, MEDIAN, MODE, BIGGEST.
All calculations derive from the high-low range of a candle.
Default length = 260, the number of daily candles in a year.
MODE is calculated from pip ranges rounded to reasonable increments (to nearest 10pips foreign currencies; to nearest 100 pips for DXY ; nearest $10 for other assets). Best only use MODE for the major FX pairs encoded, and on Daily timeframe .
User input 'unit multiplier' only applies when asset is NOT a major Forex pair (unit and multiplier is auto applied for for major FX pairs).
© twingall
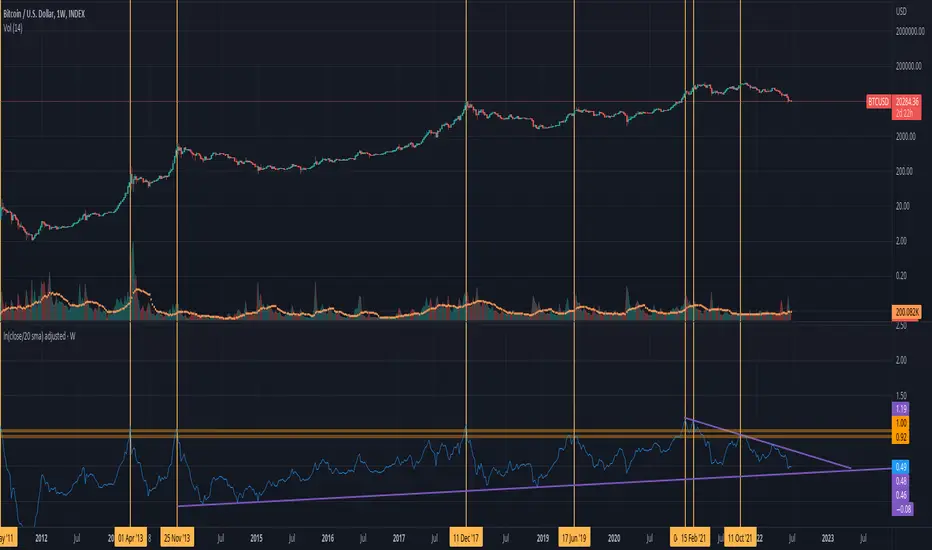
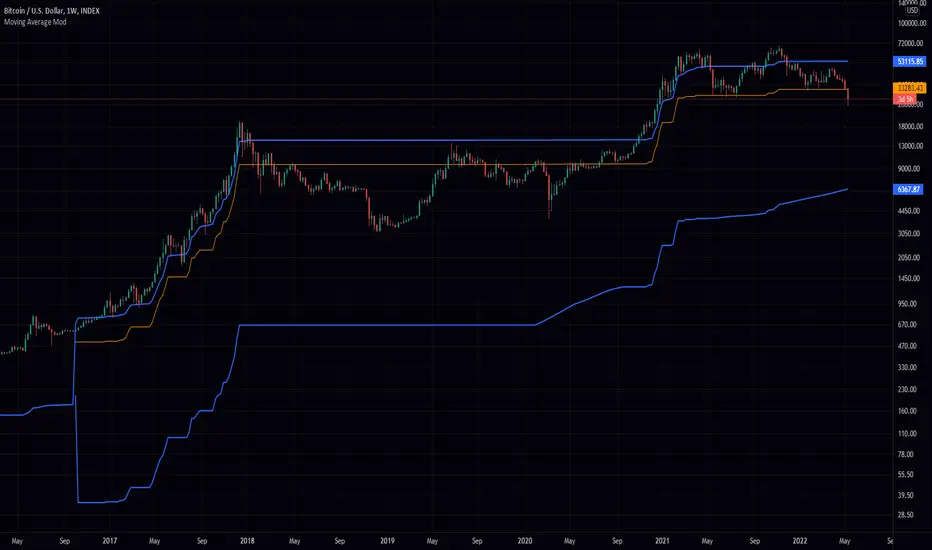
ln(close/20 sma) adjusted for time (BTC)(This indicator was designed for the BTC index chart)
Designed for Bitcoin. Plots the log of the close/20W SMA with a linear offset m*t, where m is the gradient I've chosen and t is the candle index. Anything above 1 is a mania phase/market cycle top. If it peaks around 0.92 and rolls over, it could be a local/market cycle top.
This will obviously not work at all in the long term as Bitcoin will not continue following the trend line on the log plot (you can even see it start to deviate in the Jan-Feb 2021 peaks where the indicator went to 1.15).
It identifies the 2011, 2013 (both of them), 2017 tops as being just above 1. It also identifies the 2019 local peak and 2021 market cycle top at ~0.94.
Feel free to change the gradient or even add a function to curve the straight line eventually. I made this for fun, feel free to use it as you wish.
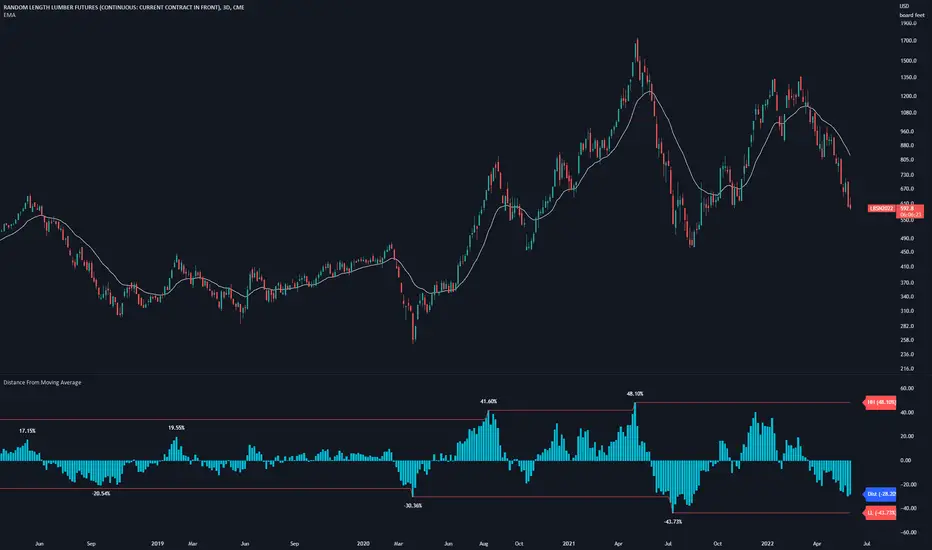
Distance From Moving AverageThis indicator shows the distance between the current price and the Moving Average price.
Key Features:
Show the distance between price and Moving Average (Read Distance Calculation for more information)
Show Historic Highs and Lows
Show Highest High and Lowest Low
Show current Highest High, current Lowest Low and current distance
Key Indicator Settings:
1. Distance Calculation
There are two ways to calculate the distance:
Spread - Calculate the difference between the price and the moving average
Percentage - Calculate the percentage change between the price and the moving average
2. Moving Average Types
There are 5 different Moving Averages:
EMA
SMA
WMA
VWMA
HMA
3. Highest High and Lowest Low
You can show or hide the Highest High and the Lowest Low plots of the series
4. Historic Highs and Lows
You can show or hide past Highs and Lows of the series
Lookback Length - Let's you adjust the frequency of local highs and lows of the series
5. Current Values
You can show or hide current value labels
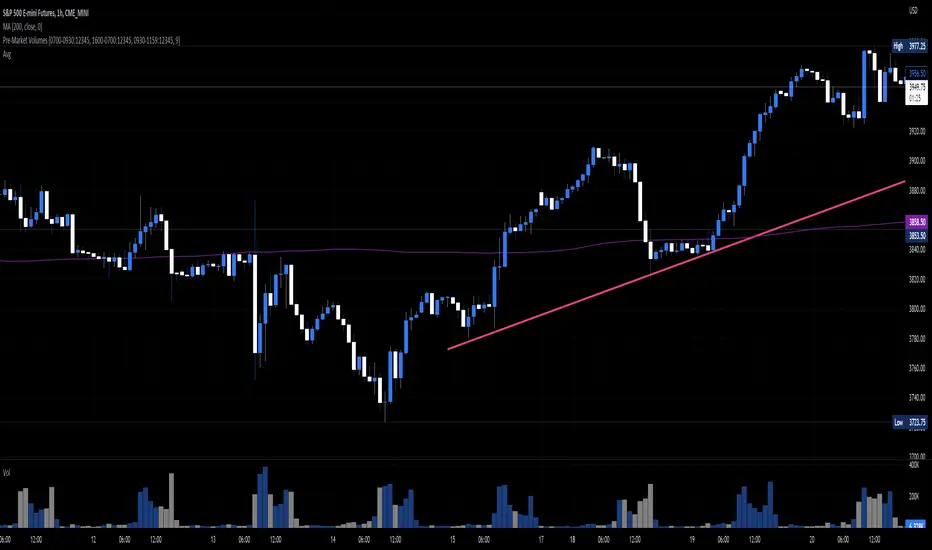
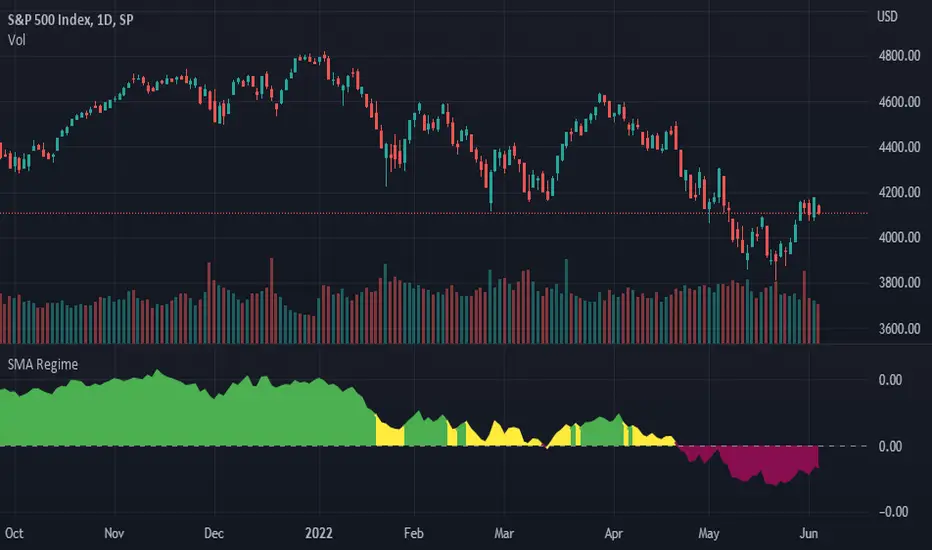
SMA RegimeProvides a color coded indicator based upon both the slope of a moving average of choice, and the asset's position in relation to that moving average. If the specified moving average is downward sloping and the asset closes below the moving average the indicator will be red. If the specified moving average is upward sloping and the asset closes above the moving average the indicator will be green. Any other combination of these two factors will color the indicator yellow indicating indecision.
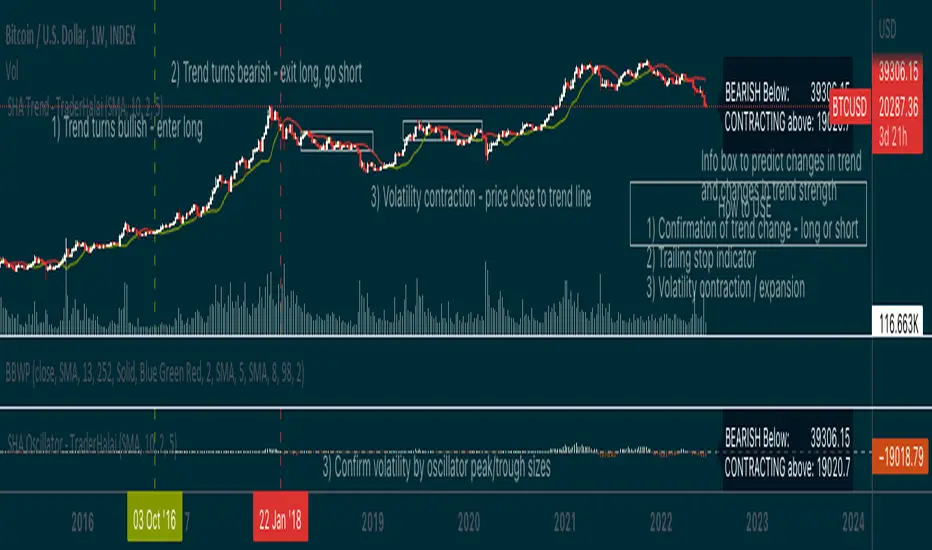
Smoothed Heikin Ashi Trend on Chart - TraderHalaiThis indicator is a predictive tool using Heikinashi to calculate shifts in trade direction.
It works by reverse-engineering the regular candle stick closing price required, to flip the Heiken Ashi candle from Red to Green and vice-versa.
Below, is an earlier indicator that I released and created. This plots this price as an oscillator, which allows traders to get a predictive indicator of a trend change.
This indicator extends upon this functionality by adding a smoothing function to the reverse-engineered regular candle stick closing price, to reduce the choppiness of signals. It also plots the indicator on the chart to allow for easier visual confirmation.
How to use
1) As a directional bias - Bullish or bearish
2) Volatility expansion/contraction - further distance from line means volatility expansion - am planning to release an oscillator version also
3) Trailing stop loss - once you are in a trade
Other Features
Select a moving average period and smoothing calculation method (e.g. SMA / EMA)
Non-repaint mode for backtesting and use/integration with higher timeframes
Final note - Open Source
I am releasing this as open-source for the benefit of the community and to allow further development, scrutiny and criticism. Please feel free to use this indicator as you see fit. If you do use this indicator to create another script, feel free to drop me a note, as I would be highly interested in your idea.
Thanks, and Enjoy!
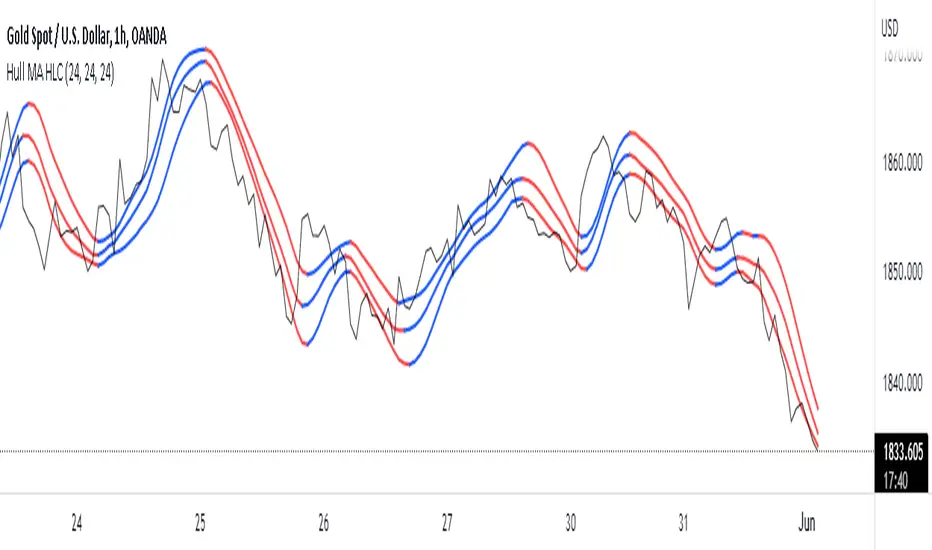
Hull MA HLCThis Indicator calculates and plots 3 Hull Moving Averages with the same period based on the High, Low & Close price.
The color of plot changes to indicate positive or negative slope.
Original Hull MA code written by mohamed982 | Original Triple Hull MA code written by CMKirkham
This triple Hull MA HLC (High Low Close) Pine v5 code written by MaxDecimus 2022
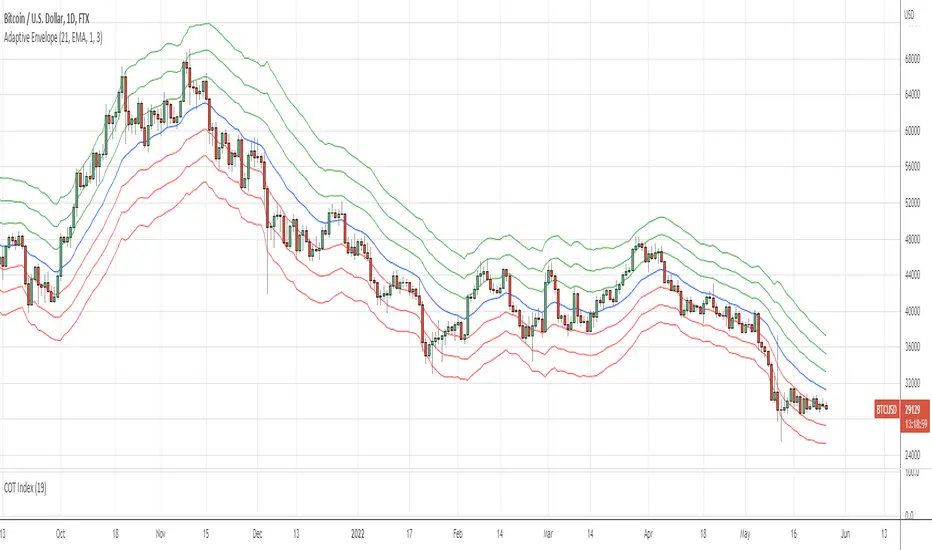
Adaptive EnvelopeI bring to your attention a dynamic indicator Adaptive Envelope .
The main qualitative characteristic of the technical indicator is adaptability. This means that it does not need to be adjusted for each tool. The adaptive envelope itself dynamically adjusts to the volatility of each individual instrument, or even timeframe.
And thanks to a wide range of settings, the indicator can be adjusted to your needs. Let's consider an example of the use of the indicator in trading.
Option #1. The envelope shows the "stretch" of the market - that is, the price of the asset beyond normal volatility. And it is at such moments that the probability of returning to the average is highest. That is, for such a signal, we wait for the exit to the moving average, and when returning with a stop order, we enter the averaging direction.
Option #2. Another option for trading is to buy at the lower level, as well as additional purchases along the lines of the envelope. Exit - on the middle line of the envelope (for shorts on the contrary) - so we have a full adaptability of the strategy. I repeat that due to adaptability, there will be no need to reconfigure when changing market characteristics.
Thank you for attention. Sincerely, Oleksandr Yanchak. Capitalizator.UA
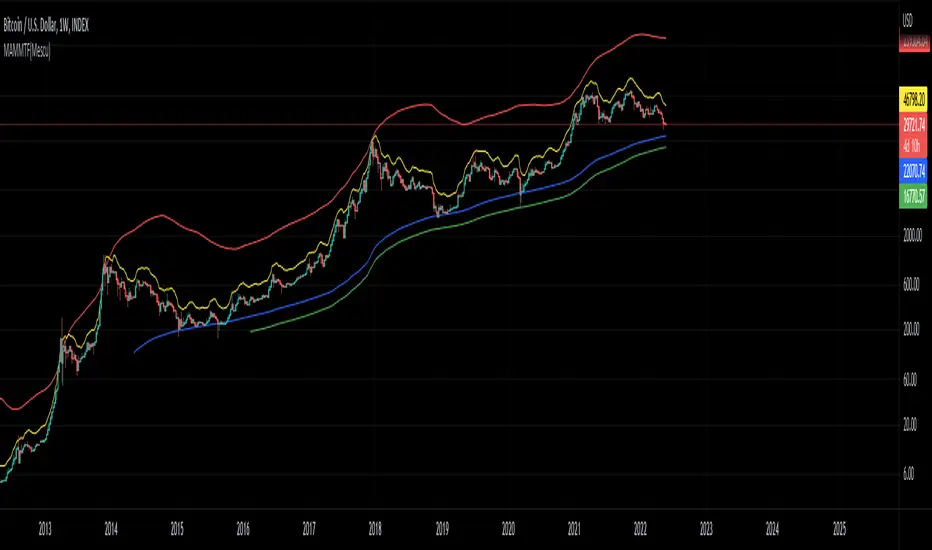
Moving Average Multipliers MTF (Mescu)Includes 4 customizable Moving Average with multipliers and multi-timeframe (MTF).
Tweaks the parameters to your liking, it should be pretty simple to understand
Used here with BTC/USD (1W) to identify good sell and buy zone for Bitcoin.
Got the idea from the 2-year MA Multiplier indicator, but didn't find something of my liking on TradingView, so I made my own.
Drop me a comment if you have any questions, suggestions, improvements.
Mescu
tradingview.sweetlogin.com
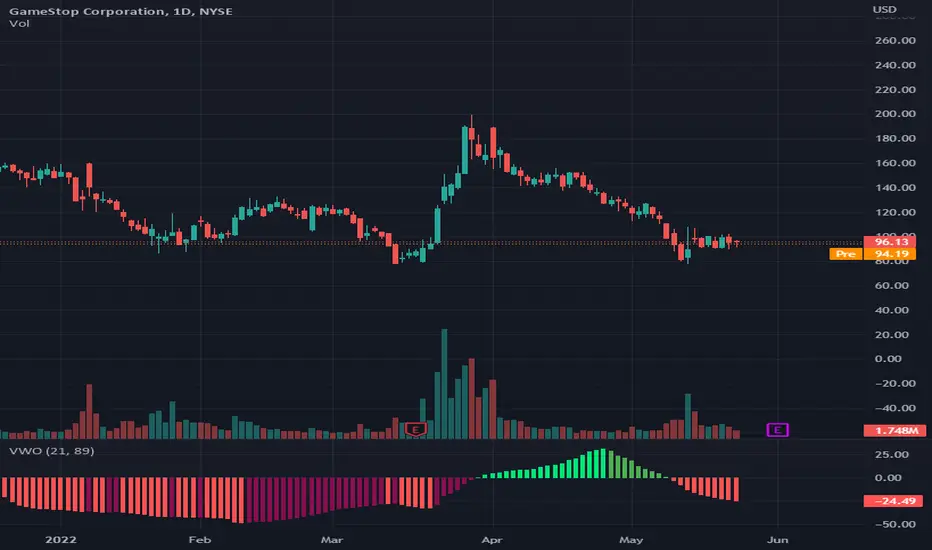
VWAP OscilatorVWAP Oscillator - Awesome Oscillator but using different period Volume Weighted Average Price values instead of moving averages. Used to get an idea of the momentum of price movements and when momentum might be reversing.
Risk Management & Position Size DashboardRisk Management and Position Size Calculator
This indicator is designed to assist traders by instantly providing the necessary information to execute orders based on defined risk parameters. This is not an indicator that tells you WHEN to buy or sell, but HOW MUCH to buy or sell based on your risk appetite. The indicator is compatible with any strategy and any instrument
The indicator uses some great pinescript features, allowing you to drag and drop your levels directly on the chart for instant feedback from the risk management dashboard. Huge timesaver.
Instructions:
1. The first time you add the indicator to your chart, you will be asked to identify your Entry, Stop and Target levels by clicking on them directly on the chart. You can at any point adjust these levels directly on the chart, or you can manually enter them in settings
2. Setup your risk profile in the indicator settings:
(a) Current Capital: Enter the current value of your trading account
(b) Max Risk Per Trade: Enter the maximum % of your Capital you want to risk per trade
(c) Max Leverage: Enter the maximum leverage you want applied to your account. This comes in handy when you trade on very low timeframes where position sizes can become very large. No matter what you enter here, position size will never exceed Max Risk Per Trade
(d) Stop Ticks: Number of ticks to use above/below the identified high/low for stops
(e) Use Current Price as Entry (Market Orders): By default, the system will use the entry level you have selected for limit orders. If you want to use the system to display data based on current price for market orders, select “Use Current Price as Entry (Market Orders)”
3. Based on your stop and target levels, the system will automatically display the dashboard for Longs (bottom of screen) or Shorts (top of screen). The levels will also be displayed to the right of the current price bar
4. Display Free Trade Level: toggle this on to display the level you should exit 50% of your position to make the trade risk free
5. Dashboard / Text size and level colours and positions are customisable
The Dashboard displays the following information at all times:
1. Entry
2. Stop
3. Trade Risk (%): Percentage price difference between Entry and Stop
4. Max Risk ($): Currency value of loss if the trade is stopped out
5. Size: Position Size to execute your trade based on your risk profile/appetite
6. Size($): Position Size in currency value
7. P&L($): Potential profit to your Capital in currency value
8. P&L(%): Potential profit to your Capital in %
9. R:R: Risk to Reward Ratio
10. % to Target: Percent price needs to move to achieve your target
Hope this helps you with your trading. I built this as I was tired of wasting time opening up spreadsheets or calculators to execute trades - especially on lower timeframes. Making the code open source so if you do make improvements to this I'd love to hear from you. Also open to suggestions.
Happy Trading!
Greedy MA & Greedy Bollinger Bands This moving average takes all of the moving averages between 1 and 700 and takes the average of them all. It also takes the min/max average (donchian) of every one of those averages. Also included is Bollinger Bands calculated in the same way. One nice feature I have added is the option to use geometric calculations for. I also added regular bb calculations because this can be a major hog. Use this default setting on 1d or 1w. Enjoy!
ps, I call it greedy because the default settings wont work on lower time frames
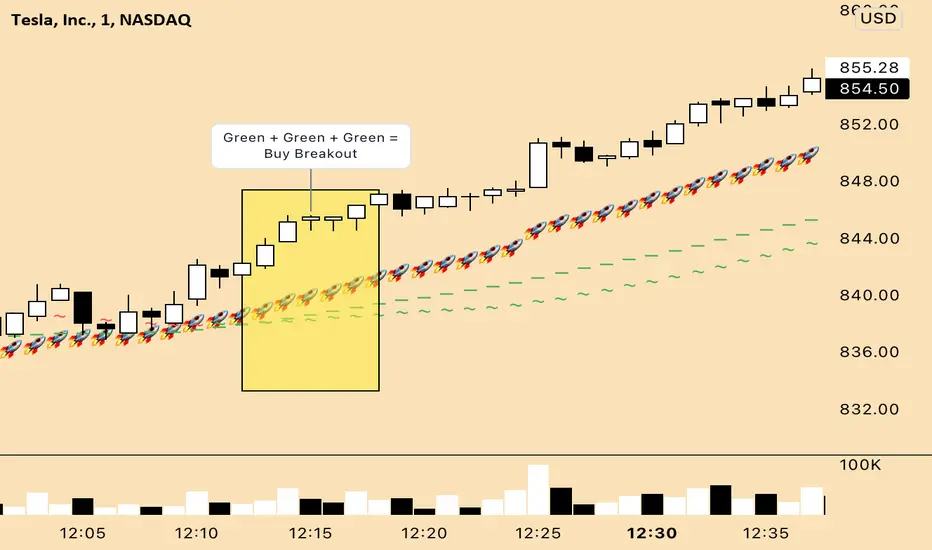
Dashed Line Moving AveragesHere's a simple script which i concocted using ideas from various authors with the goal of creating a slightly better Moving Average dashed line script imo...I think i managed to do just that and a bit more.. =)
Features:
- Contains one of each VWMA SMA EMA. You can set the input length.
- Ability to set spacing between characters of the plotted moving average line
- Horizontal offset of the moving average lines (just in case)
- Can add any fancy characters that suits your taste e.g ( . , _ , -, !, *, rocket, lava, etc) to the moving average
- If you duplicate the script and modify the "Size" parameter of the plotchar() function's variables with the choices provided in the commented-out code; you can have some fun!
This script is for entertainment & educational purposes only.
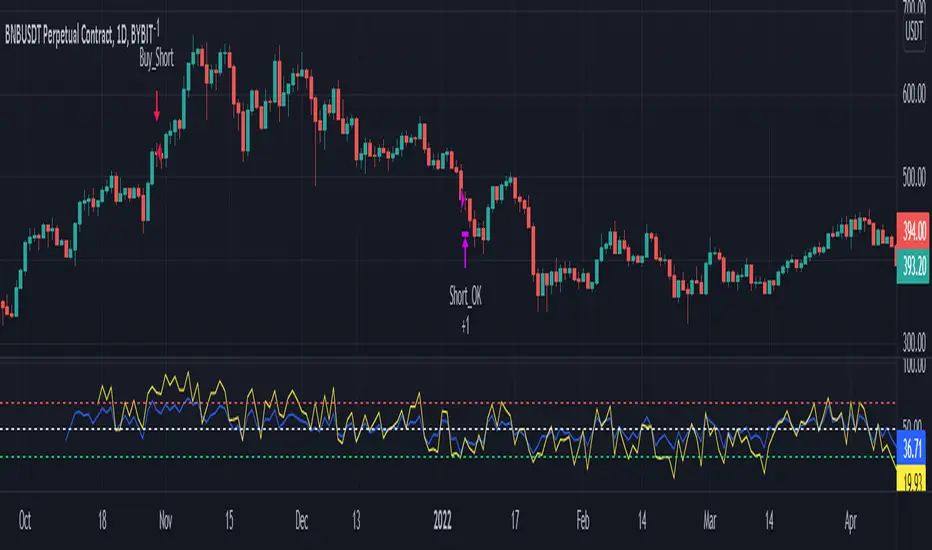
MTF RSI & STOCH Strategy by kziThis script is a teaml job with Indicator-Johns.
First he used my script, then i transform his code.
The origine:
The first transformation:
tradingview.sweetlogin.com
Funny moment together, thanks for that. :)
This sharing is an indicator where you can see the average of different time frames.
The RSI is the blue line
The Stock is the yellow line
You can manage the timeframe in the parameters.
The strategy is to take position when the two lines get overbought or oversold and close when the stoch and RSI goes to the middle.
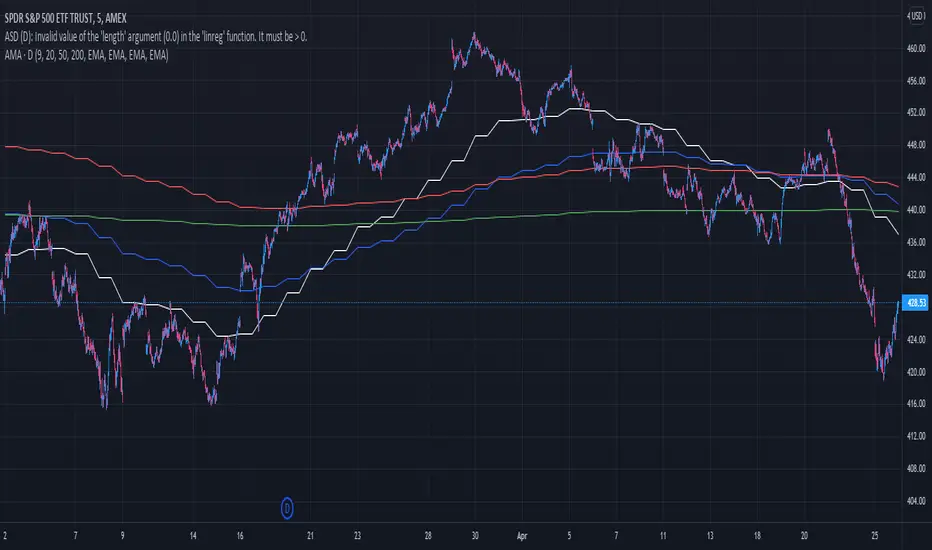
Aggregated Moving AveragesUsers can display moving averages from higher time frame charts and display them on their current chart. This script supports up to 4 moving averages aggregated from a selected time frame. Each plot can be toggled if the user does not wish to have all 4 plots displayed.
Inputs allow user to edit:
Moving average length
Average type
Color
Timeframe input allows user to select which timeframe the moving averages are calculated from.
If you wish to have multiple timeframes across different moving averages, it is recommended you add a separate copies of the indicator for each timeframe you wish to display. Toggle visibility of which plots which you don't need.
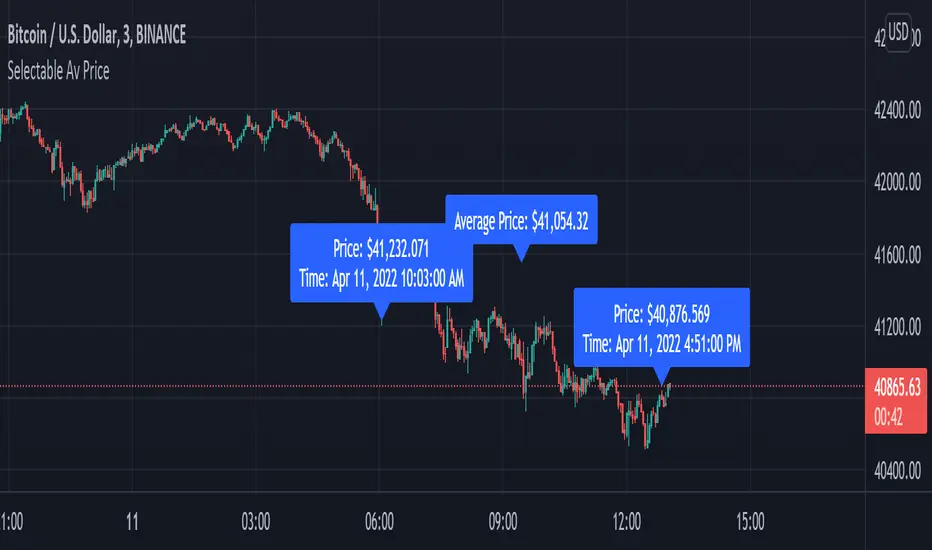
Average Price between Two PointsScript calculates & displays the average price of two selected points. Request from @Bosstradamus3 on Twitter.
This is a quick & dirty script that should be updated in the future.
If you use it and/or modify it, I'd love to hear about it.
Once the indicator is selected, click & drag the label base to reset starting & ending points.
To display label on top of bars, right click on it & select "Visual Order" → "Move to Front."
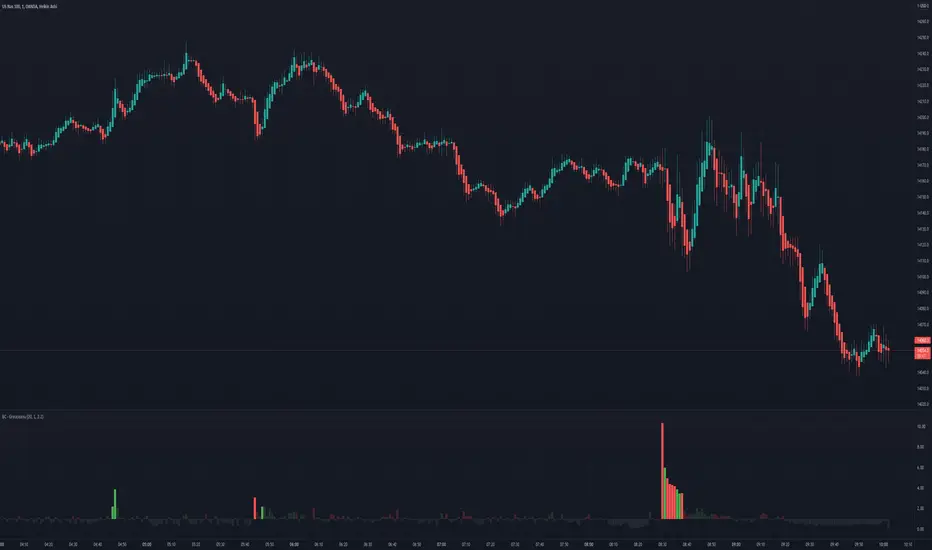
Bogdan Ciocoiu - GreuceanuDescription
This indicator is an entry-level script that simplifies volume interpretation for beginning traders.
It is a handy tool that removes all the noise and focuses traders on identifying potential smart money injections.
Uniqueness
This indicator is unique because it introduces the principle of a moving average in the context of volume and then compares it with tick-based volume.
Its uniqueness is reflected in the ability to colour code each volume bar based on the intensity of each relevant (volume) unit whilst comparing it with the volume moving average.
Another benefit of this indicator is the colour coding scheme that removes volume below a particular threshold (default set to 1) under the volume moving average.
In addition to the above features, the indicator differentiates the colour of each bar by price direction.
Open source re-use
To achieve this functionality several open source indicators have been used an integrated within the current one.
Bitcoin Risk Long Term indicatorOBJECTIVE:
The purpose of this indicator is to synthesize via an average several indicators from a wide choice with in order to simplify the reading of the bitcoin price and that on a long term vision.
Useful for those who want to see things simply, typically to make a smart DCA based on risk.
I originally used this script as a sandbox to understand and test the usefulness of several indicators, and to develop my PineScript skills, but finally the Risk Indicator output seems relevant so I decided to share it.
USAGE:
The selected indicators are the ones that I think give the best market bottoms, but the idea here is that anyone can try and use any set of indicators based on those preferences (post in comments if you find a relevant config)
Most of the indicator inputs are configurable. And some are not taken into account in the calculation of the Risk indicator because I consider them not relevant, this script is also a test more than a final version.
NOTES :
If you have any idea of adding an indicator, modification, criticism, bug found: share them, it is appreciated!
In the future I will create another more versatile Risk indicator that will not be focused on bitcoin in weekly. (this indicator is still usable on other assets and timeframe)
THANKS:
to Benjamin Cowen for inspiring me with his Bitcoin Risk metric
to Lazybear for his Wavetrend Indicator and all the scripts he shares
to Mabonyi for his Bitcoin Logarithmic Growth Curves & Zones script
to VuManChu for his VMC Cypher B Divergence
to the Trading view team for developing TV and PineScript
And to all the community for all the published codes that allowed me to progress and create this script
---- FR ----
OBJECTIF :
L'objectif de cet indicateur est de synthétiser via une moyenne plusieurs indicateurs parmi un large choix avec afin de simplifier la lecture du cours de bitcoin et cela sur une vision longue terme.
Utile pour ceux qui veulent voir les choses simplement, typiquement faire un DCA intelligent en fonction du risque.
À la base j'ai utilisé ce script comme un bac à sable pour comprendre puis tester l'utilité de plusieurs indicateurs, et développer mes compétences PineScript, mais finalement l'output Risk Indicateur me semble pertinent donc autant le partager.
UTILISATION :
Les indicateurs sélectionnés sont ceux qui permettent selon moi d'avoir les meilleurs point bas de marché, mais l'idée ici est que chacun puisse essayer et utiliser n'importe quel ensemble d'indicateur en fonction de ces préférences (poster en commentaire si vous trouvez une configuration pertinente)
La plupart des inputs indicateurs sont paramétrables. Et certains ne sont pas pris en compte dans le calcul du Risk indicateur car je les estime non pertinent, ce script est aussi un essai plus qu'une version finale.
NOTES :
Si vous avez la moindre idée d'ajout d'indicateur, modification, critique, bug trouvé : partagez-les, c'est apprécié !
à l'avenir je créerais un autre Risk indicator plus polyvalent qui ne sera pas focalisé sur bitcoin en weekly. (cet indicateur est tout de même utilisable sur d'autre actif et timeframe)
REMERCIEMENT :
à Benjamin Cowen pour m'avoir inspiré avec son Bitcoin Risk metric
à Lazybear pour son Wavetrend Indicator et globalement tout les scripts qu'il partage
à Mabonyi pour son script Bitcoin Logarithmic Growth Curves & Zones
à VuManChu pour son VMC Cypher B Divergence
à l'équipe Trading view pour avoir développé TV et PineScript
Et à toute la communauté pour tous les codes publiés qui m'ont permis de progresser et de créer ce script

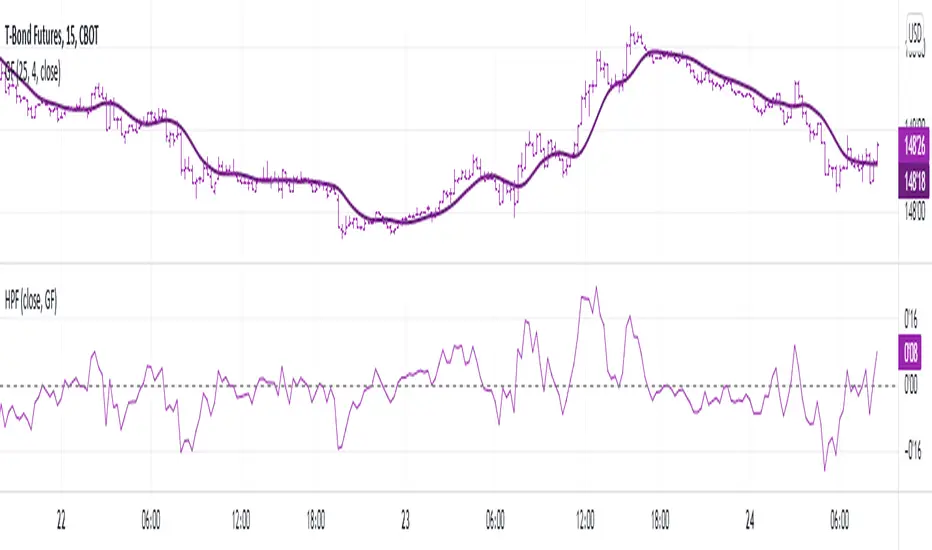
High-pass filterHigh-pass filter | Pine Utilities series, ready to be used in "study-on-study" fashion |
Represents the difference between the filter and the original unfiltered data.
How to use:
1) Add a filter to your chart (in this particular case it was 4-pole Gaussian filter implemented by @everget, ty man);
2) Tap ... on your's filter status line and choose "Add study/strategy on ...", then choose High-pass filter. Alternatively, add high-pass filter directly to your chart, then High-pass filter's settings -> Basis -> choose the filter you've applied during the step 1;
3) Choose the source (op2 and hlcc4 are available as well);
4) See the difference (literally).
Peace TV
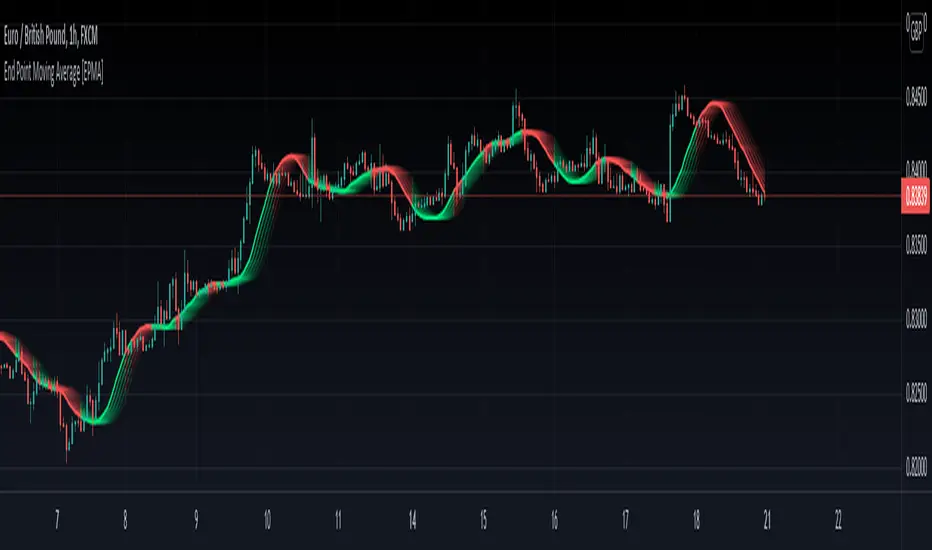
End Point Moving Average [EPMA]The End Point Moving Average was introduced in the October 95 issue of Technical Analysis of Stocks &
Commodities in the article "The End Point Moving Average", by Patrick E. Lafferty.
The Time Series Forecast takes this value and the slope of the regression line to forecast the next day and then plots this forecasted price as today's value.
For interpretation refer to Mr. Lafferty's article.
Please note
From line 10 starts my personal experemental modifications to this script, all above is original formula by Patrick E. Lafferty.