PSAR LRC [CRT Trader]
SAR (Stop and Reverse) is a technical indicator used in financial markets to track trends and identify potential reversal points.
The indicator plots SAR calculations at three different speeds as dot markers above or below the candlesticks. If all three dots are below, it is considered a bullish signal; if they are above, it is considered a bearish signal.
In addition to the indicator, a Linear Regression Channel has been added. These lines can provide information such as trend direction, support, resistance, and potential breakouts.
Bands and Channels

Auto Channel [SciQua]Auto Channel
Purpose
Auto Channel finds the single best parallel price channel from recent price action and keeps it updated in real time. It uses ZigZag pivots to build candidate channels, scores each candidate for quality, then plots the winner. When price closes outside the channel, the script flags a breakout and can fire alerts.
How it works
1. ZigZag pivots
The script uses TradingView’s TradingView/ZigZag/7 library to generate a stream of swing highs and lows based on a percentage reversal threshold and a leg depth. These pivots are the only points the channel logic evaluates, which keeps the search fast and focused on structure rather than noise.
2. Channel candidates
From the most recent pivots, the script forms all combinations of two swing highs and two swing lows.
It computes a slope for the high line and a slope for the low line and requires that they be nearly parallel within a user-defined tolerance.
3. Quality scoring and selection
For every valid candidate, the script checks the recent pivot segments against the trial channel and computes:
Inside ratio: fraction of tested pivots that sit fully inside the channel after applying the tolerance buffer.
Violation sum: total magnitude of the breaches for any pivots outside the channel.
Current width: distance between upper and lower lines at the current bar.
The “best” channel is chosen by:
1. highest inside ratio
2. then widest current width
3. then smallest violation sum
4. Plot and projection
The upper and lower lines are anchored to the chosen pivot pairs and extend to the left. The script also projects each line to the current bar to compute the live upper and lower channel prices. Those levels drive the breakout checks and alerts.
5. Breakouts and alerts
A breakout is detected when the bar closes above the projected upper line or closes below the projected lower line, after applying the tolerance buffer. Triangle markers highlight fresh breakouts, and you can enable alert conditions to automate notification or strategy handoff.
Inputs:
ZigZag
Price deviation for reversals (%)
Default 0.2. Larger values produce fewer, larger swings. Smaller values produce more, smaller swings.
Pivot legs
Default 2. Controls the lookback depth ZigZag uses to confirm pivots.
ZigZag Color
Visual only.
Tip: If you are not seeing a stable channel, increase the ZigZag percentage to reduce minor swings.
Channel search
Number of recent pivots to consider
Default 12. Higher values search more history and try more channel combinations. Lower values make the search faster and more reactive.
Max slope difference for parallel
Default 0.0005. Maximum allowed difference between the upper and lower line slopes. Smaller values enforce stricter parallelism.
Max price tolerance outside channel
Default 0.0. A buffer added to the channel boundaries during validation and breakout checks. Use this to ignore tiny wicks that poke the lines.
Minimum inside to outside pivots ratio for valid channel (0.00–1.00)
Default 1.00. Require that at least this fraction of checked pivots lie inside the channel. For a more permissive fit, try 0.60 to 0.85.
Styling
Upper Line Color
Lower Line Color
Breakout Above Color
Breakout Below Color
Plots and visuals
Upper channel line
Lower channel line
Triangle markers on the bar that first confirms a close outside the channel, above or below.
Lines extend left from their pivot anchors. Projection to the current bar is used internally to test for breakouts and to set alerts.
Alerts
The script defines two alert conditions:
Close Above Channel
Triggers when the bar closes above the projected upper line plus tolerance.
Close Below Channel
Triggers when the bar closes below the projected lower line minus tolerance.
Practical usage
Trend channels
In a steady trend, a high inside ratio with a moderate width often highlights the dominant channel. Consider trend entries near the lower line in an uptrend or near the upper line in a downtrend, with exits or stops beyond the opposite boundary.
Breakout trades
Combine the channel breakout alert with volume or a separate momentum filter. The tolerance input helps avoid false triggers from small wicks.
Tuning for timeframe and symbol
• Faster markets or lower timeframes usually benefit from a larger ZigZag percentage and a smaller pivot count.
• Slower markets or higher timeframes can use more pivots and a tighter slope difference to enforce cleaner geometry.
Notes and limitations
Channels are derived from ZigZag pivots. If your ZigZag settings change, the detected channel will also change.
The script plots only the single best channel at any time to keep the chart clean.
Breakout markers appear on confirmed bars. For historical bars, markers appear only where a breakout would have been confirmed at that time.
Lines extend left from their anchors. The script projects the lines internally to the current bar for checks and alerts.
License and attribution
License
Creative Commons Attribution-NonCommercial 4.0 International (CC BY-NC 4.0).
Open source for educational and personal use only. Commercial use requires written permission.
Attribution
© 2025 SciQua — Joshua Danford
Libraries
Uses TradingView/ZigZag/7.
Changelog
v1.0
Initial release. Automatic parallel channel detection from ZigZag pivots, quality scoring, live plotting, and close-based breakout alerts.
FAQ
Why do I not see any channel sometimes?
There may not be a valid pair of highs and lows that pass the slope, inside ratio, and tolerance checks. Loosen the constraints by increasing Max slope difference, lowering Minimum inside ratio, or increasing the ZigZag percentage.
The channel looks too narrow or too wide?
Adjust Number of recent pivots and Minimum inside ratio. A higher inside ratio tends to favor cleaner, sometimes wider channels. A lower ratio may admit narrower, more reactive channels.
How can I reduce false breakout alerts?
Increase Max price tolerance outside channel to ignore small wicks. Add a volume or momentum confirmation in your personal alert workflow.
Thank you for using Auto Channel . Feedback and improvements are welcome.

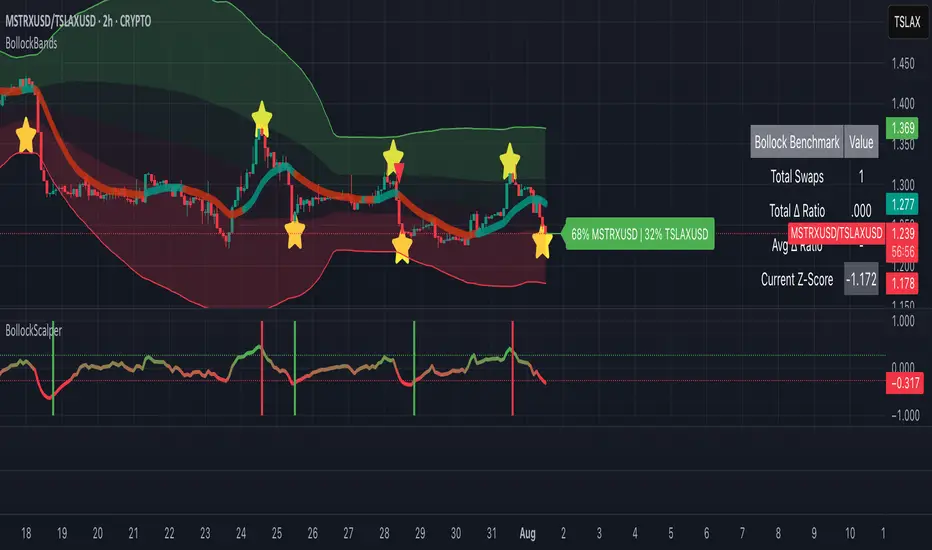
Bollock ScalperRSI/MACD/EMA composite score scalping indicator designed for the 30m chart for pairs like MSTR/TSLA. Intended to be used in conjunction with bollinger band / trend indicators like Bollock Bands.
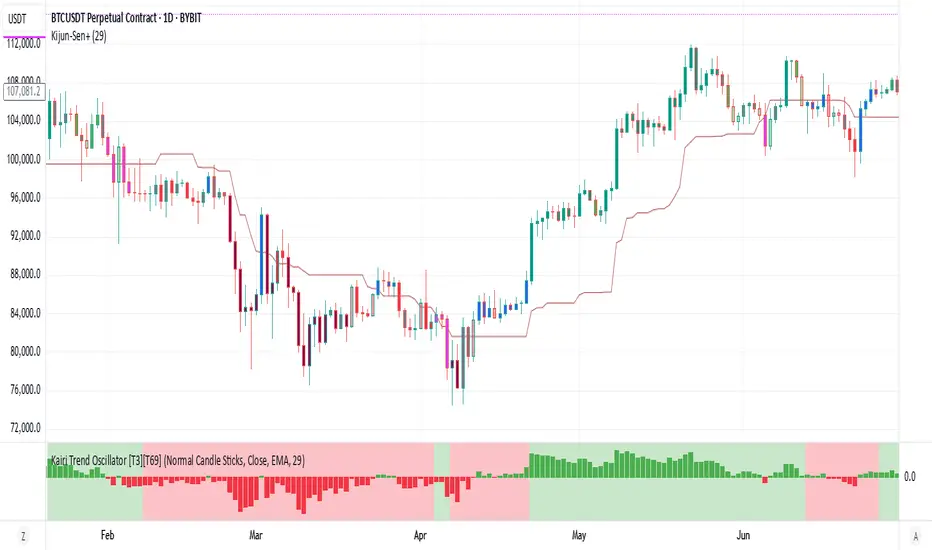
Kairi Trend Oscillator [T3][T69]📌 Overview
The Kairi Trend Oscillator is a Japanese-inspired hybrid oscillator combining Heikin-Ashi trend clarity with the Kairi (乖離率) indicator — a measure of price deviation from a moving average. This dual-layer system gives you both trend direction and trend strength/health, designed to highlight trend maturity and avoid overextended entries.
✨ Features
Heikin-Ashi or normal candlestick input modes
Multiple moving average options: SMA, EMA, DEMA, VWMA, and Kijun
Visual color-coded trend zones: overbought, oversold, healthy, weak, and reversal conditions
Full Kairi column plot with dynamic coloring
Adaptive logic for trend detection (linear regression or Heikin-Ashi structure)
Built-in reversal detection based on divergence between Kairi and trend direction
⚙️ How to Use
Choose Candle Type: Select Heiken Ashi or Normal Candlesticks via the Candle Mode dropdown.
Select Source: Choose open, high, low, or close as the input for Kairi computation.
Set MA Type & Length: Configure the moving average mode and its length under Moving Average Settings.
Interpret the Plot:
Green/Red bars: Show Kairi oscillator values above/below 0
Background color: Shows current trend (green = uptrend, red = downtrend)
Candle color overlays:
🟩 Teal = Overextended Bulls
🟥 Maroon = Overextended Bears
✅ Green = Healthy Uptrend
🔻 Red = Healthy Downtrend
🟨 Light tones = Weak trends
🔄 Blue/Fuchsia = Possible reversal detected
🔧 Configuration
Inputs:
Candle Mode: Heiken Ashi or Normal Candle Sticks
Source: Open, High, Low, Close
MA Mode: SMA, EMA, DEMA, VWMA, or Kijun
MA Length: Default is 29
🧪 Advanced Tips
Use Heikin-Ashi mode for better trend smoothing.
Kairi divergence (e.g., bullish Kairi in a downtrend) may signal upcoming reversal — watch for blue or fuchsia bars.
Combine with momentum indicators (e.g. RSI or MACD) for confluence-based setups.
For mean reversion strategies, fade extreme Kairi readings (> ±5%).
⚠️ Limitations
Not suited for ranging markets without trend.
Kairi extremes may remain elevated in strong trends — avoid early counter-trend entries.
Reversal logic is not a confirmation signal; use with caution.
📌 Disclaimer
This script is educational and illustrative. Always backtest thoroughly before using in live markets.
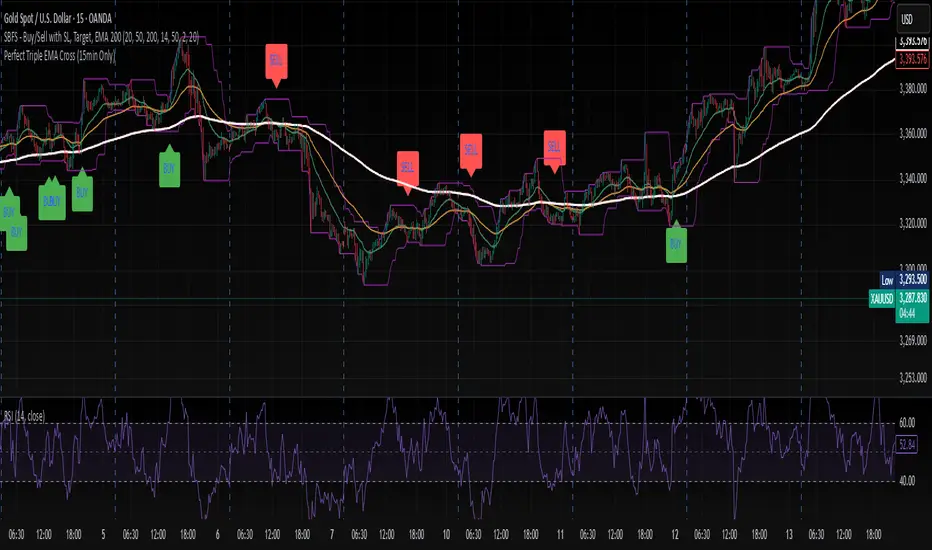
Perfect Triple EMA Cross (15min Only)//@version=5
indicator("Perfect Triple EMA Cross (15min Only)", overlay=true)
// ==== Inputs ====
ema20 = ta.ema(close, 20)
ema50 = ta.ema(close, 50)
ema200 = ta.ema(close, 200)
// ==== Timeframe Check ====
is15min = (timeframe.period == "15")
// ==== Conditions ====
buyCond = is15min and ta.crossover(ema20, ema50) and ema20 > ema50 and ema50 > ema200
sellCond = is15min and ta.crossunder(ema20, ema50) and ema20 < ema50 and ema50 < ema200
// ==== Plots ====
plot(ema20, title="EMA 20", color=color.orange, linewidth=1)
plot(ema50, title="EMA 50", color=color.blue, linewidth=1)
plot(ema200, title="EMA 200", color=color.red, linewidth=2)
plotshape(buyCond, title="BUY", location=location.belowbar, style=shape.labelup, color=color.green, size=size.normal, text="BUY")
plotshape(sellCond, title="SELL", location=location.abovebar, style=shape.labeldown, color=color.red, size=size.normal, text="SELL")
// ==== Alerts ====
alertcondition(buyCond, title="BUY Signal", message="Triple EMA BUY Signal (15min)")
alertcondition(sellCond, title="SELL Signal", message="Triple EMA SELL Signal (15min)")
Kaufman Efficiency Ratio (Directional)Kaufman Indicator with negative and positive, i use 30 and negative 30 as trend indicators, some can use it as counter trend...a lot of other kaufman efficiency indicators are only at the positive level so even a short trend has a positive 30 value can be confusing.

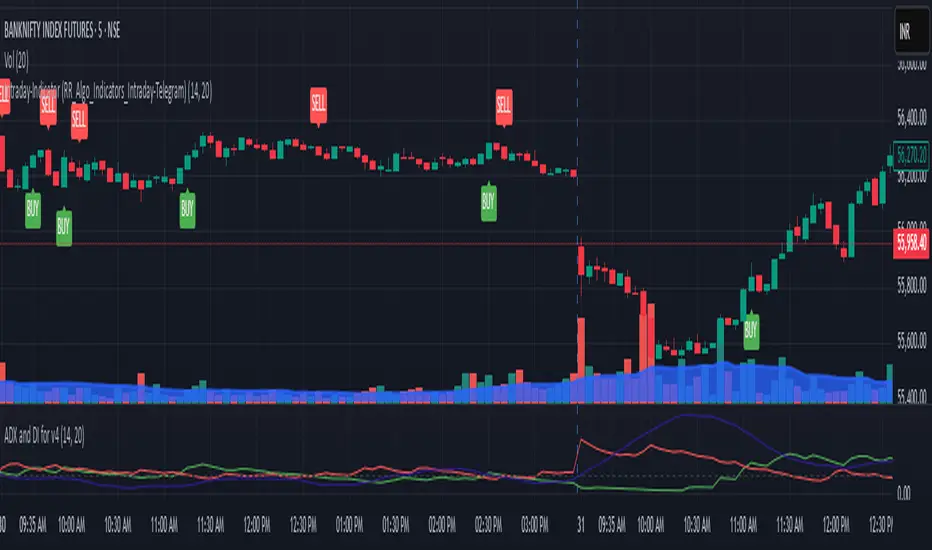
Buy/Sell Labels-RR_AlgoAI (Telegram-RR_Algo_Indicators_Intraday)This indicator uses the Trend Movement to identify shifts in market trend. When the positive movement crosses above the negative, it signals a potential bullish move and marks the chart with a "BUY" label along with a green trend line from the candle's low. Conversely, when Negative movement crosses above Positive Movement, it signals bearish potential, showing a "SELL" label and a red trend line from the candle's high. It also plots the smoothed difference between to show trend strength.
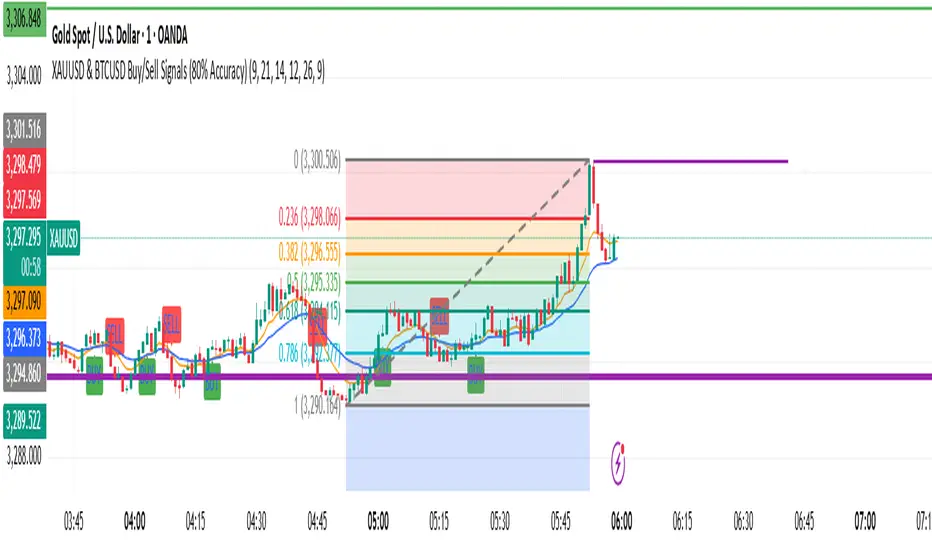
XAUUSD & BTCUSD Buy/Sell Signals (80% Accuracy)this script gives approx 80% real and correct indicators depending on market
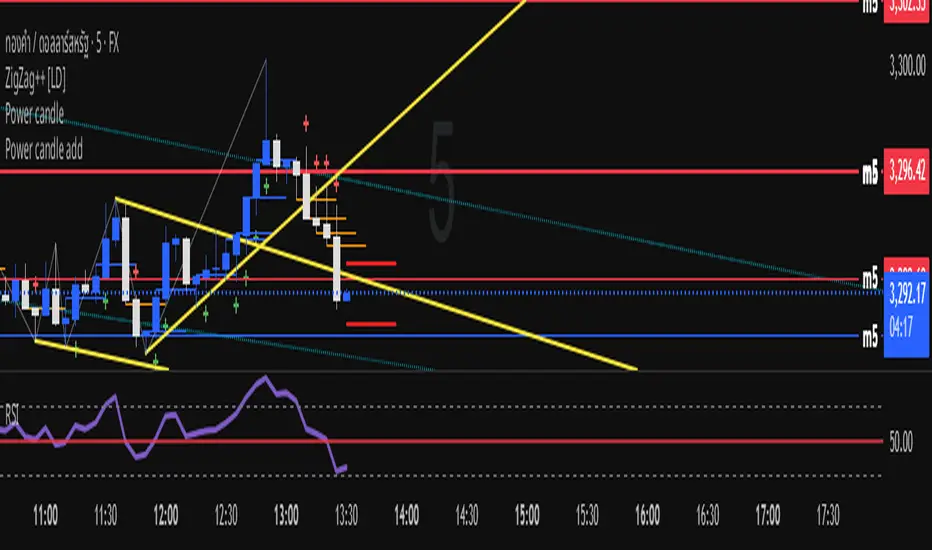
Power candle addPower candle add++++Power candle add++++Power candle add++++Power candle add++++Power candle add++++Power candle add++++Power candle add++++Power candle add++++Power candle add++++Power candle add++++Power candle add++++Power candle add++++Power candle add++++
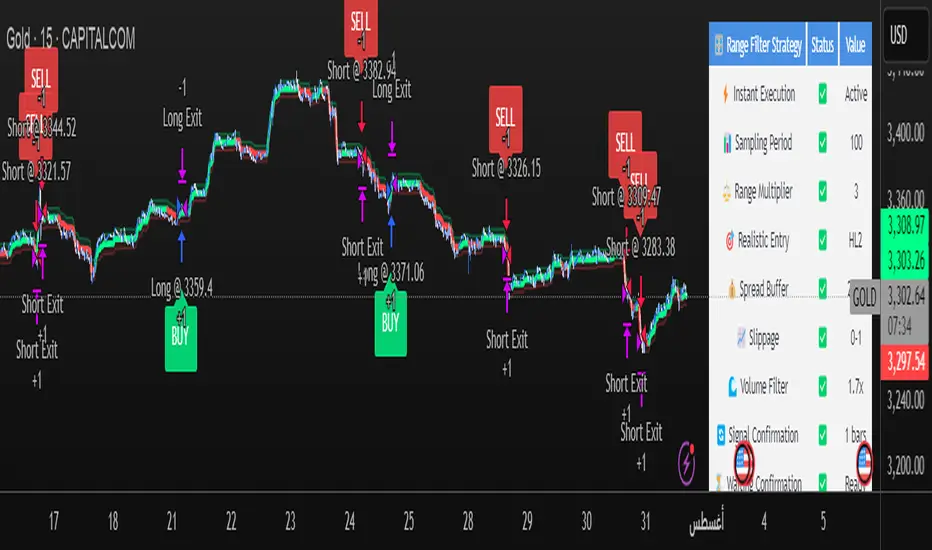
Range Filter Strategy [Real Backtest]Range Filter Strategy - Real Backtesting
# Overview
Advanced Range Filter strategy designed for realistic backtesting with precise execution timing and comprehensive risk management. Built specifically for cryptocurrency markets with customizable parameters for different assets and timeframes.
Core Algorithm
Range Filter Technology:
- Smooth Average Range calculation using dual EMA filtering
- Dynamic range-based price filtering to identify trend direction
- Anti-noise filtering system to reduce false signals
- Directional momentum tracking with upward/downward counters
Key Features
Real-Time Execution (No Delay)
- Process orders on tick: Immediate execution without waiting for bar close
- Bar magnifier integration for intrabar precision
- Calculate on every tick for maximum responsiveness
- Standard OHLC bypass for enhanced accuracy
Realistic Price Simulation
- HL2 entry pricing (High+Low)/2 for realistic fills
- Configurable spread buffer simulation
- Random slippage generation (0 to max slippage)
- Market liquidity validation before entry
Advanced Signal Filtering
- Volume-based filtering with customizable ratio
- Optional signal confirmation system (1-3 bars)
- Anti-repetition logic to prevent duplicate signals
- Daily trade limit controls
Risk Management
- Fixed Risk:Reward ratios with precise point calculation
- Automatic stop loss and take profit execution
- Position size management
- Maximum daily trades limitation
Alert System
- Real-time alerts synchronized with strategy execution
- Multiple alert types: Setup, Entry, Exit, Status
- Customizable message formatting with price/time inclusion
- TradingView alert panel integration
Default Parameters
Optimized for BTC 5-minute charts:
- Sampling Period: 100
- Range Multiplier: 3.0
- Risk: 50 points
- Reward: 100 points (1:2 R:R)
- Spread Buffer: 2.0 points
- Max Slippage: 1.0 points
Signal Logic
Long Entry Conditions:
- Price above Range Filter line
- Upward momentum confirmed
- Volume requirements met (if enabled)
- Confirmation period completed (if enabled)
- Daily trade limit not exceeded
Short Entry Conditions:
- Price below Range Filter line
- Downward momentum confirmed
- Volume requirements met (if enabled)
- Confirmation period completed (if enabled)
- Daily trade limit not exceeded
Visual Elements
- Range Filter line with directional coloring
- Upper and lower target bands
- Entry signal markers
- Risk/Reward ratio boxes
- Real-time settings dashboard
Customization Options
Market Adaptation:
- Adjust Sampling Period for different timeframes
- Modify Range Multiplier for various volatility levels
- Configure spread/slippage for different brokers
- Set appropriate R:R ratios for trading style
Filtering Controls:
- Enable/disable volume filtering
- Adjust confirmation requirements
- Set daily trade limits
- Customize alert preferences
Performance Features
- Realistic backtesting results aligned with live trading
- Elimination of look-ahead bias
- Proper order execution simulation
- Comprehensive trade statistics
Alert Configuration
Alert Types Available:
- Entry signals with complete trade information
- Setup alerts for early preparation
- Exit notifications for position management
- Filter direction changes for market context
Message Format:
Symbol - Action | Price: XX.XX | Stop: XX.XX | Target: XX.XX | Time: HH:MM
Usage Recommendations
Optimal Settings:
- Bitcoin/Major Crypto: Default parameters
- Forex: Reduce sampling period to 50-70, multiplier to 2.0-2.5
- Stocks: Reduce sampling period to 30-50, multiplier to 1.0-1.8
- Gold: Sampling period 60-80, multiplier 1.5-2.0
TradingView Configuration:
- Recalculate: "On every tick"
- Orders: "Use bar magnifier"
- Data: Real-time feed recommended
Risk Disclaimer
This strategy is designed for educational and analytical purposes. Past performance does not guarantee future results. Always test thoroughly on paper trading before live implementation. Consider market conditions, broker execution, and personal risk tolerance when using any automated trading system.
Best Settings Found for Gold 15-Minute Timeframe
After extensive testing and optimization, these are the most effective settings I've discovered for trading Gold (XAUUSD) on the 15-minute timeframe:
Core Filter Settings:
Sampling Period: 100
Range Multiplier: 3.0
Professional Execution Engine:
Realistic Entry: Enabled (HL2)
Spread Buffer: 2 points
Dynamic Slippage: Enabled with max 1 point
Volume Filter: Enabled at 1.7x ratio
Signal Confirmation: Enabled with 1 bar confirmation
Risk Management:
Stop Loss: 50 points
Take Profit: 100 points (2:1 Risk-Reward)
Max Trades Per Day: 5
These settings provide an excellent balance between signal accuracy and realistic market execution. The volume filter at 1.7x ensures we only trade during periods of sufficient market activity, while the 1-bar confirmation helps filter out false signals. The spread buffer and slippage settings account for real trading costs, making backtest results more realistic and achievable in live trading.
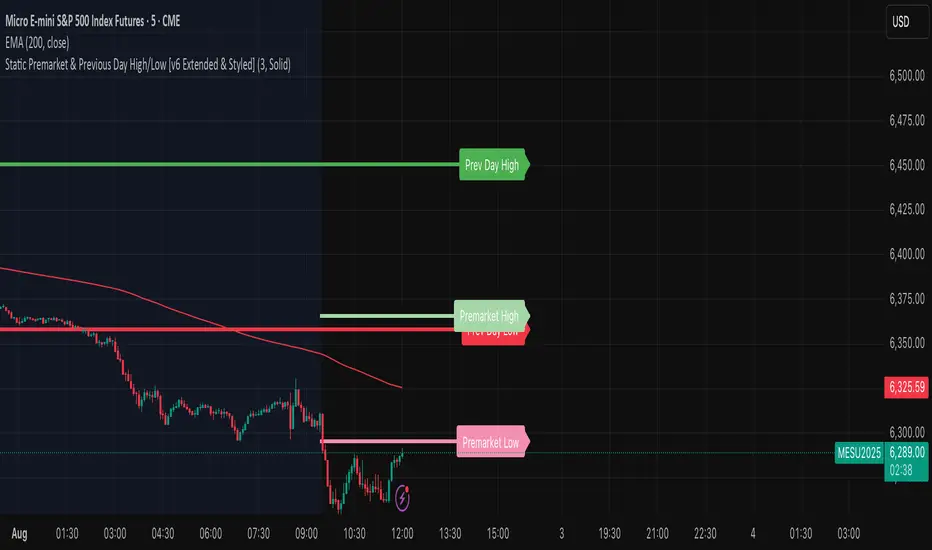
High/Low Premarket & Previous Day This scripts adds lines for previous day and premarket high/low with labels that you can toggle on and off. The lines extend through current premarket and trading session
BTC 1m Chop Top/Bottom Reversal (Stable Entries)Strategy Description: BTC 5m Chop Top/Bottom Reversal (Stable Entries)
This strategy is engineered to capture precise reversal points during Bitcoin’s choppy or sideways price action on the 5-minute timeframe. It identifies short-term tops and bottoms using a confluence of volatility bands, momentum indicators, and price structure, optimized for high-probability scalping and intraday reversals.
Core Logic:
Volatility Filter: Uses an EMA with ATR bands to define overextended price zones.
Momentum Divergence: Confirms reversals using RSI and MACD histogram shifts.
Price Action Filter: Requires candle confirmation in the direction of the trade.
Locked Signal Logic: Prevents repaints and disappearing trades by confirming signals only once per bar.
Trade Parameters:
Short Entry: Above upper band + overbought RSI + weakening MACD + bearish candle
Long Entry: Below lower band + oversold RSI + strengthening MACD + bullish candle
Take Profit: ±0.75%
Stop Loss: ±0.4%
This setup is tuned for traders using tight risk control and leverage, where execution precision and minimal drawdown tolerance are critical.

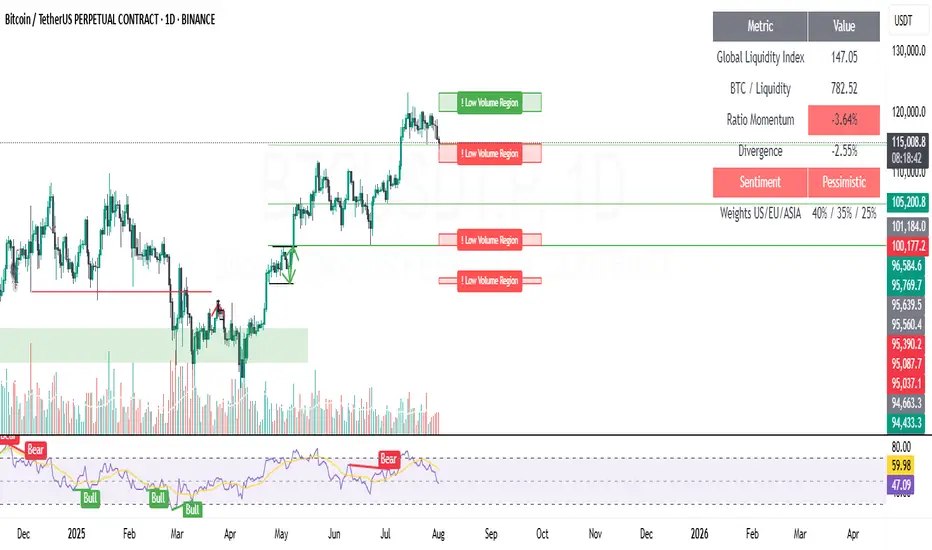
Low Volume Regions (Captura de liquidez)"Low Volume Regions"
Detects and highlights price zones where Bitcoin rapidly moved through with unusually low traded volume—approximating low-volume nodes. Adjacent sparse-volume bins are merged into cleaner regions. Zones above the current price are green, below are red; the emptiest zone (strongest low-volume signature) is tagged with “! Low Volume Region.” Opacity encodes scarcity: darker/less transparent means lower volume. Designed to surface liquidity capture areas likely to be revisited.
This indicator identifies and visualizes “low volume regions” in the price action of Bitcoin—price areas that were traversed quickly with little trading activity, creating potential liquidity gaps that the market may later revisit. These regions approximate what traders refer to as low-volume nodes (LVNs) or thin zones on a volume profile, without relying on native volume-profile data.
How it works:
It analyzes the last N candles (configurable lookback) and divides the price range into discrete bins.
Volume is accumulated per bin based on historical closes to estimate where trading was sparse.
Bins with volume below a chosen percentile threshold are marked as low-volume.
Nearby low-volume bins are merged into broader regions to reduce clutter and reflect meaningful sparse-volume zones.
Each merged zone’s average volume is used to compute a “scarcity” score; zones with comparatively less volume are rendered more opaque (stronger visual emphasis).
Zones above the current price are colored green, zones below are colored red.
The most extreme low-volume region (the one with the lowest relative volume) is flagged with the label “! Low Volume Region”, while others are labeled “Low Volume Region”.
Visuals:
Filled boxes (zones) show aggregated low-volume price regions projected forward.
Opacity scales: emptier (lower volume) regions are darker/less transparent.
Single label per region indicates its nature; the strongest zone includes an exclamation mark prefixed to the label.
Color indicates relative position to current price (bullish above / bearish below).
Key inputs / parameters:
lookback: Number of candles to include in the volume analysis window.
binsCount: Granularity of price partitioning.
percentileThreshold: Defines how “low” volume must be to qualify (e.g., 25 picks the bottom 25% by volume).
zoneWidthBars: How far the detected region extends to the right for visibility.
mergeGapFactor: Controls how aggressively adjacent low-volume bins are merged.
Interpretation:
Traders can use these regions as potential areas of liquidity capture or imbalance. Price often revisits such thin zones to fill them (retracement) before continuing in the prevailing direction. The highlighted “strongest” zone (with the exclamation) is the most pronounced candidate for such behavior.
Usage tips:
Combine with overall trend/context to decide if a revisit is a corrective opportunity or a trap.
Use the zones as potential support/resistance or entries/exits when price returns.
Adjust lookback and binsCount to suit the time frame (higher lookback + more bins for higher timeframes).
Limitations:
This is an approximation of volume-profile behavior using only candle close-based binning; it does not replace full-profile footprint or order-book analysis.
Zones are recalculated on the latest candle only to reduce clutter; historical persistence or revisit detection must be handled externally if needed.
Example use case:
On a daily BTC chart, a sharp green candle that quickly leaps above a narrow consolidation with low volume leaves behind a “Low Volume Region.” If price later retraces, traders watch that zone for potential liquidity capture or a bounce.
Reversal Hunter X - Private v2//@version=5
indicator("Reversal Hunter X - Private v2", overlay=true)
// === INPUTS ===
rsiSource = input.source(close, "RSI Source")
rsiLen = input.int(14, "RSI Length")
rsiOB = input.int(70, "Overbought Level")
rsiOS = input.int(30, "Oversold Level")
vwapLookback = input.int(50, "VWAP Lookback for Deviation")
vwapDeviation = input.float(2.5, "VWAP Deviation Threshold (%)")
bollLen = input.int(20, "Volatility Band Length")
bollMult = input.float(2.5, "Volatility Band Multiplier")
volAvgLen = input.int(20, "Volume Average Length")
volSpikeRatio = input.float(1.3, "Volume Spike Threshold (1.3 = 30%+)")
showSignals = input.bool(true, "Show Top/Bottom Signals")
// === CALCULATIONS ===
// RSI and divergence
rsi = ta.rsi(rsiSource, rsiLen)
rsiHigh = ta.pivothigh(rsi, 3, 3)
rsiLow = ta.pivotlow(rsi, 3, 3)
priceHigh = ta.pivothigh(high, 3, 3)
priceLow = ta.pivotlow(low, 3, 3)
bearDiv = (not na(rsiHigh) and not na(priceHigh)) and rsiHigh < rsi and priceHigh > high
bullDiv = (not na(rsiLow) and not na(priceLow)) and rsiLow > rsi and priceLow < low
// VWAP Deviation
vwap = ta.vwap
vwapDev = ((close - vwap) / vwap) * 100
vwapOver = vwapDev > vwapDeviation
vwapUnder = vwapDev < -vwapDeviation
// Volatility Bands (like Bollinger Bands)
basis = ta.sma(close, bollLen)
dev = bollMult * ta.stdev(close, bollLen)
upperBand = basis + dev
lowerBand = basis - dev
// SFP trap detection
sfpTop = high > ta.highest(high, 20) and close < open and close < high
sfpBottom = low < ta.lowest(low, 20) and close > open and close > low
// === Trend Filter ===
ema200 = ta.ema(close, 200)
bullTrend = close > ema200
bearTrend = close < ema200
// === Volume Filter ===
volAvg = ta.sma(volume, volAvgLen)
volSpike = volume > (volAvg * volSpikeRatio)
// === FINAL SIGNAL CONDITIONS ===
topSignal = bearDiv and vwapOver and close > upperBand and sfpTop and bearTrend and volSpike
bottomSignal = bullDiv and vwapUnder and close < lowerBand and sfpBottom and bullTrend and volSpike
// === PLOTS ===
plotshape(showSignals and topSignal, title="Top Signal", location=location.abovebar, color=color.red, style=shape.labeldown, text="TOP")
plotshape(showSignals and bottomSignal, title="Bottom Signal", location=location.belowbar, color=color.green, style=shape.labelup, text="BOTTOM")
plot(ema200, title="EMA 200", color=color.orange)
// === ALERTS ===
alertcondition(topSignal, title="Top Signal Alert", message="Reversal Hunter X: TOP Signal")
alertcondition(bottomSignal, title="Bottom Signal Alert", message="Reversal Hunter X: BOTTOM Signal")

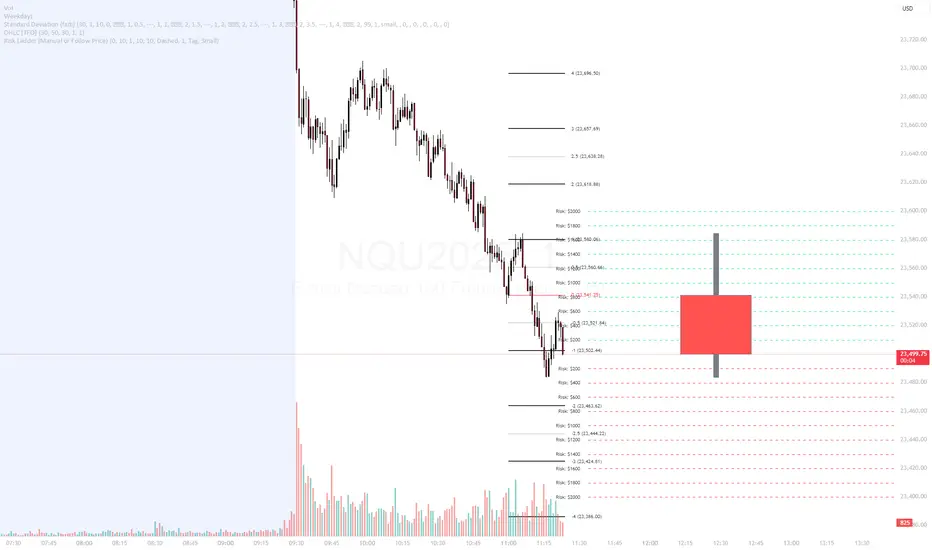
Risk Ladder📝 Description:
The Risk Ladder plots visual risk levels above and below a selected price, helping traders instantly assess risk exposure per contract across key price intervals.
This tool offers two modes:
✅ Live Mode – Automatically anchors to the current market price
✅ Manual Mode – Anchor the ladder to your custom trade entry price (e.g., after placing a position)
Each level displays the cumulative risk in dollars, calculated based on:
Contract size
Tick value for the symbol (auto-detected for ES, NQ, CL, etc.)
Distance from entry price
🎨 Fully Customizable:
Interval between levels (e.g. every 10 points)
Number of levels above/below
Line color, width, and style
Label size, shape (tag or box), color, and offset
Toggle between live or manual entry modes
💡 Use Cases:
Visualize risk tiers before or after entering a position
Define profit-taking and stop-loss zones based on risk multiples
Clean overlay to complement your price action, VWAP, or R:R strategy
🔁 How to Use:
Select whether to use manual entry or follow live price
Adjust your risk interval and contract size
Watch the ladder instantly reflect total risk every level
DEMACROSSOVA BY FLACODouble EMAs for entry signals
ATR Bands for stoploss
Fibonacci bollinger bands for early exit confirmation

Chaos Volume Trend //Chaos Volume Trend不公开提供,请在网站 okx.tw 购买
//Chaos Volume Trend不公開提供,請在網站 okx.tw 購買
//Chaos Volume Trend is not publicly available. Please purchase it on the website okx.tw

Fibonacci Kanalları Zaman DilimliI understand that you want to fetch moving Fibonacci levels from a different timeframe (fibTimeframe) in Pine Script and plot them on the chart.
Here is a simple example code that:
Takes the timeframe input from settings (fibTimeframe),
Uses request.security() to get data from the selected timeframe,
Calculates Fibonacci levels,
Uses plot() to display the levels on the chart.

Power candlePower candle --------------------------Power candle --------------------------Power candle --------------------------Power candle --------------------------Power candle --------------------------Power candle --------------------------Power candle --------------------------Power candle --------------------------Power candle --------------------------Power candle --------------------------Power candle --------------------------Power candle --------------------------Power candle --------------------------Power candle --------------------------Power candle --------------------------

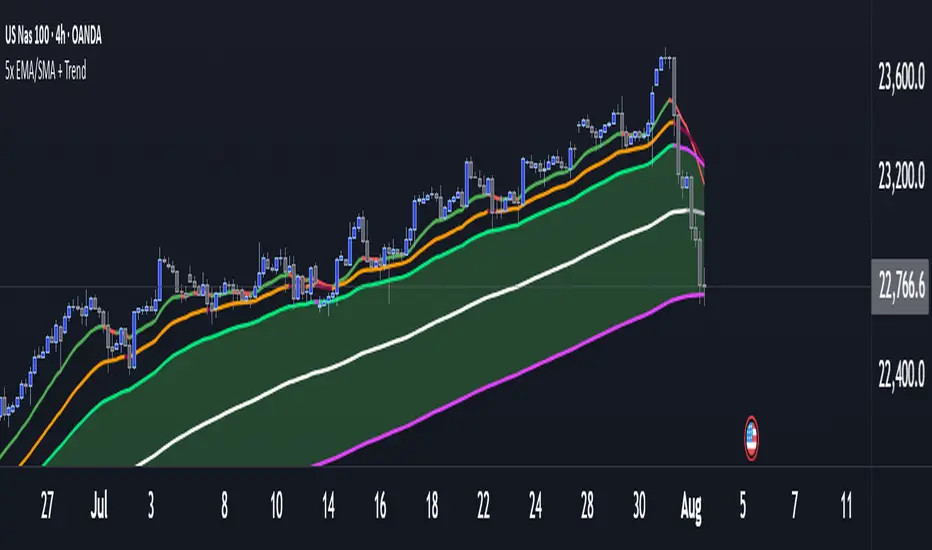
Multi 5x EMA/SMA Colored + EMA Trend Cloud- Ok so these are the settings to the ema's
15
30
50
115
200
Remember these ema's change color depending if the market is bullish or bearish, so choose what colors you want to see bullish and what colors you want to see Bearish
You can also toggle them on or off if you want.
- These are the setting to the trend cloud so you know if the market is bullish or Bearish
50
200
200
Toggle off all plots and only have plots background on
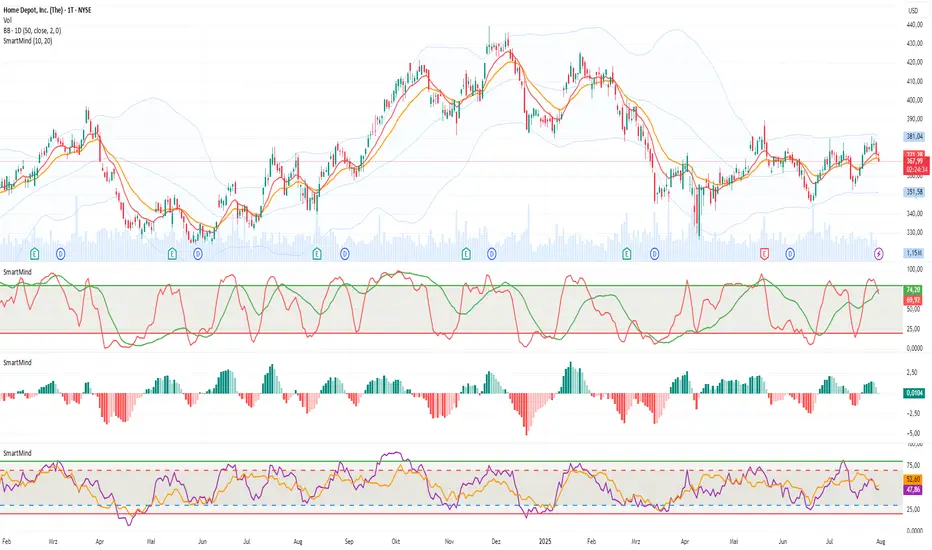
SmartMind2The MACD (Moving Average Convergence Divergence) is a popular technical indicator in trading, primarily used to detect trends and possible reversal points.
How is the MACD structured?
The MACD indicator consists of three components:
MACD Line:
Calculated as the difference between two exponential moving averages (EMAs), commonly 12 and 26 periods.
Formula:
MACD Line
=
𝐸
𝑀
𝐴
12
(
Price
)
−
𝐸
𝑀
𝐴
26
(
Price
)
MACD Line=EMA
12
(Price)−EMA
26
(Price)
Signal Line:
An exponential moving average (usually 9 periods) of the MACD line.
Formula:
Signal Line
=
𝐸
𝑀
𝐴
9
(
MACD Line
)
Signal Line=EMA
9
(MACD Line)
Histogram:
Graphically represents the difference between the MACD line and the Signal line.
Formula:
Histogram
=
MACD Line
−
Signal Line
Histogram=MACD Line−Signal Line
Interpretation of MACD:
Buy Signal: Occurs when the MACD line crosses above the signal line (bullish signal).
Sell Signal: Occurs when the MACD line crosses below the signal line (bearish signal).
Trend Reversal: A divergence between price movements and the MACD indicates a potential reversal (e.g., rising prices with a falling MACD).
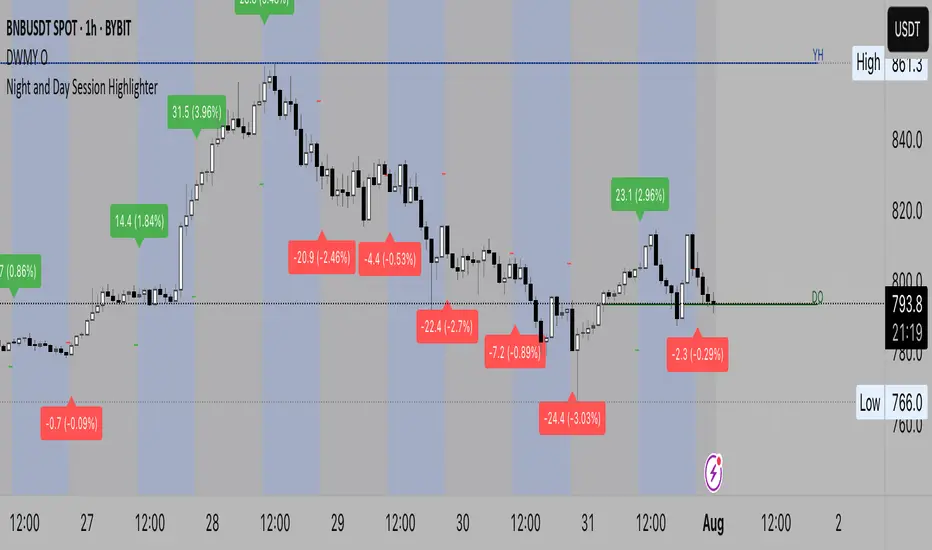
Night and Day Session Highlighter % (Valehson)- This script splits the day into night and day sessions and displays the price change in percentage.
- Этот скрипт разделяет день на вечерние и дневные сессии и показывает изменение цены в процентах.
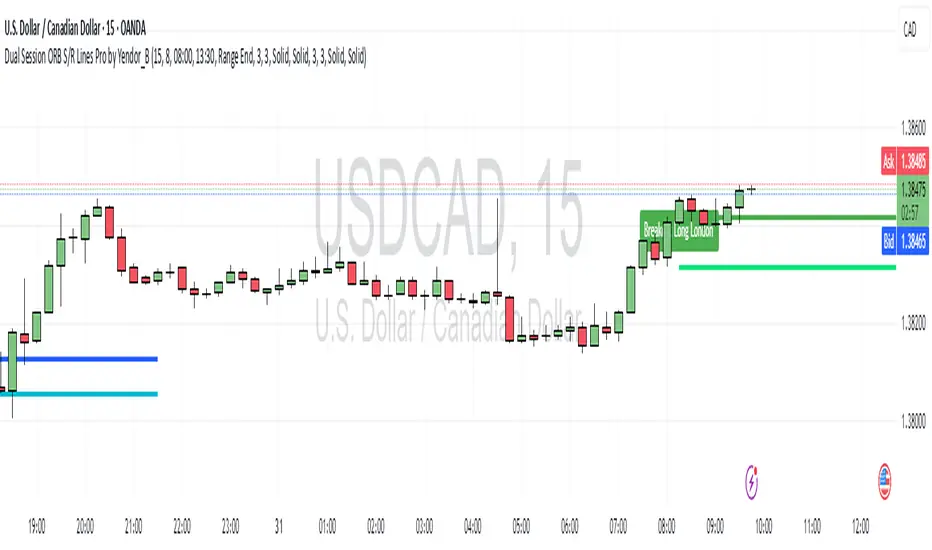
Dual Session ORB S/R Lines Pro by Yendor_BShort description:
Clean opening-range breakout support/resistance lines for London and US sessions with confirmed breakout labels and alert-ready signals. UTC-based, adjustable start point, customizable styling, minimal clutter.
Detailed description:
What it does:
Captures the Opening Range (default first 15 minutes) for London and New York (US) sessions in UTC, plots the high and low as support/resistance lines, and marks confirmed breakouts when price closes beyond those levels. Lines can begin at either the range end or session start and persist for the configured session length.
Key Features:
ORB defined over the first N minutes after session open (configurable, default 15).
Two sessions: London and US (New York) with separate start times.
High/low support & resistance lines per session:
Selectable start point: Range End or Session Start.
Independently customizable color, width, and style (solid/dashed/dotted) for each high and low.
Confirmed breakout labels: only on the first candle that closes beyond the ORB high or low after the range completes (prior close must be inside).
Alerts and alertconditions for breakout long/short per session, usable in TradingView’s alert dialog.
Fully UTC-based. Works on any timeframe; 1-minute or 5-minute recommended for precision.
Minimal visual clutter; no persistent shaded boxes in this version.
Inputs explained:
ORB Duration (minutes): Length of the opening range used to calculate session high and low.
Session Length (hours): How long the S/R lines remain active (typically full session).
London / US Start (UTC): Session open times in UTC.
Line Start Point: Choose whether the lines begin at the range end or at the session start.
High/Low Styling: Independent color, thickness, and style for each session’s high and low.
Breakout Labels: Toggle one-time confirmed breakout annotations.
Alerts: Enable breakout alert messages.
Example workflows:
Monitor the first 15 minutes of the London session.
After the range, wait for a candle to close beyond the high or low for a confirmed breakout.
Use the label or alert to trigger entry logic (retest, continuation, etc.).
Repeat for the US session; compare overlaps for higher conviction.
Alert setup:
Open the Alerts panel. Choose one of the built-in alertconditions: London Breakout Long, London Breakout Short, US Breakout Long, US Breakout Short. Set frequency to Once Per Bar Close. Customize notification/webhook payload if automating.
Preset suggestions:
Standard London ORB: 15 minute range, lines from range end, green high / lime low.
Standard US ORB: 15 minute range, lines from range end, blue high / aqua low.
Overlap Bias: Both sessions active, lines start from session start, differentiated styles.
Tips & best practices:
Combine with external volume or volatility filters to reduce false breakouts. Use on correlated pairs to observe consistent session structure. Treat broken ORB levels as flipped support/resistance on revisit. Prefer confirmed closes beyond lines rather than wick touches.
Limitations / disclaimer:
Provides structural visualization and breakout signaling; does not guarantee profitability. Always apply proper risk management and confirm with additional context. Backtest settings before live use.
Tags:
#ORB #OpeningRangeBreakout #SessionTrading #LondonSession #NewYorkSession #SupportResistance #Breakout #Intraday #Pinev6 #TradingView #Forex #TrendStructure #Alerts #USD #EURUSD #TradingSignals #UTCBased #PriceAction #MarketStructure #IntradayBreakouts