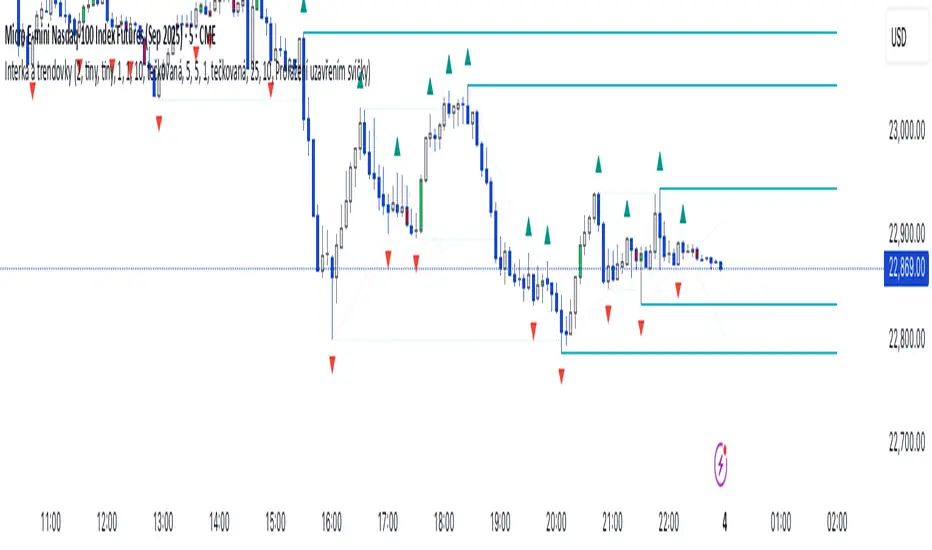
Bill Williams Indicators
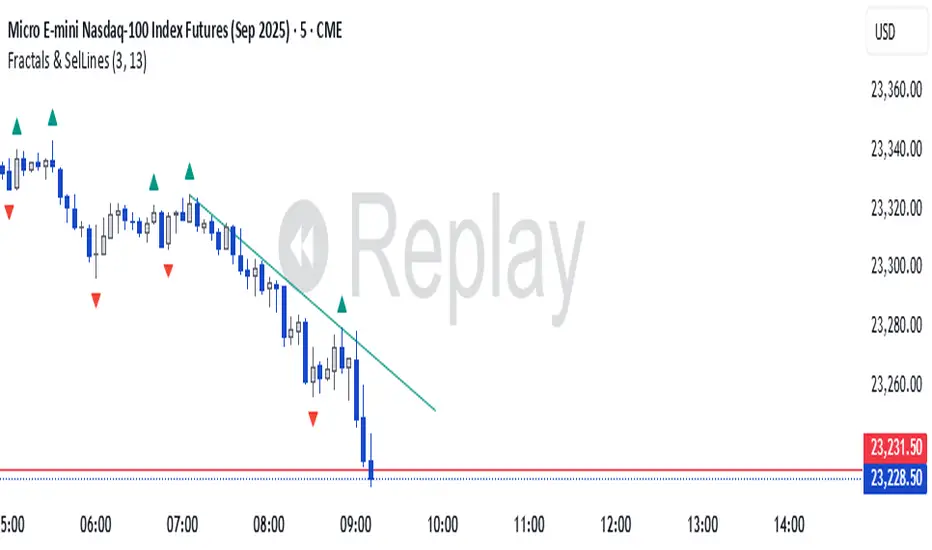
Fraktály a Trendovkyal shlash dlka sklhsda hasd klnasdnlkcalknacs 654 as64asd 65ads 156as 13ads 32asd 165as
Chaos Volume Trend //Chaos Volume Trend不公开提供,请在网站 okx.tw 购买
//Chaos Volume Trend不公開提供,請在網站 okx.tw 購買
//Chaos Volume Trend is not publicly available. Please purchase it on the website okx.tw

Buy/Sell Signal - Advanced v2The Buy/Sell Signal – Advanced v2 indicator is a powerful tool designed for traders who seek more reliable and filtered entries. This indicator combines classic technical analysis with modern enhancements to reduce noise and false signals. It generates Buy signals when a bullish candle closes above the 14-period Simple Moving Average (SMA), the RSI is below the oversold threshold (default: 30), and trading volume is higher than the 20-period average—indicating strong momentum and potential reversal from a discounted price zone. Conversely, a Sell signal appears when a bearish candle closes below the SMA, RSI is above the overbought level (default: 70), and volume exceeds its average—signaling potential weakness after a price rally.
In addition to entry signals, the indicator automatically plots dynamic support and resistance levels using pivot highs and lows. These levels help traders identify key zones for confirmation, breakout, or rejection. The SMA provides trend direction context, while the volume and RSI filters act as safeguards to avoid trading in low-quality conditions.
Ideal for scalpers and intraday traders on 5-minute to 1-hour timeframes, this indicator helps capture trend continuations and early reversals with confidence. For best results, use the signals in conjunction with multi-timeframe analysis and price action confirmation. This tool is especially effective on assets like XAUUSD, forex pairs, and indices.

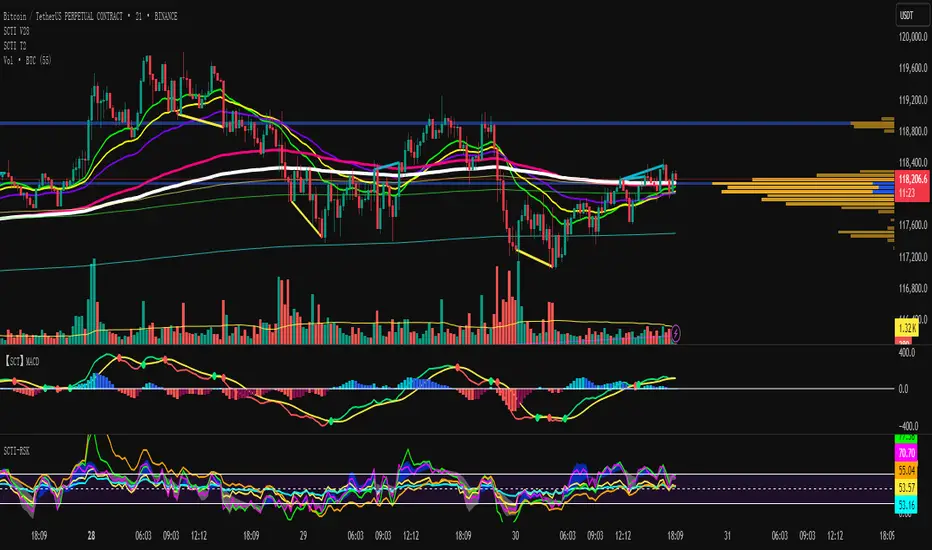
SCTI-RSKSCTI-RSK 是一个多功能技术指标合集,整合了多种常用技术指标于一个图表中,方便交易者综合分析市场状况。该指标包含以下五个主要技术指标模块,每个模块都可以单独显示或隐藏:
Stoch RSI - 随机相对强弱指数
KDJ - 随机指标
RSI - 相对强弱指数
CCI - 商品通道指数
Williams %R - 威廉指标
主要特点
模块化设计:每个指标都可以单独开启或关闭显示
交叉信号可视化:Stoch RSI和KDJ的金叉/死叉信号有彩色填充标识
多时间框架分析:支持不同长度的参数设置
直观界面:清晰的参数分组和颜色区分
适用场景
趋势判断
超买超卖区域识别
交易信号确认
多指标共振分析
English Description
SCTI-RSK is a comprehensive technical indicator that combines multiple popular indicators into a single chart for traders to analyze market conditions holistically. The indicator includes the following five main technical indicator modules, each can be toggled on/off individually:
Stoch RSI - Stochastic Relative Strength Index
KDJ - Stochastic Oscillator
RSI - Relative Strength Index
CCI - Commodity Channel Index
Williams %R - Williams Percent Range
Key Features
Modular Design: Each indicator can be shown or hidden independently
Visual Crossover Signals: Golden/Death crosses are highlighted with color fills for Stoch RSI and KDJ
Multi-Timeframe Analysis: Supports different length parameters
Intuitive Interface: Clear parameter grouping and color differentiation
Use Cases
Trend identification
Overbought/Oversold zone recognition
Trade signal confirmation
Multi-indicator confluence analysis
参数说明 (Parameter Explanation)
指标参数分为6个主要组别:
基础指标设置 - 控制各指标的显示/隐藏
Stoch RSI 设置 - 包括K值、D值、RSI长度等参数
KDJ 设置 - 包括周期、信号线等参数
RSI 设置 - 包括RSI长度、中期长度等参数
CCI 设置 - 包括CCI长度、中期长度等参数
Williams %R 设置 - 包括长度参数
使用建议 (Usage Suggestions)
初次使用时,可以先开启所有指标观察它们的相互关系
根据个人交易风格调整各指标的长度参数
关注多指标同时发出信号时的交易机会
结合价格行为和其他分析工具确认信号
更新日志 (Changelog)
v1.0 初始版本,整合五大技术指标
Williams Alligator with Background ColoringThe Benefits of the Williams Alligator – Without the “Spaghetti” on Your Chart
If you're one of those traders who prefer a clean, well-structured chart but don't want to miss out on the advantages of the Williams Alligator, this script is the perfect solution.
It includes all the features of the original TradingView script plus a background color feature based on your custom parameters:
Green when all candles are above the Alligator lines
Red when all candles are below all lines
Gray for everything in between
Feel free to customize the colors and transparency to your liking.
Happy Trading!

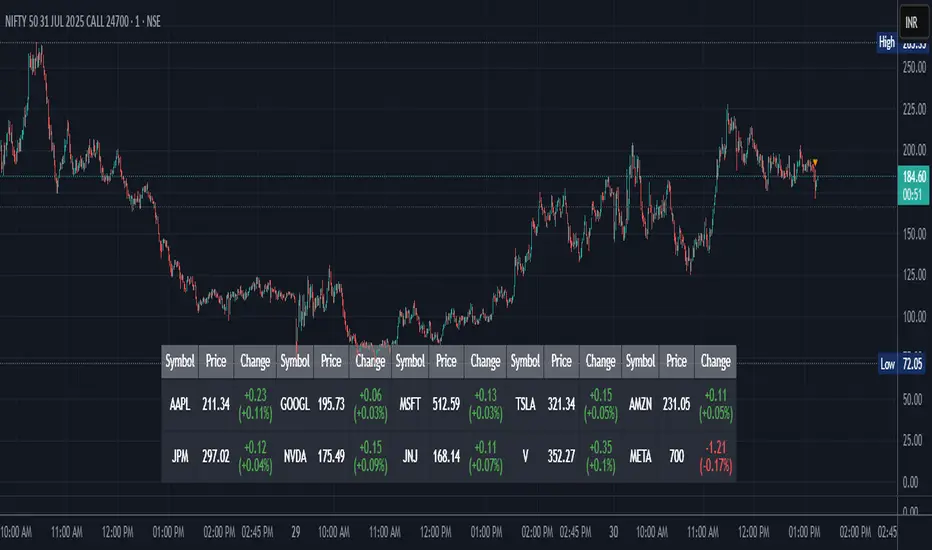
Stock Table aiTrendviewProfessional Stock Market Monitoring Table (Pine Script v5)
This indicator is a real-time multi-asset monitoring table designed for professional traders, analysts, and portfolio managers using TradingView. Built with Pine Script v5, it enables users to track up to 10 instruments (stocks, indices, forex pairs, cryptocurrencies, or commodities) in a unified table embedded directly into the chart. It is intended to streamline portfolio monitoring, cross-market analysis, and rapid visual comparison of asset performance.
The core logic of this script involves retrieving live price data through TradingView’s request.security() function for each of the selected symbols. It calculates both absolute price change and percentage price change relative to the previous bar close. This ensures users can see real-time movements in each asset’s price. These calculations are updated at the close of every bar to optimize performance and reduce processing load using the barstate.islast condition.
The display structure is dynamically generated using table.new() and related functions. Internally, the script stores symbol and price data in arrays for efficient processing. Symbols are cleaned to remove exchange prefixes (e.g., "NASDAQ:", "BINANCE:") so only the ticker name is displayed. Based on the selected layout (1 to 5 columns), the table auto-adjusts its row structure to maintain clarity and symmetry. Each cell reflects the ticker symbol, current price, and changes, with conditional formatting applied to indicate price movement direction using green (positive), red (negative), or neutral colors.
Users can customize many visual elements including text size, color themes, transparency, table position, and whether headers are shown. The script includes built-in fallbacks for invalid symbols or empty data, ensuring robustness and uninterrupted performance during live market hours.
Use cases include:
Intraday traders monitoring multiple instruments simultaneously.
Swing traders assessing relative strength and correlation.
Portfolio managers scanning asset performance without switching charts.
Analysts preparing multi-asset presentations or watchlists.
To use the tool:
Paste the Pine Script into the Pine Editor.
Add the script to the chart.
Enter your desired symbols via the input fields.
Customize table position, layout, size, and color to suit your workspace.
This script does not provide trade signals or financial advice. It is purely a market visualization and data presentation tool. All calculations are based on live chart data and are synchronized with the chart’s timeframe.
Disclaimer from aiTrendview:
This script is a visual tool developed for market awareness and comparative observation. It does not constitute financial advice or guarantee trading results. aiTrendview and its affiliates are not responsible for any losses arising from decisions made based on this tool. All trading involves risk, and past performance is not indicative of future results. Always consult with a qualified financial advisor before making trading decisions.
HMM Adaptive BB & Regime Signals1. Install the Indicator
Open TradingView and load the chart for your chosen symbol.
Click the Pine Editor tab at the bottom.
Delete any existing code, paste in the full Pine Script.
Click Save, give it a name (e.g. “HMM Adaptive BB”), then click Add to Chart.
If the script compiles correctly, you’ll immediately see:
An orange upper/lower Bollinger-style channel
A blue SMA basis line
Shaded background indicating the current regime

HMM Volatility-Adaptive ChannelChannel Lines (orange)
Upper = SMA + ATR × dynamic multiplier
Lower = SMA − ATR × dynamic multiplier
Background Shade
Light green = High-Volatility regime (pₕ > 0.5)
Light red = Low-Volatility regime (pₕ ≤ 0.5)
Breakout Signals
BUY marker (▲) when close crosses above the upper line
SELL marker (▼) when close crosses below the lower line

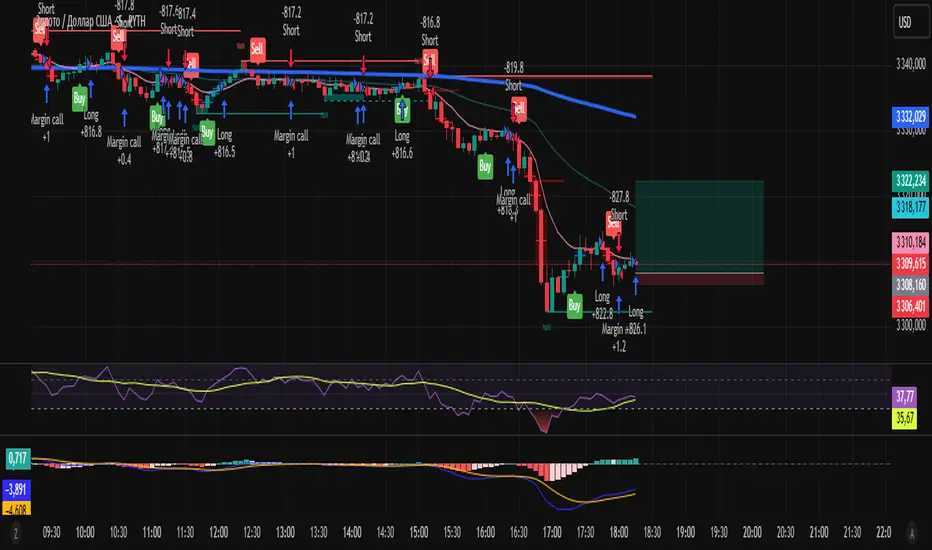
CE XAU/USDT Strategy📌 Auto-Trading Strategy Using CE on XAU/USDT (5M)
Indicator: CE
Parameters:
• ATR Period: 1
• ATR Multiplier: 1.85
Timeframe: 5 minutes
Instrument: Gold (XAU/USD)
🔁 Logic:
• Buy signal → Close short, open long
• Sell signal → Close long, open short
⚙️ Automation:
1. CE indicator on TradingView generates signals
2. Signals are sent via webhook to a Python bot
3. The bot opens/closes trades in MT5 accordingly
✅ Advantages:
• Full automation
• Operates 24/7 without manual intervention
⚠️ Important:
• Always test on a demo account
• Manage risk and position size properly
📌 Стратегия автоторговли по CE на XAU/USDT (5М)
Индикатор: CE
Параметры:
• ATR Period: 1
• ATR Множитель: 1.85
Таймфрейм: 5 минут
Инструмент: Золото (XAU/USD)
🔁 Логика:
• Buy сигнал → закрыть шорт, открыть лонг
• Sell сигнал → закрыть лонг, открыть шорт
⚙️ Автоматизация:
1. CE в TradingView генерирует сигналы
2. Webhook отправляет их в Python-бот
3. Бот открывает/закрывает сделки в MT5
✅ Плюсы:
• Полная автоматизация
• Работа 24/7 без вмешательства
⚠️ Важно:
• Тестируй на демо
• Управляй рисками и лотами
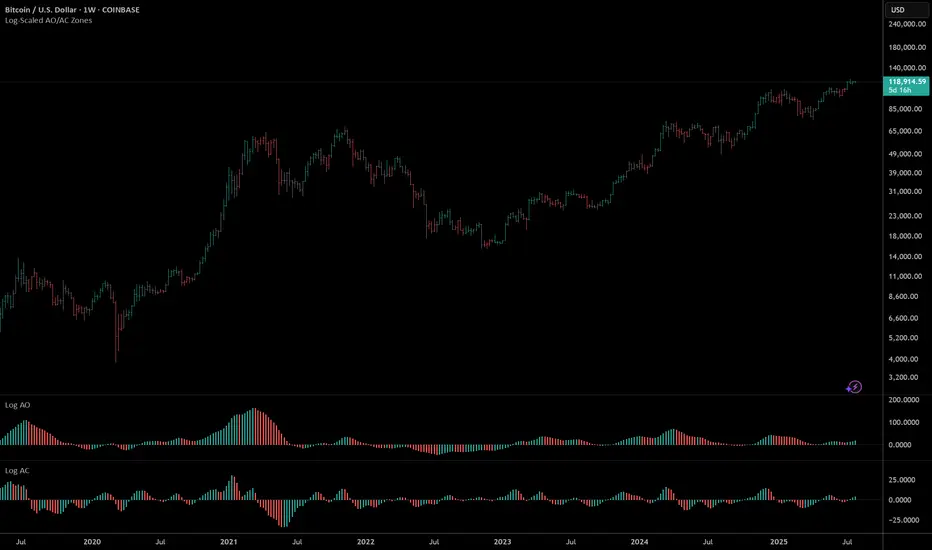
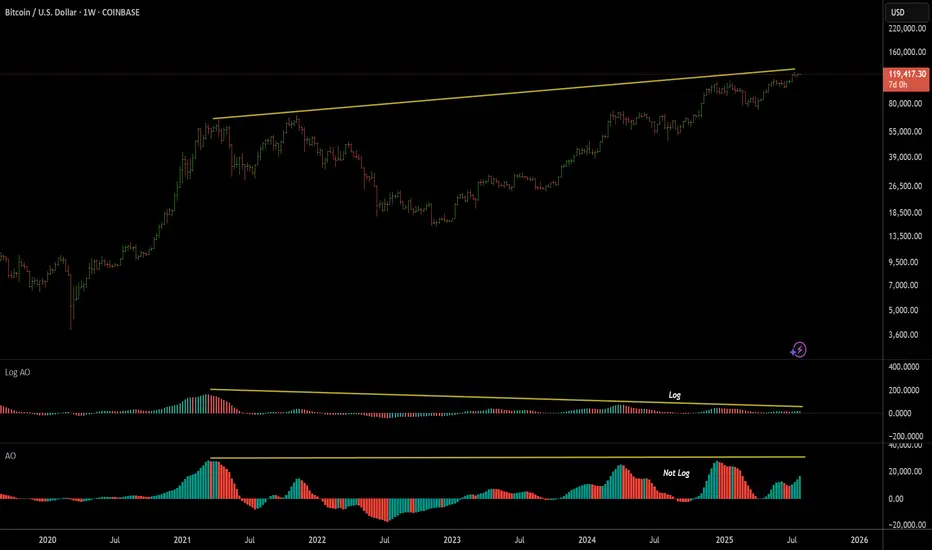
AO/AC Zones (Log Price)William's AO/AC Zones scaled to work with log-price AO/AC indicators.
When the log AO and log AC are green = price bar is painted green
When the log AO and log AC are different = price bar painted gray
When the log AO and log AC are red = price bar painted red
Useful for seeing when momentum is beginning to increase or decrease, and direction on the AO/AC could be changing. Can also be used with William's standard entry and exit signals. Works with the log indicators, made for volatile and long-term charts which exhibit logarithmic trends.
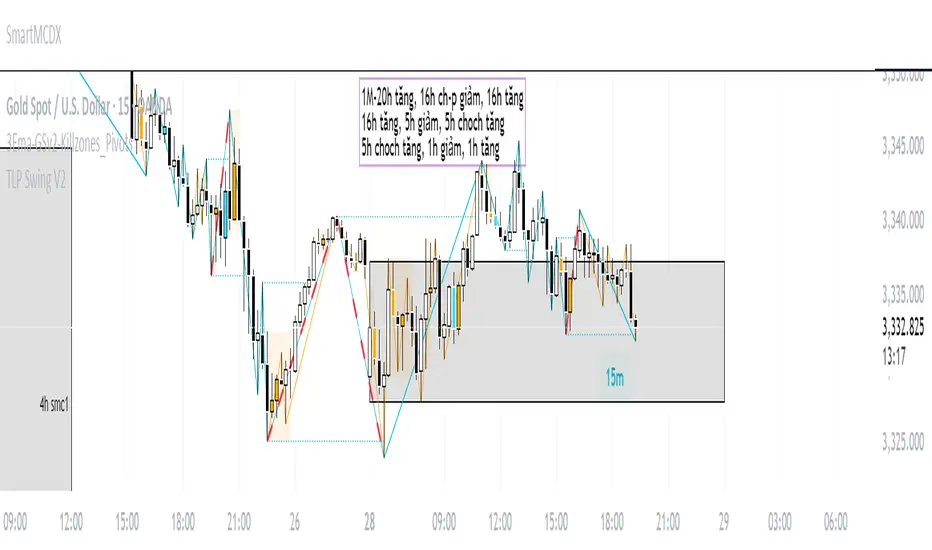
TLP Swing Chart V2thanks
// This source code is subject to the terms of the Mozilla Public License 2.0 at mozilla.org
// Sửa đổi trên code gốc của © meomeo105
// © meomeo105
//@version=5
indicator('TLP Swing Chart V2', shorttitle='TLP Swing V2', overlay=true, max_lines_count=500)
//-----Input-------
customTF = input.timeframe(defval="",title = "Show Other TimeFrame")
showTLP = input.bool(false, 'Show TLP', inline = "TLP1")
colorTLP = input.color(color.aqua, '', inline = "TLP1")
showSTLP = input.bool(true, 'Show TLP Swing', inline = "Swing1")
colorSTLP = input.color(color.aqua, '', inline = "Swing1")
showLabel = input.bool(true, 'Show Label TimeFrame')
lineSTLP = input.string(title="",options= ,defval="(─)", inline = "Swing1")
lineStyleSTLP = lineSTLP == "(┈)" ? line.style_dotted : lineSTLP == "(╌)" ? line.style_dashed : line.style_solid
//IOSB
IOSB = "TLPInOutSideBarSetting"
ISB = input(true,group =IOSB, title="showISB")
colorISB = input.color(color.rgb(250, 171, 0), inline = "ISB")
OSB = input(true,group =IOSB, title="showOSB")
colorOSB = input.color(color.rgb(56, 219, 255), inline = "OSB")
ZoneColor = input(defval = color.new(color.orange, 90),group =IOSB, title = "Background Color")
BorderColor = input(defval = color.new(color.orange, 100),group =IOSB, title = "Border Color")
/////////////////
var aCZ = array.new_float(0)
float highest = high
float lowest = low
if (array.size(aCZ) > 0)
highest := array.get(aCZ, 0)
lowest := array.get(aCZ, 1)
insideBarCondtion = low >= lowest and low <= highest and high >= lowest and high <= highest
if ( insideBarCondtion == true )
array.push(aCZ, high )
array.push(aCZ, low )
if( array.size(aCZ) >= 2 and insideBarCondtion == false )
float maxCZ = array.max(aCZ)
float minCZ = array.min(aCZ)
box.new(bar_index - (array.size(aCZ) / 2) - 1, maxCZ, bar_index - 1, minCZ, bgcolor = ZoneColor, border_color = BorderColor)
array.clear(aCZ)
//////////////////////////Global//////////////////////////
var arrayLineTemp = array.new_line()
// Funtion
f_resInMinutes() =>
_resInMinutes = timeframe.multiplier * (
timeframe.isseconds ? 1. / 60. :
timeframe.isminutes ? 1. :
timeframe.isdaily ? 1440. :
timeframe.isweekly ? 10080. :
timeframe.ismonthly ? 43800. : na)
// Converts a resolution expressed in minutes into a string usable by "security()"
f_resFromMinutes(_minutes) =>
_minutes < 1 ? str.tostring(math.round(_minutes*60)) + "S" :
_minutes < 60 ? str.tostring(math.round(_minutes)) + "m" :
_minutes < 1440 ? str.tostring(math.round(_minutes/60)) + "H" :
_minutes < 10080 ? str.tostring(math.round(math.min(_minutes / 1440, 7))) + "D" :
_minutes < 43800 ? str.tostring(math.round(math.min(_minutes / 10080, 4))) + "W" :
str.tostring(math.round(math.min(_minutes / 43800, 12))) + "M"
f_tfRes(_res,_exp) =>
request.security(syminfo.tickerid,_res,_exp,lookahead=barmerge.lookahead_on)
var label labelError = label.new(bar_index, high, text = "", color = #00000000, textcolor = color.white,textalign = text.align_left)
sendError(_mmessage) =>
label.set_xy(labelError, bar_index + 3, close )
label.set_text(labelError, _mmessage)
var arrayLineChoCh = array.new_line()
var label labelTF = label.new(time, close, text = "",color = color.new(showSTLP ? colorSTLP : colorTLP,95), textcolor = showSTLP ? colorSTLP : colorTLP,xloc = xloc.bar_time, textalign = text.align_left)
//////////////////////////TLP//////////////////////////
var arrayXTLP = array.new_int(5,time)
var arrayYTLP = array.new_float(5,close)
var arrayLineTLP = array.new_line()
int drawLineTLP = 0
_high = high
_low = low
_close = close
_open = open
if(customTF != timeframe.period)
_high := f_tfRes(customTF,high)
_low := f_tfRes(customTF,low)
_close := f_tfRes(customTF,close)
_open := f_tfRes(customTF,open)
highPrev = _high
lowPrev = _low
// drawLineTLP => 2:Tiếp tục 1:Đảo chiều; // Outsidebar 2:Tiếp tục 3:Tiếp tục và Đảo chiều 4 : Đảo chiều 2 lần
drawLineTLP := 0
if(_high > highPrev and _low > lowPrev )
if(array.get(arrayYTLP,0) > array.get(arrayYTLP,1))
if(_high <= high)
array.set(arrayXTLP, 0, time)
array.set(arrayYTLP, 0, _high )
drawLineTLP := 2
else
array.unshift(arrayXTLP,time)
array.unshift(arrayYTLP,_high )
drawLineTLP := 1
else if(_high < highPrev and _low < lowPrev )
if(array.get(arrayYTLP,0) > array.get(arrayYTLP,1))
array.unshift(arrayXTLP,time)
array.unshift(arrayYTLP,_low )
drawLineTLP := 1
else
if(_low >= low)
array.set(arrayXTLP, 0, time)
array.set(arrayYTLP, 0, _low )
drawLineTLP := 2
else if(_high >= highPrev and _low < lowPrev or _high > highPrev and _low <= lowPrev )
if(array.get(arrayYTLP,0) > array.get(arrayYTLP,1))
if(_high >= array.get(arrayYTLP,0) and array.get(arrayYTLP,1) < _low )
if(_high <= high)
array.set(arrayXTLP, 0, time)
array.set(arrayYTLP, 0, _high )
drawLineTLP := 2
else if(_high >= array.get(arrayYTLP,0) and array.get(arrayYTLP,1) > _low )
if(_close < _open)
if(_high <= high)
array.set(arrayXTLP, 0, time)
array.set(arrayYTLP, 0, _high )
array.unshift(arrayXTLP,time)
array.unshift(arrayYTLP,_low )
drawLineTLP := 3
else
array.unshift(arrayXTLP,time)
array.unshift(arrayYTLP,_low )
array.unshift(arrayXTLP,time)
array.unshift(arrayYTLP,_high )
drawLineTLP := 4
else if(array.get(arrayYTLP,0) < array.get(arrayYTLP,1))
if(_low <= array.get(arrayYTLP,0) and _high < array.get(arrayYTLP,1))
if(_low >= low)
array.set(arrayXTLP, 0, time)
array.set(arrayYTLP, 0, _low )
drawLineTLP := 2
else if(_low <= array.get(arrayYTLP,0) and _high > array.get(arrayYTLP,1))
if(_close > _open)
if(_low >= low)
array.set(arrayXTLP, 0, time)
array.set(arrayYTLP, 0, _low )
array.unshift(arrayXTLP,time)
array.unshift(arrayYTLP,_high )
drawLineTLP := 3
else
array.unshift(arrayXTLP,time)
array.unshift(arrayYTLP,_high )
array.unshift(arrayXTLP,time)
array.unshift(arrayYTLP,_low )
drawLineTLP := 4
else if((_high <= highPrev and _low >= lowPrev ))
highPrev := highPrev
lowPrev := lowPrev
if(f_resInMinutes() < f_tfRes(customTF,f_resInMinutes()) and drawLineTLP == 0)
if(array.get(arrayYTLP,0) > array.get(arrayYTLP,1))
if(array.get(arrayYTLP,0) <= high)
array.set(arrayXTLP, 0, time)
drawLineTLP := 2
else
if(array.get(arrayYTLP,0) >= low)
array.set(arrayXTLP, 0, time)
drawLineTLP := 2
if((showSTLP or showTLP) and f_resInMinutes() <= f_tfRes(customTF,f_resInMinutes()))
if(drawLineTLP == 2)
if(array.size(arrayLineTLP) >0)
line.set_xy2(array.get(arrayLineTLP,0),array.get(arrayXTLP,0),array.get(arrayYTLP,0))
else
array.unshift(arrayLineTLP,line.new(array.get(arrayXTLP,1),array.get(arrayYTLP,1),array.get(arrayXTLP,0),array.get(arrayYTLP,0), color = colorTLP,xloc = xloc.bar_time, style = lineStyleSTLP))
else if(drawLineTLP == 1)
array.unshift(arrayLineTLP,line.new(array.get(arrayXTLP,1),array.get(arrayYTLP,1),array.get(arrayXTLP,0),array.get(arrayYTLP,0), color = colorTLP,xloc = xloc.bar_time, style = lineStyleSTLP))
else if(drawLineTLP == 3)
if(array.size(arrayLineTLP) >0)
line.set_xy2(array.get(arrayLineTLP,0),array.get(arrayXTLP,1),array.get(arrayYTLP,1))
else
array.unshift(arrayLineTLP,line.new(array.get(arrayXTLP,2),array.get(arrayYTLP,2),array.get(arrayXTLP,1),array.get(arrayYTLP,1), color = colorTLP,xloc = xloc.bar_time, style = lineStyleSTLP))
array.unshift(arrayLineTLP,line.new(array.get(arrayXTLP,1),array.get(arrayYTLP,1),array.get(arrayXTLP,0),array.get(arrayYTLP,0), color = colorTLP,xloc = xloc.bar_time, style = lineStyleSTLP))
else if(drawLineTLP == 4)
array.unshift(arrayLineTLP,line.new(array.get(arrayXTLP,2),array.get(arrayYTLP,2),array.get(arrayXTLP,1),array.get(arrayYTLP,1), color = colorTLP,xloc = xloc.bar_time, style = lineStyleSTLP))
array.unshift(arrayLineTLP,line.new(array.get(arrayXTLP,1),array.get(arrayYTLP,1),array.get(arrayXTLP,0),array.get(arrayYTLP,0), color = colorTLP,xloc = xloc.bar_time, style = lineStyleSTLP))
//////////////////////////Swing TLP//////////////////////////
var arrayXSTLP = array.new_int(5,time)
var arrayYSTLP = array.new_float(5,close)
var arrayLineSTLP = array.new_line()
int drawLineSTLP = 0
int drawLineSTLP1 = 0
if(showSTLP)
if(math.max(array.get(arrayYSTLP,0),array.get(arrayYSTLP,1)) < math.min(array.get(arrayYTLP,0),array.get(arrayYTLP,1)) or math.min(array.get(arrayYSTLP,0),array.get(arrayYSTLP,1)) > math.max(array.get(arrayYTLP,0),array.get(arrayYTLP,1)))
//Khởi tạo bắt đầu
drawLineSTLP1 := 5
array.set(arrayXSTLP, 0, array.get(arrayXTLP,1))
array.set(arrayYSTLP, 0, array.get(arrayYTLP,1))
array.unshift(arrayXSTLP,array.get(arrayXTLP,0))
array.unshift(arrayYSTLP,array.get(arrayYTLP,0))
// drawLineSTLP kiểm tra điểm 1 => 13:Tiếp tục có sóng hồi // 12|19(reDraw):Tiếp tục không có sóng hồi // 14:Đảo chiều
if(array.get(arrayXTLP,0) == array.get(arrayXTLP,1))
if(array.get(arrayXSTLP,0) >= array.get(arrayXTLP,2) and array.get(arrayYSTLP,0) != array.get(arrayYTLP,1) and ((array.get(arrayYTLP,1) > array.get(arrayYTLP,2) and array.get(arrayYSTLP,0) > array.get(arrayYSTLP,1)) or (array.get(arrayYTLP,1) < array.get(arrayYTLP,2) and array.get(arrayYSTLP,0) < array.get(arrayYSTLP,1))))
drawLineSTLP1 := 12
array.set(arrayXSTLP, 0, array.get(arrayXTLP,1))
array.set(arrayYSTLP, 0, array.get(arrayYTLP,1))
else if(array.get(arrayXSTLP,0) <= array.get(arrayXTLP,2))
if((array.get(arrayYSTLP,0) > array.get(arrayYSTLP,1) and array.get(arrayYTLP,1) < array.get(arrayYSTLP,1)) or (array.get(arrayYSTLP,0) < array.get(arrayYSTLP,1) and array.get(arrayYTLP,1) > array.get(arrayYSTLP,1)))
drawLineSTLP1 := 14
array.unshift(arrayXSTLP,array.get(arrayXTLP,1))
array.unshift(arrayYSTLP,array.get(arrayYTLP,1))
else if((array.get(arrayYSTLP,0) > array.get(arrayYSTLP,1) and array.get(arrayYTLP,1) > array.get(arrayYSTLP,0)) or (array.get(arrayYSTLP,0) < array.get(arrayYSTLP,1) and array.get(arrayYTLP,1) < array.get(arrayYSTLP,0)))
drawLineSTLP1 := 13
_max = math.min(array.get(arrayYSTLP,0),array.get(arrayYSTLP,1))
_min = math.max(array.get(arrayYSTLP,0),array.get(arrayYSTLP,1))
_max_idx = 0
_min_idx = 0
for i = 2 to array.size(arrayXTLP)
if(array.get(arrayXSTLP,0) >= array.get(arrayXTLP,i))
break
if(_min > array.get(arrayYTLP,i))
_min := array.get(arrayYTLP,i)
_min_idx := array.get(arrayXTLP,i)
if(_max < array.get(arrayYTLP,i))
_max := array.get(arrayYTLP,i)
_max_idx := array.get(arrayXTLP,i)
if(array.get(arrayYSTLP,0) > array.get(arrayYSTLP,1))
array.unshift(arrayXSTLP,_min_idx)
array.unshift(arrayYSTLP,_min)
else if(array.get(arrayYSTLP,0) < array.get(arrayYSTLP,1))
array.unshift(arrayXSTLP,_max_idx)
array.unshift(arrayYSTLP,_max)
array.unshift(arrayXSTLP,array.get(arrayXTLP,1))
array.unshift(arrayYSTLP,array.get(arrayYTLP,1))
if(f_resInMinutes() < f_tfRes(customTF,f_resInMinutes()))
if(array.get(arrayYSTLP,0) == array.get(arrayYTLP,1) and array.get(arrayXSTLP,0) != array.get(arrayXTLP,1))
array.set(arrayXSTLP, 0, array.get(arrayXTLP,1))
drawLineSTLP1 := 19
if(f_resInMinutes() <= f_tfRes(customTF,f_resInMinutes()))
if(drawLineSTLP1 == 12 or drawLineSTLP1 == 19)
if(array.size(arrayLineSTLP) >0)
line.set_xy2(array.get(arrayLineSTLP,0),array.get(arrayXSTLP,0),array.get(arrayYSTLP,0))
else
array.unshift(arrayLineSTLP,line.new(array.get(arrayXSTLP,1),array.get(arrayYSTLP,1),array.get(arrayXSTLP,0),array.get(arrayYSTLP,0), color = colorSTLP,xloc = xloc.bar_time))
else if(drawLineSTLP1 == 14)
array.unshift(arrayLineSTLP,line.new(array.get(arrayXSTLP,1),array.get(arrayYSTLP,1),array.get(arrayXSTLP,0),array.get(arrayYSTLP,0), color = colorSTLP,xloc = xloc.bar_time))
else if(drawLineSTLP1 == 13)
array.unshift(arrayLineSTLP,line.new(array.get(arrayXSTLP,2),array.get(arrayYSTLP,2),array.get(arrayXSTLP,1),array.get(arrayYSTLP,1), color = colorSTLP,xloc = xloc.bar_time))
array.unshift(arrayLineSTLP,line.new(array.get(arrayXSTLP,1),array.get(arrayYSTLP,1),array.get(arrayXSTLP,0),array.get(arrayYSTLP,0), color = colorSTLP,xloc = xloc.bar_time))
else if(drawLineSTLP1 == 15)
if(array.size(arrayLineSTLP) >0)
line.set_xy2(array.get(arrayLineSTLP,0),array.get(arrayXSTLP,1),array.get(arrayYSTLP,1))
else
array.unshift(arrayLineSTLP,line.new(array.get(arrayXSTLP,2),array.get(arrayYSTLP,2),array.get(arrayXSTLP,1),array.get(arrayYSTLP,1), color = colorSTLP,xloc = xloc.bar_time))
array.unshift(arrayLineSTLP,line.new(array.get(arrayXSTLP,1),array.get(arrayYSTLP,1),array.get(arrayXSTLP,0),array.get(arrayYSTLP,0), color = colorSTLP,xloc = xloc.bar_time))
// drawLineSTLP kiểm tra điểm 0 => 3:Tiếp tục có sóng hồi // 2|9(reDraw):Tiếp tục không có sóng hồi // 4:Đảo chiều
if(array.get(arrayXSTLP,0) >= array.get(arrayXTLP,1) and array.get(arrayYSTLP,0) != array.get(arrayYTLP,0) and ((array.get(arrayYTLP,0) > array.get(arrayYTLP,1) and array.get(arrayYSTLP,0) > array.get(arrayYSTLP,1)) or (array.get(arrayYTLP,0) < array.get(arrayYTLP,1) and array.get(arrayYSTLP,0) < array.get(arrayYSTLP,1))))
drawLineSTLP := 2
array.set(arrayXSTLP, 0, array.get(arrayXTLP,0))
array.set(arrayYSTLP, 0, array.get(arrayYTLP,0))
else if(array.get(arrayXSTLP,0) <= array.get(arrayXTLP,1))
if((array.get(arrayYSTLP,0) > array.get(arrayYSTLP,1) and array.get(arrayYTLP,0) < array.get(arrayYSTLP,1)) or (array.get(arrayYSTLP,0) < array.get(arrayYSTLP,1) and array.get(arrayYTLP,0) > array.get(arrayYSTLP,1)))
drawLineSTLP := 4
array.unshift(arrayXSTLP,array.get(arrayXTLP,0))
array.unshift(arrayYSTLP,array.get(arrayYTLP,0))
else if((array.get(arrayYSTLP,0) > array.get(arrayYSTLP,1) and array.get(arrayYTLP,0) > array.get(arrayYSTLP,0)) or (array.get(arrayYSTLP,0) < array.get(arrayYSTLP,1) and array.get(arrayYTLP,0) < array.get(arrayYSTLP,0)))
drawLineSTLP := 3
_max = math.min(array.get(arrayYSTLP,0),array.get(arrayYSTLP,1))
_min = math.max(array.get(arrayYSTLP,0),array.get(arrayYSTLP,1))
_max_idx = 0
_min_idx = 0
for i = 1 to array.size(arrayXTLP)
if(array.get(arrayXSTLP,0) >= array.get(arrayXTLP,i))
break
if(_min > array.get(arrayYTLP,i))
_min := array.get(arrayYTLP,i)
_min_idx := array.get(arrayXTLP,i)
if(_max < array.get(arrayYTLP,i))
_max := array.get(arrayYTLP,i)
_max_idx := array.get(arrayXTLP,i)
if(array.get(arrayYSTLP,0) > array.get(arrayYSTLP,1))
array.unshift(arrayXSTLP,_min_idx)
array.unshift(arrayYSTLP,_min)
else if(array.get(arrayYSTLP,0) < array.get(arrayYSTLP,1))
array.unshift(arrayXSTLP,_max_idx)
array.unshift(arrayYSTLP,_max)
array.unshift(arrayXSTLP,array.get(arrayXTLP,0))
array.unshift(arrayYSTLP,array.get(arrayYTLP,0))
if(f_resInMinutes() < f_tfRes(customTF,f_resInMinutes()))
if(array.get(arrayYSTLP,0) == array.get(arrayYTLP,0) and array.get(arrayXSTLP,0) != array.get(arrayXTLP,0))
array.set(arrayXSTLP, 0, array.get(arrayXTLP,0))
drawLineSTLP := 9
if(f_resInMinutes() <= f_tfRes(customTF,f_resInMinutes()))
if(drawLineSTLP == 2 or drawLineSTLP == 9)
if(array.size(arrayLineSTLP) >0)
line.set_xy2(array.get(arrayLineSTLP,0),array.get(arrayXSTLP,0),array.get(arrayYSTLP,0))
else
array.unshift(arrayLineSTLP,line.new(array.get(arrayXSTLP,1),array.get(arrayYSTLP,1),array.get(arrayXSTLP,0),array.get(arrayYSTLP,0), color = colorSTLP,xloc = xloc.bar_time))
else if(drawLineSTLP == 4)
array.unshift(arrayLineSTLP,line.new(array.get(arrayXSTLP,1),array.get(arrayYSTLP,1),array.get(arrayXSTLP,0),array.get(arrayYSTLP,0), color = colorSTLP,xloc = xloc.bar_time))
else if(drawLineSTLP == 3)
array.unshift(arrayLineSTLP,line.new(array.get(arrayXSTLP,2),array.get(arrayYSTLP,2),array.get(arrayXSTLP,1),array.get(arrayYSTLP,1), color = colorSTLP,xloc = xloc.bar_time))
array.unshift(arrayLineSTLP,line.new(array.get(arrayXSTLP,1),array.get(arrayYSTLP,1),array.get(arrayXSTLP,0),array.get(arrayYSTLP,0), color = colorSTLP,xloc = xloc.bar_time))
else if(drawLineSTLP == 5)
if(array.size(arrayLineSTLP) >0)
line.set_xy2(array.get(arrayLineSTLP,0),array.get(arrayXSTLP,1),array.get(arrayYSTLP,1))
else
array.unshift(arrayLineSTLP,line.new(array.get(arrayXSTLP,2),array.get(arrayYSTLP,2),array.get(arrayXSTLP,1),array.get(arrayYSTLP,1), color = colorSTLP,xloc = xloc.bar_time))
array.unshift(arrayLineSTLP,line.new(array.get(arrayXSTLP,1),array.get(arrayYSTLP,1),array.get(arrayXSTLP,0),array.get(arrayYSTLP,0), color = colorSTLP,xloc = xloc.bar_time))
///////////////////////Other//////////////////////////////////
if(f_resInMinutes() <= f_tfRes(customTF,f_resInMinutes()))
if(showSTLP)
if(showLabel and (barstate.islast or barstate.islastconfirmedhistory))
texLabel = f_resInMinutes() == f_tfRes(customTF,f_resInMinutes()) ? f_resFromMinutes(f_resInMinutes()) : f_resFromMinutes(f_tfRes(customTF,f_resInMinutes()))
label.set_xy(labelTF,array.get(arrayXSTLP,0),array.get(arrayYSTLP,0))
label.set_text(labelTF,texLabel)
label.set_style(labelTF,array.get(arrayYSTLP,0) < array.get(arrayYSTLP,1) ? label.style_label_upper_right : label.style_label_lower_right)
if(not showTLP)
arrayLineTemp := array.copy(arrayLineTLP)
for itemArray in arrayLineTemp
if(line.get_x1(itemArray) < array.get(arrayXSTLP,0))
line.delete(itemArray)
array.remove(arrayLineTLP,array.indexof(arrayLineTLP, itemArray))
//Inside Bars - Outside Bars
insideBar() => ISB and high <= high and low >= low ? 1 : 0
outsideBar() => OSB and (high > high and low < low ) ? 1 : 0
//Inside and Outside Bars
barcolor(insideBar() ? color.new(colorISB,0) : na )
barcolor(outsideBar() ? color.new(colorOSB,0) : na )
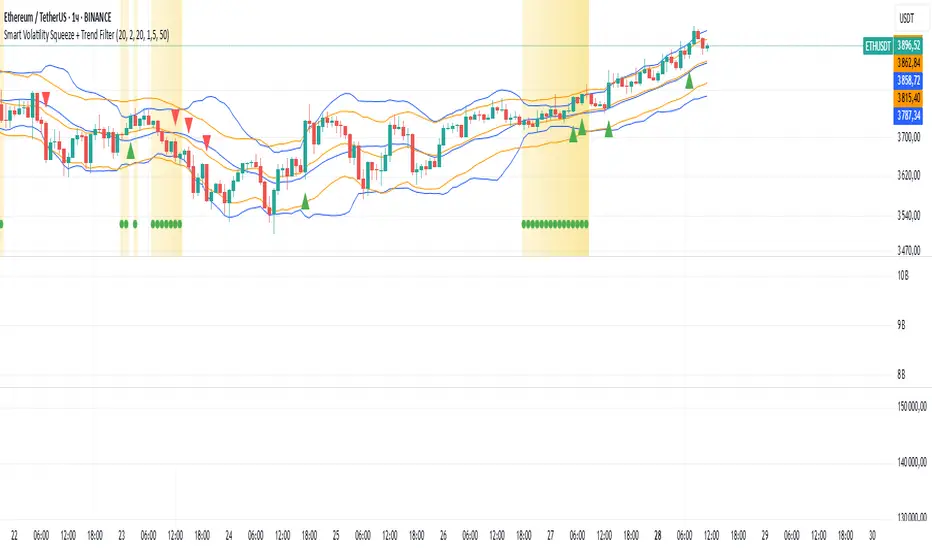
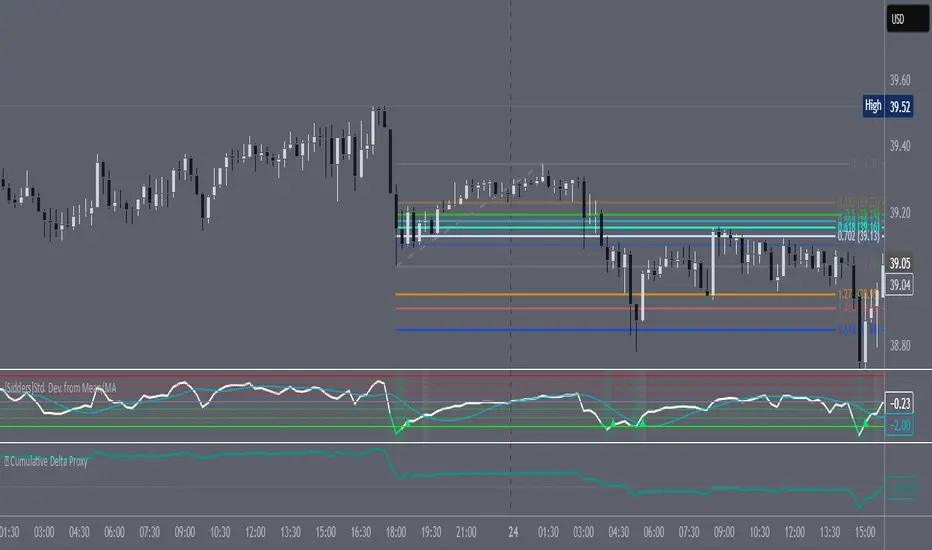
Smart Volatility Squeeze + Trend Filter📌 Purpose
This indicator detects volatility squeeze conditions when Bollinger Bands contract inside Keltner Channels and signals potential breakout opportunities.
It also includes an optional EMA-based trend filter to align signals with the dominant market direction.
🧠 How It Works
1. Squeeze Condition
Bollinger Bands (BB): Length = 20, StdDev = 2.0 (default)
Keltner Channels (KC): EMA Length = 20, ATR Multiplier = 1.5 (default)
Squeeze ON: Occurs when BB Upper < KC Upper and BB Lower > KC Lower (low volatility zone).
2. Breakout Signals
Long Breakout: Price crosses above BB Upper after squeeze.
Short Breakout: Price crosses below BB Lower after squeeze.
3. Trend Filter (optional)
EMA(50) used to confirm breakout direction:
Long signals allowed only if price > EMA(50)
Short signals allowed only if price < EMA(50)
Toggle Use Trend Filter to enable/disable.
4. Visual & Alerts
Green circle at chart bottom indicates Squeeze ON.
Green/Red triangles mark breakouts.
Background gradually brightens during squeeze buildup.
Alerts available for long and short breakouts.
📈 How to Use
Look for Squeeze ON → then wait for breakout arrows.
Trade in breakout direction, preferably with trend filter ON.
Works best on higher timeframes (1h, 4h, D) and trending markets.
Markets: Crypto, Forex, Stocks — effective in volatile assets.
⚙️ Inputs
BB Length / StdDev
KC EMA Length / ATR Multiplier
Use Trend Filter
Trend EMA Length
⚠️ Disclaimer
This script is for educational purposes only. It does not constitute financial advice.
Always test thoroughly before live trading.
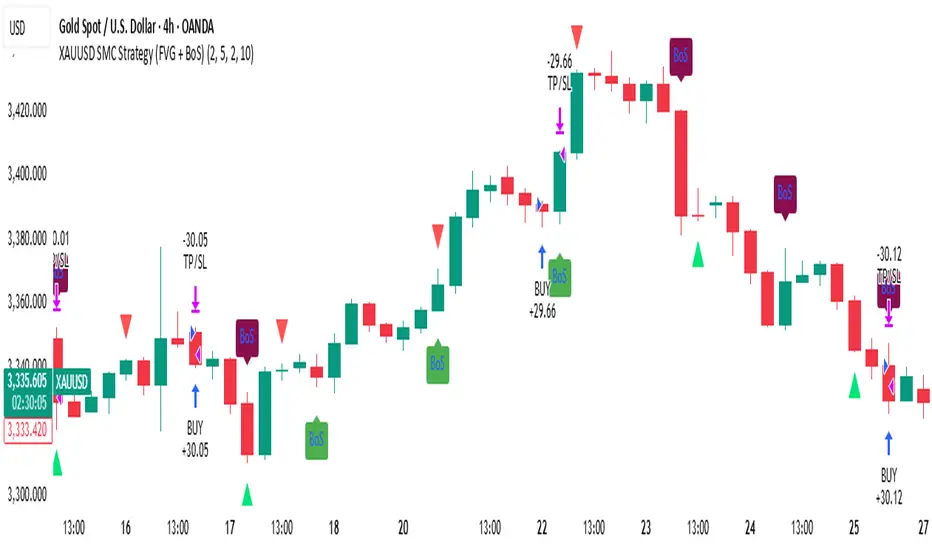
XAUUSD SMC Strategy (FVG + BoS)This advanced TradingView strategy is built for serious traders who follow Smart Money Concepts (SMC), with a special focus on Fair Value Gaps (FVG) and Break of Structure (BoS). The script automates trade entries and visual signals based on clean price action, while also allowing for performance backtesting through the built-in Strategy Tester.
The purpose of this script is to combine high-probability SMC signals with a clear and flexible backtest engine. Traders can visually confirm institutional moves (like imbalances and structure breaks) while simultaneously analyzing strategy performance, risk-reward, and execution logic — all from one chart.
⚙️ Key Features
FVG Detection: Automatically identifies bullish and bearish fair value gaps, highlighting imbalance zones between institutional buying and selling activity.
Break of Structure (BoS): Clearly shows bullish and bearish structure breaks, helping traders confirm directional bias and spot trend shifts with clarity.
Trade Execution Logic: Designed with actual strategy.entry() and strategy.exit() functions, this script simulates trades using risk-controlled logic with stop loss and take profit targeting.
Spaced Signal Visualization: Avoids chart clutter by spacing FVG and BoS signals, making the visual output clean and readable — even on fast-moving charts like XAUUSD.
Risk-Reward Customization: Easily set your own risk:reward ratio and stop-loss buffer, ensuring each trade is simulated according to your personal strategy or trading plan.
Cool-Down System: Add a delay between trades using the “Bars Between Trades” setting to prevent overtrading during volatile periods.
Live and Historical Insights: Signals appear in real-time, while also being plotted historically — making it easy to scroll back and study how the market behaved under this logic.
Fully Editable Parameters: Customize FVG size, structure lookback, spacing intervals, and more to fit your unique interpretation of SMC methodology.
🧠 How It Works
This strategy combines two key concepts:
FVG (Fair Value Gaps): Price zones where the market moved too quickly and left an imbalance between buyers and sellers. These gaps often act as magnets for price or areas of reversal.
BoS (Break of Structure): Points where the price breaks through a significant high or low, indicating a potential shift in market direction.
When both FVG and BoS align under certain conditions — and the cooldown requirement is satisfied — the strategy places a trade. A take profit and stop loss are automatically applied based on your inputs.
📈 Practical Use Cases
Trend Confirmation: Use BoS signals to validate trend continuation trades, especially when FVG confirms the imbalance.
Reversal Zones: Spot potential turning points when price fills an FVG and breaks previous structure in the opposite direction.
Backtest SMC Logic: Validate your theory by testing this strategy over historical XAUUSD data using real stop loss / take profit logic.
Refine Entry Timing: Study how structure breaks and FVGs align in different timeframes to improve entry precision.
💡 Best For
Traders learning or mastering Smart Money Concepts
Price action purists who avoid indicators
XAUUSD scalpers, day traders, or swing traders
Strategy developers who want visual + backtested confirmation
📌 Notes
The default strategy places trades every 10 candles to ensure the engine runs — replace this with your refined FVG + BoS logic as needed.
Works best on Gold (XAUUSD) 4H, 1H, or 15m timeframes depending on volatility and structure spacing.
🔒 Disclaimer
This strategy is for educational purposes only. It does not constitute financial advice. Always test and validate any trading logic before applying it to a live market. Trading carries risk — use proper risk management.
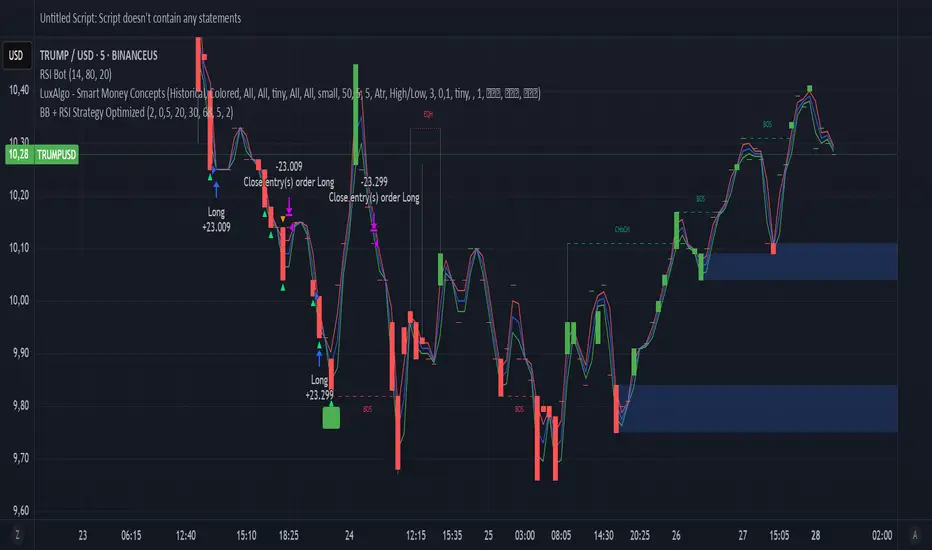
BB + RSI Strategy Optimized✅ Pine Script Version 5
✅ Complete Strategy: Long + Short
✅ Automatic Entry and Exit
✅ Visual Signals: Buy/Sell, Short/Cover
✅ Trailing Take Profit
✅ Progressive
William's Accelerator Oscillator (AC) - Log-ScaledA 5-34-5 MACD histogram, aka William's Accelerator Oscillator, scaled to log-price.
Useful for seeing the change in the speed of the momentum, particularly within the log-scaled AO. Works better than the original (non log) AC for long-term and volatile price action which exhibits logarithmic growth trends.

William's Awesome Oscillator (AO) - Log-scaledA 5-34-5 MACD plotted as a histogram, aka William's Awesome Oscillator (AO), scaled to log price.
Useful for finding momentum divergences in volatile and long-term price charts which show logarithmic trends. As you can see compared to the original (not log) AO indicator, it follows the momentum on the log-scaled price chart much more closely.
🧠 Blackbox Alpha v6 (Buy/Sell Only)Blackbox Alpha v6 Strategy – Institutional-Grade Intraday Trading
Overview:
The Blackbox Alpha v6 is a precision-engineered intraday trading strategy inspired by the world's top 0.1% traders — including philosophies from Jim Simons, Mark Minervini, Stefan Salomon, and Stanley Druckenmiller. It is designed to deliver ultra-high-probability Buy/Sell signals by using a multi-layered confirmation model that runs entirely in the background. Only confirmed signals appear on the chart – no noise, no clutter.
🔍 Core Strategy Logic
This strategy generates a Buy or Sell entry only when all of the following conditions are met:
✅ Trend Confirmation
EMA 20 > EMA 50 (bullish trend)
ADX > 20 (trend strength)
RSI confirms momentum direction
📊 Volume Validation
Volume spike above 20-period average × multiplier
Volume Climax (highest volume in last 10 candles)
Relative Volume Index (RVI) > 1.5
🎯 Price Structure + Pattern Recognition
Price near Fibonacci retracement zones (0.382 for Buy, 0.618 for Sell)
Bullish/Bearish engulfing candle pattern as trigger
🧠 Institutional Bias
Price must be above Anchored VWAP (Buy) or below (Sell)
Must be within predefined order block zones (smart money behavior)
📈 Signal Behavior
Buy Signal: Only appears when all trend, volume, price action, and institutional filters confirm.
Sell Signal: Same logic, mirrored for bearish market conditions.
Visualization: Minimalist – only Buy (green triangle) and Sell (red triangle) arrows.
🧪 Backtest Engine
Fully integrated with strategy.entry, strategy.close, stop and limit execution logic
User-configurable stop-loss and take-profit in %
Optimized for 15m, 1h, and 1D charts
🚀 Performance Philosophy
Rather than generating many signals, this strategy targets very selective, high-probability trades with asymmetric reward-to-risk opportunities — exactly like institutional traders and quant funds.
Ideal for traders seeking signal precision > signal frequency.

30M Scalping Strategy with Debug LogsWhat’s changed
Spot‑only: all short logic removed—only long entries and exits are generated.
Logging: uses log.info() to send entry/exit details (timestamp, price, ATR, RSI) to the Pine Logs console.
Clean & concise: core scalp logic (EMAs, RSI, MACD, volume, ATR SL/TP) remains intact.

NAIFCHART_Fresh Algo v24# NAIFCHART Fresh Algo v24: Advanced Multi-Mode Trading System Analysis
I recently discovered this sophisticated trading system through the active community at t.me and wanted to share a detailed analysis of the NAIFCHART Fresh Algo v24 indicator. This represents an advanced evolution of multi-component trading systems that adapts to various market conditions through sophisticated operational configurations and enhanced analytical capabilities.
## Primary Signal Generation Framework
The Fresh Algo v24 operates through two fundamental signal generation approaches that accommodate different market perspectives and trading philosophies. The Trending Signals Mode serves as the primary trend-following mechanism, combining Wave Trend Oscillator analysis with Supertrend directional signals and Squeeze Momentum breakout detection. This mode incorporates ADX filtering that requires values exceeding 20 to ensure sufficient trend strength exists before signal activation, making it particularly effective during sustained directional market movements where momentum persistence creates profitable trading opportunities.
The Contrarian Signals Mode provides an alternative approach targeting reversal opportunities through extreme market condition identification. This mode activates when the Wave Trend Oscillator reaches critical threshold levels, specifically when readings surpass 65 indicating potential bearish reversal conditions or drop below 35 suggesting bullish reversal opportunities. This methodology proves valuable during overextended market phases where mean reversion becomes statistically probable.
## Advanced Filtering Mechanisms
The system incorporates multiple sophisticated filtering mechanisms designed to enhance signal quality and reduce false positive occurrences. The High Volume Filter requires volume expansion confirmation before signal activation, utilizing exponential moving average calculations to ensure institutional participation accompanies price movements. This filter substantially improves signal reliability by eliminating low-conviction breakouts that lack adequate volume support from professional market participants.
The Strong Filter provides additional trend confirmation through 200-period exponential moving average analysis. Long position signals require price action above this benchmark level, while short position signals necessitate price action below it. This ensures strategic alignment with longer-term trend direction and reduces the probability of trading against major market movements that could invalidate shorter-term signals.
## Cloud Filter Configuration System
The Fresh Algo v24 offers four distinct cloud filter configurations, each optimized for specific trading timeframes and market approaches. The Smooth Cloud Filter utilizes the mathematical relationship between 150-period and 250-period exponential moving averages, providing stable trend identification suitable for position trading strategies. This configuration generates signals exclusively when price action aligns with cloud direction, creating a more deliberate but highly reliable signal generation process.
The Swing Cloud Filter employs modified Supertrend calculations with parameters specifically optimized for swing trading timeframes. This filter achieves optimal balance between responsiveness and stability, adapting effectively to medium-term price movements while filtering excessive market noise that typically affects shorter-term analytical systems.
For active intraday traders, the Scalping Cloud Filter utilizes accelerated Supertrend calculations designed to capture rapid trend changes effectively. This configuration provides enhanced signal generation frequency suitable for compressed timeframe strategies. The advanced Scalping+ Cloud Filter incorporates Hull Moving Average confirmation, delivering maximum responsiveness for ultra-short-term trading while maintaining signal quality through additional momentum validation processes.
## Specialized Assistant Functionality
The system includes two distinct assistant modes that provide supplementary market analysis capabilities. The Trend Assistant Mode activates advanced cloud analysis overlays that display dynamic support and resistance zones calculated through adaptive volatility algorithms. These levels automatically adjust to current market conditions, providing visual guidance for identifying trend continuation patterns and potential reversal areas with mathematical precision.
The Trend Tracker Mode concentrates on long-term trend identification by displaying major exponential moving averages with color-coded fill areas that clarify directional bias. This mode maintains visual simplicity while providing comprehensive trend context evaluation, enabling traders to quickly assess broader market direction and align shorter-term strategies accordingly.
## Dynamic Risk Management System
The integrated risk management system automatically adapts across all operational modes, calculating stop loss and take profit targets using Average True Range multiples that adjust to current market volatility. This approach ensures consistent risk parameters regardless of selected operational mode while maintaining relevance to prevailing market conditions.
Stop loss placement occurs at 3x ATR distance from entry points, while three progressive take profit targets establish at 1x, 2x, and 3x ATR multiples respectively. The system automatically updates these levels upon trend direction changes, ensuring current market volatility influences all risk calculations and maintains appropriate risk-reward ratios throughout trade management.
## Comprehensive Market Analysis Dashboard
The sophisticated dashboard provides real-time market analysis including volatility measurements, institutional activity assessment, and multi-timeframe trend evaluation across five-minute through four-hour periods. This comprehensive market context assists traders in selecting appropriate operational modes based on current market characteristics rather than relying exclusively on historical performance data.
The multi-timeframe analysis ensures mode selection considers broader market context beyond the primary trading timeframe, improving overall strategic alignment and reducing conflicts between different temporal market perspectives. The dashboard displays market state classification, volatility percentages, institutional activity levels, current trading session information, and trend pressure indicators.
## Enhanced Trading Assistants
The Fresh Algo v24 includes specialized trading assistant features that complement the primary signal generation system. The Reversal Dot functionality identifies potential reversal points through Wave Trend Oscillator analysis, displaying small circles when crossover conditions occur at extreme levels. These reversal indicators provide early warning signals for potential trend changes before they appear in the primary signal system.
The Dynamic Take Profit Labels feature automatically identifies optimal profit-taking opportunities through RSI threshold analysis, marking potential exit points at 70, 75, and 80 levels for long positions and 30, 25, and 20 levels for short positions. This automated profit management system helps traders optimize exit timing without requiring constant manual monitoring.
## Advanced Alert System
The comprehensive alert system accommodates all operational modes while providing granular notification control for various signal types and risk management events. Traders can configure separate alerts for normal buy signals, strong buy signals, normal sell signals, strong sell signals, stop loss triggers, and individual take profit target achievements.
Cloud crossover alerts notify traders when trend direction changes occur, providing early indication of potential strategy adjustments. The alert system includes detailed trade setup information, timeframe data, and relevant entry and exit levels, ensuring traders receive complete context for informed decision-making.
## Technical Foundation Architecture
The Fresh Algo v24 combines multiple proven technical analysis components including Wave Trend Oscillator for momentum assessment, Supertrend for directional bias determination, Squeeze Momentum for volatility analysis, and various exponential moving averages for trend confirmation. Each component contributes specific market insights while the unified system provides comprehensive market evaluation through their mathematical integration.
The multi-component approach reduces dependency on individual indicator limitations while leveraging the analytical strengths of each technical tool. This creates a robust analytical framework capable of adapting to diverse market conditions through appropriate mode selection and parameter optimization.
## Implementation Strategy Considerations
Successful implementation requires careful matching of operational modes to prevailing market conditions and individual trading objectives. Trending modes demonstrate optimal performance during directional markets with sustained momentum characteristics, while contrarian modes excel during range-bound or overextended market conditions where reversal probability increases.
The cloud filter configurations provide varying degrees of confirmation strength, with smoother settings reducing false signal occurrence at the expense of some responsiveness to price changes. Traders must balance signal quality against signal frequency based on their risk tolerance and available trading time.
## Community Development Framework
This indicator represents ongoing community-driven development through the team at t.me where continuous discussions focus on optimization techniques, practical implementation strategies, and real-world performance feedback. The collaborative development approach ensures the system remains relevant to actual market conditions while incorporating insights from active professional traders.
Understanding these operational modes and their specific applications enables traders to optimize the NAIFCHART Fresh Algo v24 system according to their particular requirements while maintaining consistent risk management principles across all market environments. The inherent flexibility in the multi-mode design allows strategic adaptation to changing market conditions without requiring complete methodology overhaul.
---
*Source: NAIFCHART Fresh Algo v24 available through t.me

Supertrend Strategy (5m)📊 Strategy: Buy/Sell Based on EMA Crossover (5-Minute Timeframe)
📊 Стратегия: Buy/Sell по пересечению EMA (5 минут)

RSI + VWAP Strategy by vipindaskr🔍 This script combines RSI and VWAP for intraday trend-based entries.
✅ *Buy Signal:*
- Price above VWAP
- RSI > 60
- Green background + up triangle shown
❌ *Sell Signal:*
- Price below VWAP
- RSI < 40
- Red background + down triangle shown
📈 Ideal for Nifty 50 intraday traders using 5-minute chart.
Developed by vipindaskr 💻
