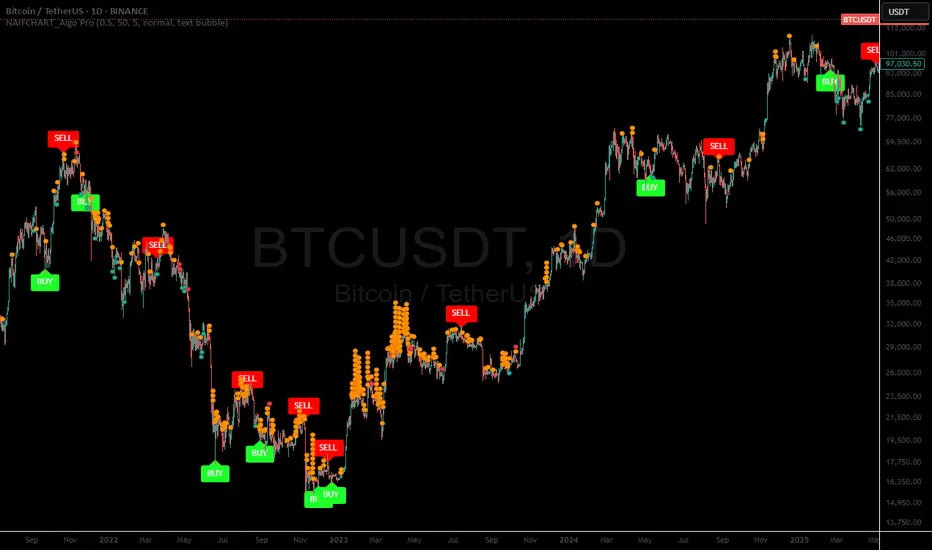
NAIFCHART_Algo Pro# NAIFCHART Algo Pro: Advanced Candlestick Pattern Analysis Tool
## Overview
The NAIFCHART Algo Pro indicator represents an innovative approach to candlestick pattern analysis, combining traditional engulfing patterns with advanced technical filters. This indicator was developed and shared by the trading community at t.me focusing on high-probability reversal signals through multi-layered confirmation.
## Core Algorithm Components
**Candle Stability Index**: Measures the ratio between candle body and total range (including wicks). Higher values indicate more decisive price action with stronger conviction. Default setting of 0.5 ensures only stable, well-formed candles generate signals, filtering out indecisive market conditions.
**RSI Momentum Filter**: Utilizes 14-period RSI with customizable threshold (default 50) to confirm overbought/oversold conditions. Buy signals require RSI below the threshold, while sell signals need RSI above the inverse threshold, ensuring momentum alignment with pattern direction.
**Candle Delta Analysis**: Examines price movement over a specified period (default 5 candles) to confirm directional bias. This filter ensures patterns occur after meaningful price moves in the opposite direction, increasing reversal probability.
**Engulfing Pattern Recognition**: Identifies classic bullish and bearish engulfing formations where the current candle completely engulfs the previous candle's body, indicating potential momentum shift.
## Signal Generation Logic
**Buy Signal Criteria**:
- Bullish engulfing pattern formation
- Candle stability above threshold level
- RSI below specified threshold (oversold condition)
- Price decrease over the delta length period
- Confirmed bar state (prevents repainting)
**Sell Signal Criteria**:
- Bearish engulfing pattern formation
- Candle stability above threshold level
- RSI above inverse threshold (overbought condition)
- Price increase over the delta length period
- Confirmed bar state (prevents repainting)
## Advanced Features
**Signal Filtering**: Optional "Disable Repeating Signals" feature prevents signal clusters by blocking consecutive identical signals. This enhances chart clarity and reduces noise in trending markets where multiple patterns might form in sequence.
**Visual Customization**: Multiple label styles including text bubbles, triangles, and arrows with full color customization. Label sizes range from tiny to huge, allowing adaptation to different chart configurations and personal preferences.
**Alert Integration**: Built-in alert system notifies traders immediately when buy or sell conditions are met, enabling real-time trade execution without constant chart monitoring.
## Implementation Strategy
**Timeframe Optimization**: The indicator performs effectively across multiple timeframes, with higher timeframes (1-hour and above) providing more reliable signals due to reduced market noise. Shorter timeframes require more conservative position sizing due to increased false signal probability.
**Parameter Tuning**:
- Increase Candle Stability Index for more selective signals in volatile markets
- Adjust RSI threshold based on market conditions (lower for trending markets, higher for ranging conditions)
- Modify Candle Delta Length for different trend confirmation periods
**Risk Management**: Combine signals with proper stop loss placement below/above the engulfing pattern's extreme points. Consider position sizing based on pattern strength and overall market context.
## Market Application
**Reversal Trading**: Primary application focuses on identifying high-probability reversal points after extended moves. The multi-filter approach significantly reduces false signals compared to basic engulfing pattern strategies.
**Trend Confirmation**: In trending markets, signals align with pullback completion, providing optimal entry points for trend continuation strategies. The RSI and delta filters help identify temporary retracements rather than trend changes.
**Range Trading**: Within sideways markets, signals often occur near range boundaries, providing effective support and resistance bounce opportunities with clearly defined risk parameters.
## Performance Optimization
**Market Selection**: The indicator performs best on liquid instruments with clear candlestick formations. Avoid extremely volatile or thin markets where patterns may be less reliable.
**Session Timing**: Consider trading sessions when focusing on specific markets. Major session overlaps often provide clearer patterns due to increased participation and volume.
**Confirmation Techniques**: While the indicator provides internal filtering, additional confirmation through volume analysis, key support/resistance levels, or broader market context enhances signal reliability.
## Community Resources
Access ongoing strategy discussions and optimization techniques through the source community at t.me where traders share practical applications and parameter adjustments for different market conditions.
The collaborative environment provides valuable insights into optimal settings for various trading styles and market environments, along with real-time feedback on signal quality and performance.
## Conclusion
NAIFCHART Algo Pro offers a sophisticated approach to candlestick pattern trading through intelligent filtering and confirmation mechanisms. The indicator's strength lies in combining traditional pattern recognition with modern technical analysis filters, creating a robust framework for identifying high-probability reversal opportunities.
Success with this tool requires understanding each component's role in signal generation and adapting parameters to match current market conditions and personal trading style. The community-driven development ensures practical relevance and ongoing refinement based on real trading experiences.
Practice with demo accounts to develop familiarity with signal timing and optimal parameter settings before live implementation. The indicator's systematic approach provides clear entry signals while maintaining flexibility for different risk management and position sizing strategies.
Bitcon
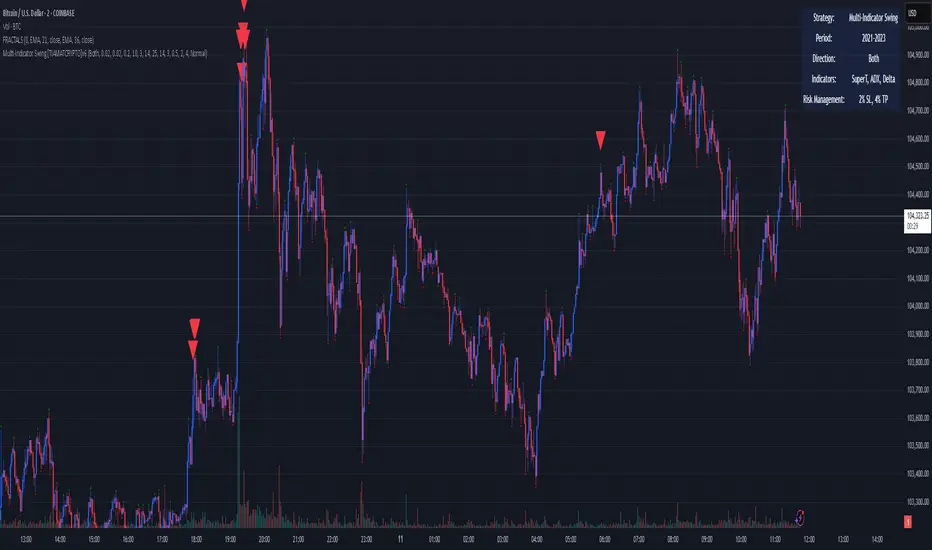
Multi-Indicator Swing [TIAMATCRYPTO]v6# Strategy Description:
## Multi-Indicator Swing
This strategy is designed for swing trading across various markets by combining multiple technical indicators to identify high-probability trading opportunities. The system focuses on trend strength confirmation and volume analysis to generate precise entry and exit signals.
### Core Components:
- **Supertrend Indicator**: Acts as the primary trend direction filter with optimized settings (Factor: 3.0, ATR Period: 10) to balance responsiveness and reliability.
- **ADX (Average Directional Index)**: Confirms the strength of the prevailing trend, filtering out sideways or choppy market conditions where the strategy avoids taking positions.
- **Liquidity Delta**: A volume-based indicator that analyzes buying and selling pressure imbalances to validate trend direction and potential reversals.
- **PSAR (Optional)**: Can be enabled to add additional confirmation for trend changes, turned off by default to reduce signal filtering.
### Key Features:
- **Flexible Direction Trading**: Choose between long-only, short-only, or bidirectional trading to adapt to market conditions or account restrictions.
- **Conservative Risk Management**: Implements fixed percentage-based stop losses (default 2%) and take profits (default 4%) for a positive risk-reward ratio.
- **Realistic Backtesting Parameters**: Includes commission (0.1%) and slippage (2 points) to reflect real-world trading conditions.
- **Visual Signals**: Clear buy/sell arrows with customizable sizes for easy identification on the chart.
- **Information Panel**: Dynamic display showing active indicators and current risk settings.
### Best Used On:
Daily timeframes for cryptocurrencies, forex, or stock indices. The strategy performs optimally on assets with clear trending behavior and sufficient volatility.
### Default Settings:
Optimized for conservative position sizing (5% of equity per trade) with an initial capital of $10,000. The backtesting period (2021-2023) provides a statistically significant sample of varied market conditions.
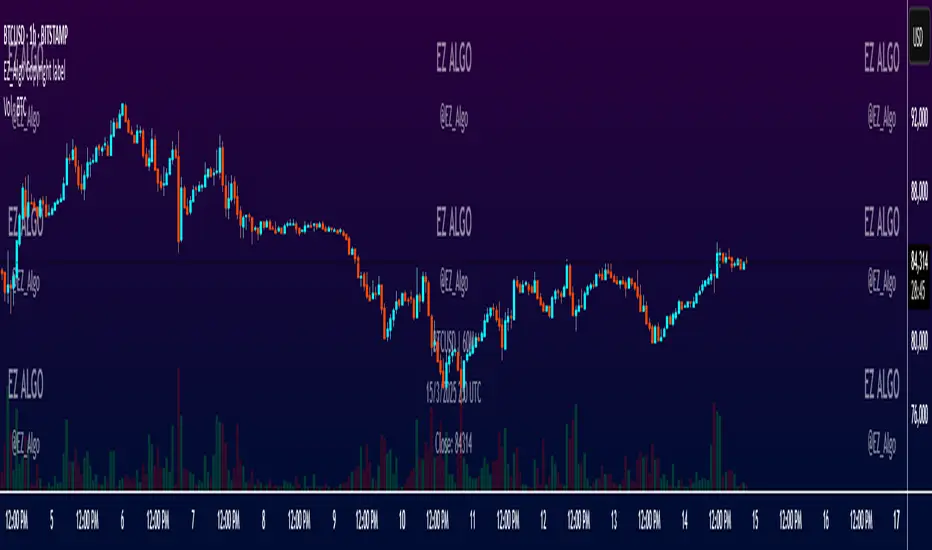
EZ_Algo Copyright label
This script overlays a fully adjustable watermark on your chart, featuring:
A bold Main Title (e.g., your brand or name) and Subtitle (e.g., a tagline or ID).
Optional extras like a copyright notice, logo symbol, warning message, and chart info (symbol, timeframe, timestamp, or close price).
A subtle repeating overlay pattern to deter theft.
Flexible positioning, sizing, and color options to match your vib
e
It’s built for traders who want to protect their charts and make them stand out, all in a few clicks.
How to Use It
Add to Chart: Click "Add to Chart" and watch the default watermark appear (e.g., "EZ ALGO" at the top).
Customize It:
Main Title: Set your brand (e.g., "EZ ALGO") under "Main Title". Tweak color, size, and alignment.
Subtitle: Add a tagline (e.g., "Algo Trading") and trader ID (e.g., "@EZ_Algo
") with matching style options.
Text Opacity: Adjust "Text Opacity" in "Appearance" to control title and subtitle transparency (0 = solid, 100 = invisible).
Chart Info: Toggle "Show Chart Info" to display symbol and timestamp, or add "Show Close Price" for extra data.
Extras: Enable "Show Copyright" for a © notice, "Show Logo" for a symbol (e.g., ★), or "Show Warning" to shout "DO NOT COPY".
Overlay Pattern: Turn on "Show Overlay Pattern" to repeat a phrase (e.g., "EZ Algo") across the chart.
Positioning: Pick vertical/horizontal spots (top, middle, bottom; left, center, right) or try "Randomize Main Position" for a surprise placement.
Appearance: Set a "Background Color" and "Background Opacity" for the watermark’s backdrop.
Cell Size: Adjust "Cell Width (%)" and "Cell Height (%)" to resize the watermark (0 = auto-fit).
Apply & Share: Hit "OK" to save settings, then screenshot or share your branded chart with confidence!
Tips
Use a semi-transparent background (e.g., 50 opacity) to keep the chart readable.
Experiment with "Randomize Main Position" for a dynamic look.
Pair a bold logo with a faint overlay pattern for max branding power.
Credits
Inspired by @KristaKT
thanks for the great ideas!
Enjoy marking your charts with flair and protection! Questions? Drop a comment below.
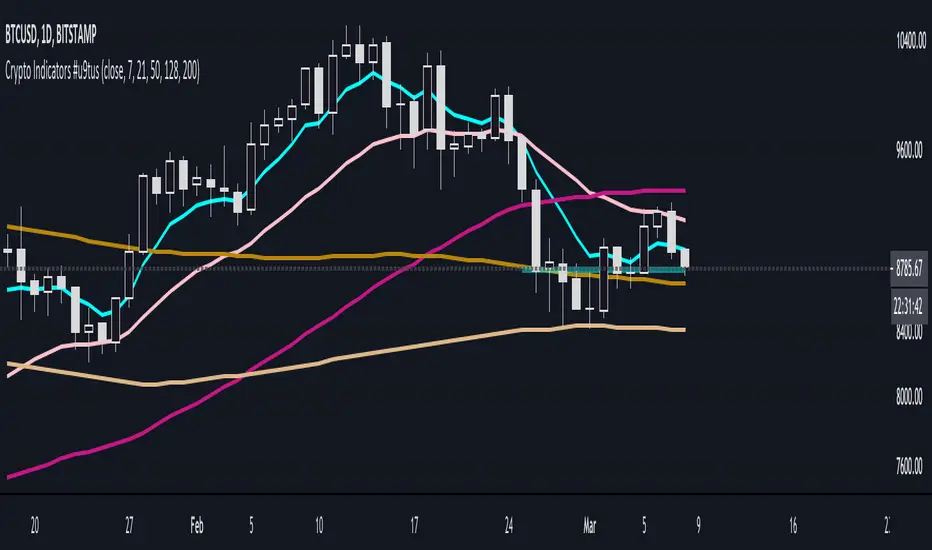
Crypto Indicators #u9tusA set of low timeframe (LTF), medium timeframe (MTF), and high timeframe (HTF) indicators for use in crypto currencies / bitcoin.
Traditionally the 10, 20, 50, 100, and 200 SMAs are used in TA. With cryptos, I've found that the 8 EMA, 21, 55, and 128 SMAs backtest better, while no change in length was necessary for the 200. I wanted to combine all these into one indicator to easily add them to a chart layout, hence this script.
You can customize the length of each MA to your liking in the settings, or accept the defaults.
LTF Indicators:
8 EMA in blue hues, medium line stroke.
MTF Indicators:
21, 55 SMA in purple hues, medium line stroke.
HTF Indicators:
128, 200 SMA in yellow hues, thick line stroke.
Defaults are for daily timeframes and lower; suggest changing up the intervals for weekly and monthly to:
21 -> 30
55 -> 50
128 -> 100
$BTC, $ETH, #ALTS
twitter.com
(c) @jhaurawachsman 20190515