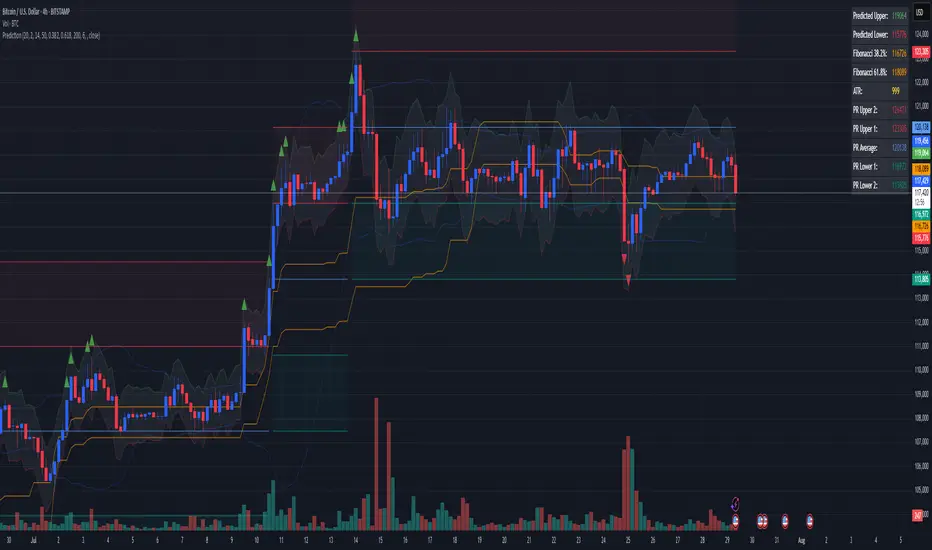
Combined Predictive Indicator### Combined Predictive Zones & Levels
This indicator is a powerful hybrid tool designed to provide a comprehensive map of potential future price action. It merges two distinct predictive models into a single, cohesive view, helping traders identify key levels of support, resistance, and areas of high confluence.
#### How It Works: Two Models in One
This script is built on two core components that you can use together or analyze separately:
**Part 1: Classic Range & Fibonacci Prediction**
This model uses classic technical analysis principles to project a potential range for the upcoming price action.
* **Highest High / Lowest Low:** It identifies the significant trading range over a user-defined lookback period.
* **Fibonacci Levels:** It automatically plots key Fibonacci retracement levels (e.g., 38.2% and 61.8%) within this range, which often act as critical support or resistance.
* **ATR & Average Range:** It calculates a "predicted" upper and lower boundary based on the average historical range and current volatility (ATR).
**Part 2: Advanced Predictive Ranges (Self-Adjusting Channels)**
This is a dynamic model that creates adaptive support and resistance zones based on a smoothed average price and volatility.
* **Dynamic Average:** It uses a unique moving average that only adjusts when the price moves significantly, creating a stable baseline.
* **ATR-Based Zones:** It projects multiple levels of support (S1, S2) and resistance (R1, R2) around this average, which widen and narrow based on market volatility. These zones often signal areas where price might stall or reverse.
#### Key Features:
* **Hybrid Model for Confluence:** The true power of this indicator lies in finding where the levels from both models overlap. A Fibonacci level aligning with a Predictive Range support zone is a much stronger signal.
* **Comprehensive Data Table:** A clean, on-chart table displays the precise values of all key predictive levels, allowing for quick reference and precise trade planning.
* **Multi-Timeframe (MTF) Capability:** The Advanced Predictive Ranges can be calculated on a higher timeframe, giving you a broader market context.
* **Fully Customizable:** All lengths, multipliers, and levels for both models are fully adjustable in the settings to fit any asset or trading style.
* **Clear Visuals:** All zones and levels are color-coded for intuitive and easy-to-read analysis.
#### How to Use:
1. Look for areas of **confluence** where multiple levels from both models cluster together. These are high-probability zones for price reactions.
2. Use the Predictive Range zones (S1/S2 and R1/R2) as potential targets for trades or as areas to watch for entries and exits.
3. Pay attention to the on-chart table for exact price levels to set limit orders or stop-losses.
**Disclaimer:** This script is an analytical tool for educational purposes and should not be considered financial advice. All trading involves risk. Past performance is not indicative of future results. Always use this indicator as part of a comprehensive trading strategy with proper risk management.
Feedback is welcome! If you find this tool useful, please leave a like.
Bolingerband
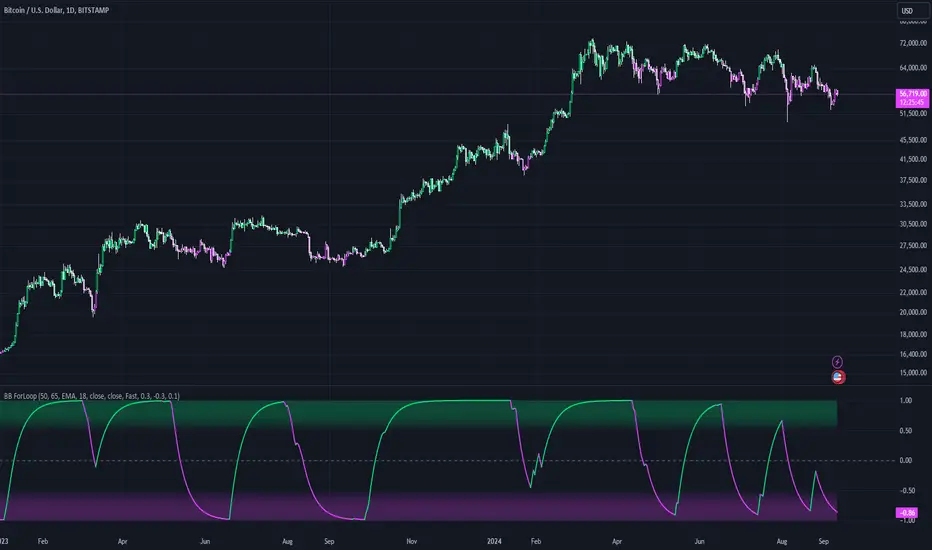
Bollinger Bands ForLoopBollinger Bands ForLoop
OVERVIEW
BB ForLoop is an improved version of Bollinger Bands it is designed to calculate an array of values 1 or -1 depending if soruce for calculations is above or below basis.
It takes avereage of values over a range of lengths, providing trend signals smothed based on various moving averages in order to get rid of noise.
It offers flexibility with different signal modes and visual customizations.
TYPE OF SIGNALS
-FAST (MA > MA or MA > 0.99)
-SLOW (MA > 0)
-THRESHOLD CROSSING (when cross above/below treshold set independently for both directions)
-FAST THRESHOLD (when there's change in signal by set margin e.g (0.4 -> 0.2) means bearsih when FT is set to 0.1, when MA is > 0.99 it will signal bullish, when MA < -0.99 it will signal bearish)
Generaly Lime color of line indicates Bullish, Fuchsia indicates Bearish.
This colors are not set in stone so you can change them in settings.
-Bullish Trend, line color is lime
-Bearish Trend, line color is fuchsia
Credit
Idea for this script was from one of indicators created by tradingview.sweetlogin.com
Warning
Be careful when using this indicator especialy combining DEMA with FT (Fast Treshold).
This indicator can be really noisy depending on the settings, signal mode so it should be used preferably as a part of an strategy not as a stand alone indicator
Remember the lower the timeframe you use the more noise there is.
No single indicator should be used alone when making investment decisions.
Bollinger Band + Mid BandBollinger Band + Mid Band
This indicator combines the classic Bollinger Bands with enhanced customization options, allowing traders to fine-tune the settings according to their specific strategies.
Key Features:
Moving Average Flexibility: Choose between Simple Moving Average (SMA), Exponential Moving Average (EMA), or Weighted Moving Average (WMA) as the central basis for the Bollinger Bands. This flexibility allows you to align the indicator with your preferred method of trend analysis.
Dual Band Deviation: The indicator includes two sets of upper and lower bands based on different standard deviation multipliers. This helps you analyze both the tightness of price action and potential breakout zones.
Customizable Colors: The mid-band, upper bands, and lower bands can be fully customized in terms of color, allowing you to personalize the visual representation of the indicator on your charts.
Dynamic Transparency: The space between the outer Bollinger Bands can be filled with a customizable transparent color, making it easy to visualize price movements within the bands.
Alerts for Crossovers: Alerts are triggered whenever the price crosses above the upper band or below the lower band, giving you timely notifications of potential breakout or breakdown scenarios.
Overbought/Oversold Visualization: The background of the chart changes color when the price crosses above the upper band (indicating overbought conditions) or below the lower band (indicating oversold conditions), providing a visual cue to help you identify market extremes.
Labeling for Significant Events: Labels appear on the chart whenever the price crosses the upper or lower bands, helping you quickly identify key moments for further analysis.
This script is designed for traders who want to leverage Bollinger Bands in their technical analysis but require additional flexibility and customization options. Whether you're using it for trend analysis, volatility assessment, or identifying overbought and oversold conditions, this tool can be tailored to fit a wide variety of trading styles.
Usage:
Ideal for traders looking to enhance the standard Bollinger Bands with more dynamic and customizable features.
Suitable for any market, including stocks, forex, and cryptocurrencies.
Useful in identifying volatility squeezes, breakouts, and potential reversal points.
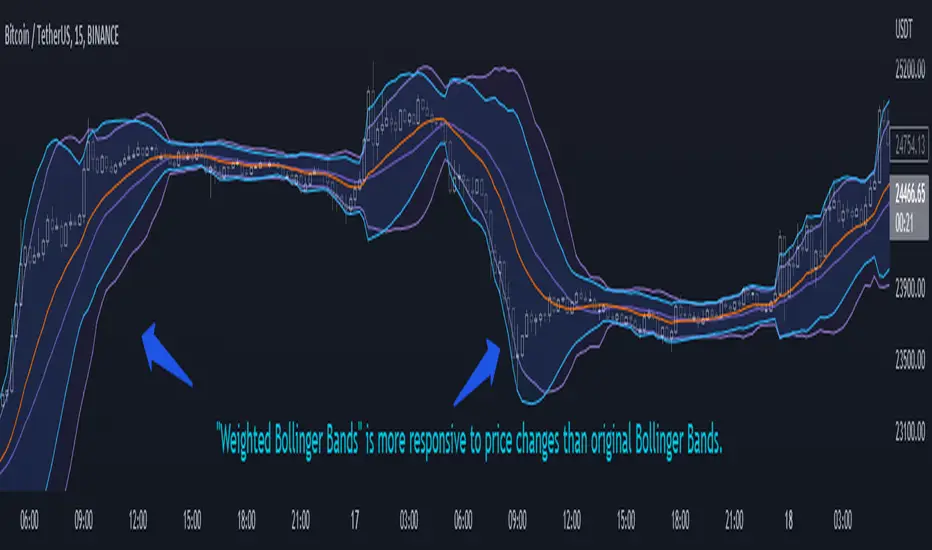
Weighted Bollinger Band (+ Logarithmic)ENG)
Weighted BB is more responsive to price changes than original Bollinger Bands.
the calculation formula uses a weighted method based on the current price.
Instead of using a standard deviation, I used a weighted standard deviation that weights the current price, and instead of a simple moving average, I used a weighted moving average.
Also included is a formula to log the Bollinger Bands for users who view charts on a logarithmic scale.
KOR)
원본 볼밴보다 가격변화에 대한 반응성이 높습니다.
계산식에는 현재가격에 가중을 주는 방식을 사용하였습니다.
표준편차를 사용하는 대신 저는 현재가격에 가중을 두는 가중표준편차를 사용하였고, 단순이동평균 대신 가중이동평균을 사용하였습니다.
또한 로그스케일로 차트를 보는 유저를 위해 볼린저밴드를 log화 하는 수식도 포함하였습니다.
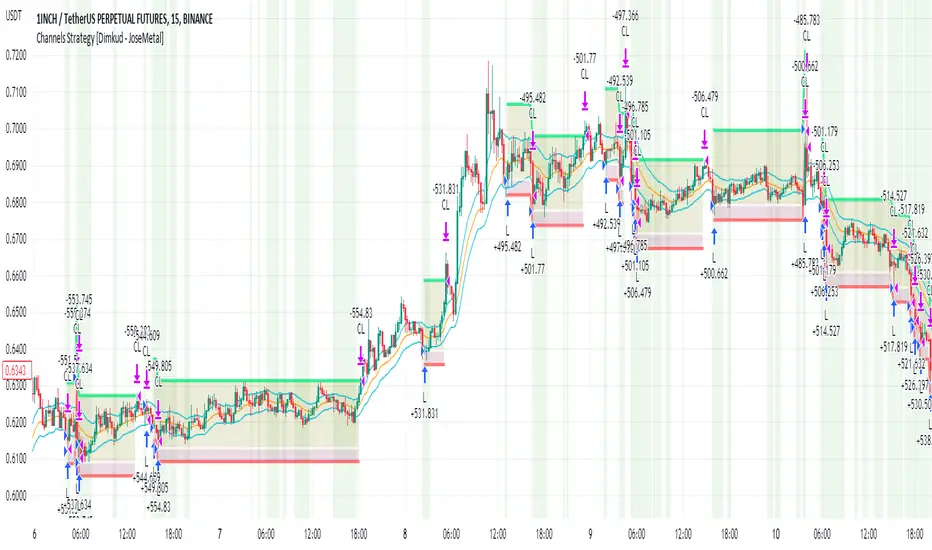
Channels Strategy [Dimkud]Channels trading Strategy. Based on "Channels Strategy" by JoseMetal.
To the original strategy added additional options and filters : Static SL/TP in percents (%), time delay between orders, ATR Filter, second Keltner Channel (Multi TimeFrame).
Interface translated to English.
Were good backtest results on many crypto tokens on 15m - 45m - 1h periods.
Mostly with configuration: Keltner Channel (optimise parameters for every token) + Static SL/TP (optimise values for every token) + "Enter Condition" = "Wick out of band".
The better is to optimise paramaters separately for Short and Long trading. And run two separate bots (in settings enable only Long or only Short.)
Tested on real automated trading on few online bot platforms. (3comm, revenuebot, veles).
Later I will make tutorial how to connect strategy to these platforms or contact me if you need help.
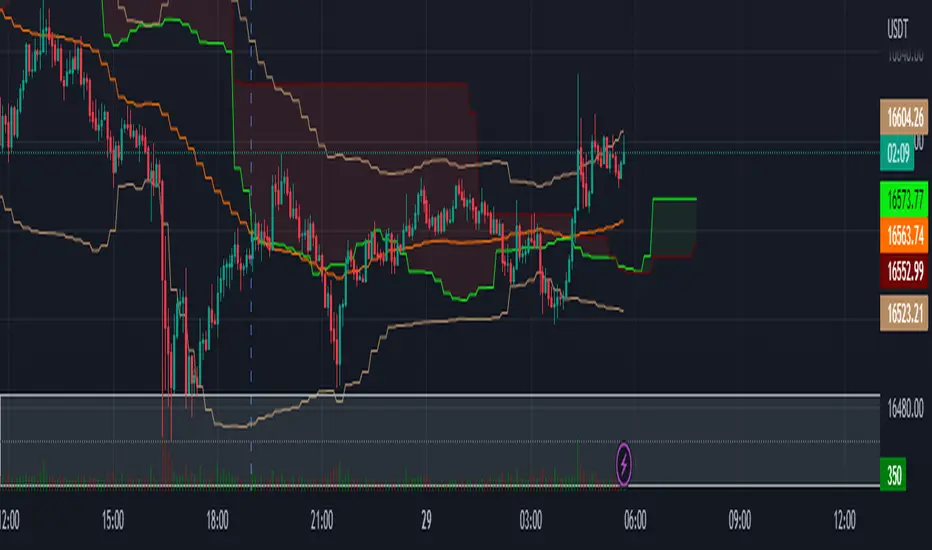
3 indicators in another time frame "3 indicators in another time frame"
1- In the indicator settings section, you can save and change another time period
2-For time frame changes, it should be calculated in minutes
3-Includes three performance indicators ( ichimoku , bollinger bans, pivot ) that are set to a 15-minute timeframe by default.
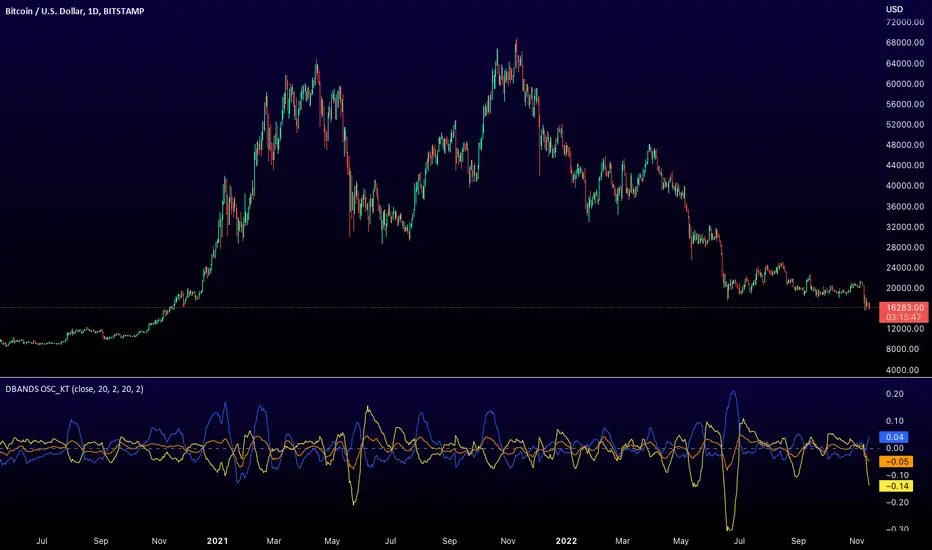
Distance Bands Oscillator_KT █ OVERVIEW
This tool is based on both Bollinger Bands and Keltner Channels, and measures 3 distances between the two, respectively.
Upper Kelt to Upper Bollinger Band
Lower Kelt to Lower Bollinger Band
Kelt Basis to Bollinger Basis Basis
Similar to the Band Width indicator, this can be used as a measure of volatility, and can be used to measure uptrend, downtrend and chop regions on a given chart.
Happy Trading,
ET
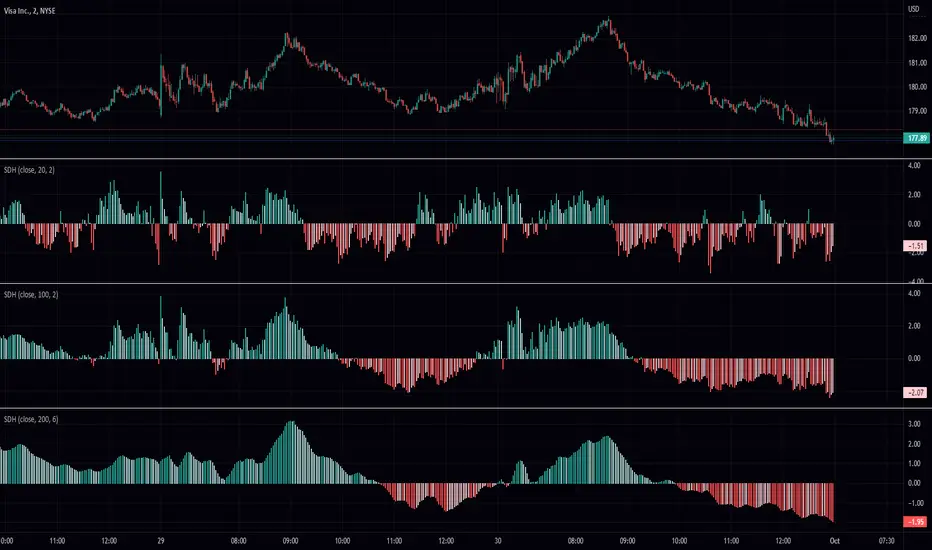
Standard Deviation Histogram (SDH)This script tells you what standard deviation the price is from the mean. Due to the limitations of the calculations this study only works for stocks. Further limitations include and inability to calculate past 10 deviation. I have added a smoothing feature and the ability to change the colors. Dont be afraid to change the style to line instead of a histogram. Enjoy!
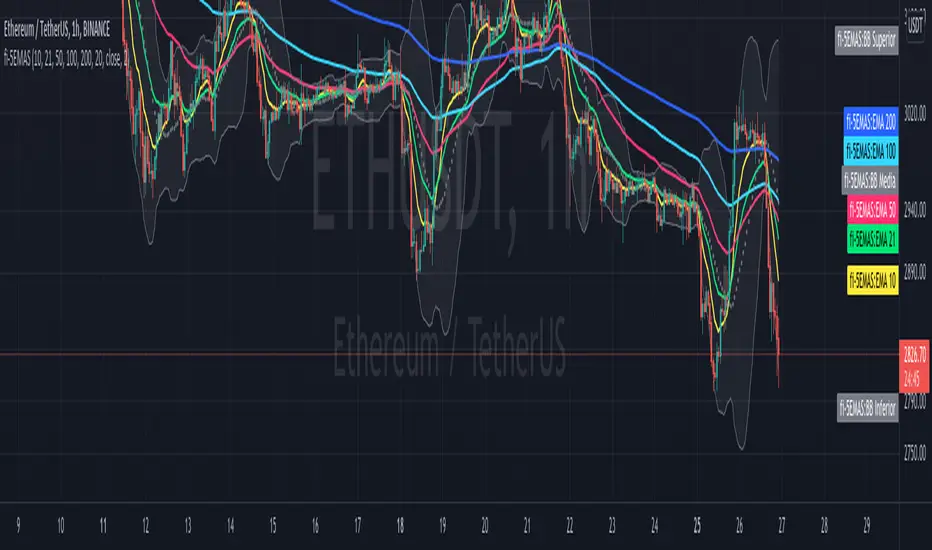
fi - 5EMA + BB - 5 emas en un mismo indicador junto con las bandas de bollinguer.
- Opcion de timeframe
- Actualizado a version 5
//Indicador adaptado a medida sobre "4EMA lines EMA Cross @Philacone + Bollinger Bands by Alessiof"
//Todos los méritos para Alessiof, muchas gracias!!!
Price Clouds (PS)Price could shows you dynamic support resistance levels. It also displays two bands (ie clouds) that show you where the trend is. If the price hits the bottom of the high band thats a buy and if it hits the top of the high band its a sell. During times of volatility the price can break support but you will find that the opposite band will work as the next level. I added tool tips for every option to help explain what everything does and I also left suggestions for other settings.
This works great on everything! That being said I have this setup in a general way that works really well for 20m forex. If you are scalping you might want to speed up the indicator. This is also true if you want go to the daily chart or above. Adjust the Stdev to match the market.. and I mean really play around with.. dont be shy! With all that out of the way this really will work out of the box. If you like this indicator its actually the same thing as my (PBS) but this one is an overlay on the chart. (Also as of publishing this script the code for this version is way cleaner. In fact I plan on replacing PBS with this as its base)
If you find this indicator is useful to you, Star it, Follow, Donate, Like and Share.
Your support is a highly motivation for me.

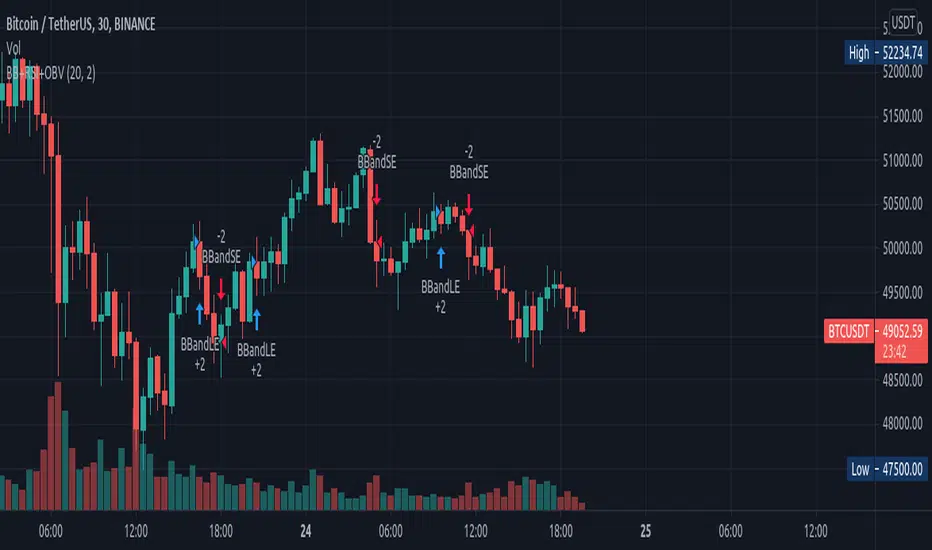
BB+RSI+OBVI use Bolinger Band and RSI and OBV
when Bolinger band midline cross and rsi is bigger than 50 and obv is going up i wrote this strategy to test this strategy
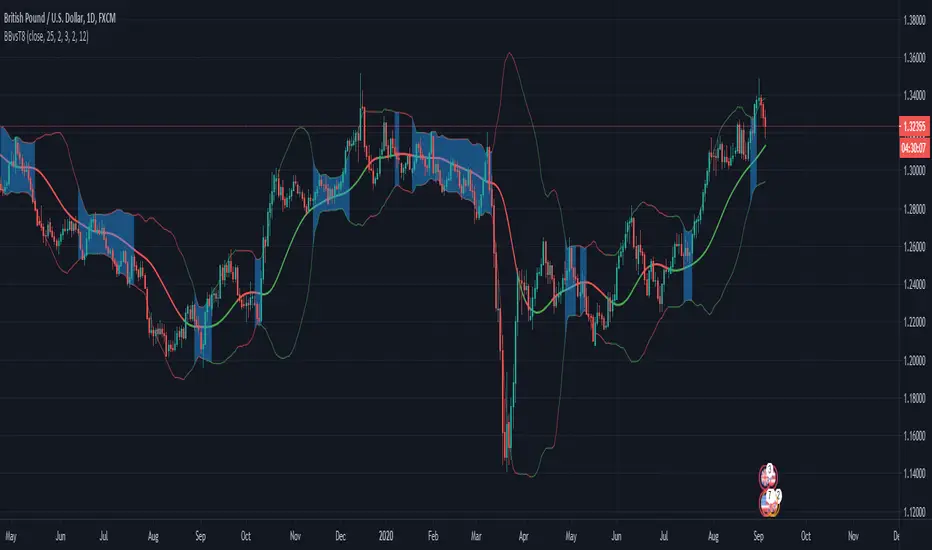
Bollinger Bands combined with Telson T8Indicator idea based on classic Bollinger bands and Telson T8 moving average.
The indicator detects Bollinger bands narrowing which should predict a move to a direction.
NOTE: You need to define in the indicator settings (Narrow percentage) the percentage between the upper and lower bands that would be highlighted.
For example: if you set 5%, the indicator will highlight the parts that the upper and lower bands are less than 5% compare the current price (usually close price, but you can define otherwise)
Use the Telson T8 to determinate the trend/direction of the move.
MultiTimeFrame Shifting Bollinger BandsJust 3 Bollinger Bands with different adjustable timeframes plus shifting (left/right) capability and non-integer deviation values.
I wrote this because I couldn't find the perfect BB indicator that matches my needs. Feel free to use it.
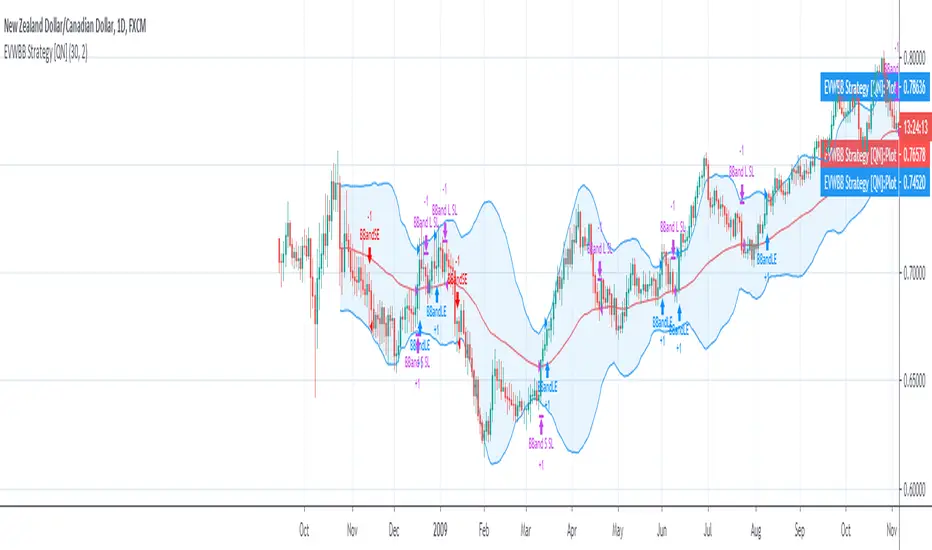
EVWBB Strategy [QuantNomad]It's my new strategy using EVWMA (Elastic Volume Weighted Moving Average).
Now I created a Bollinger Bands strategy where basis level is EVWMA.
It looks pretty interesting but you have to be careful with the entries/exits on the same bar, I'm using stop orders, so on big moves it happens pretty often.
In the next version, I will try to eliminate these issues.
Entry for this strategy happens when price crossover upper for long and lower for short. I exit both short and long on basis level.