(JS) VWAP BandsThis is a pretty simple script here - I took the VWAP and combined it with Bollinger Bands.
The bands can vary a lot based on chart resolution, so I wanted to make sure the resolution could be modified so you can use the resolution you're most comfortable with, or find the most success with.
Length:
Length of bars used to calculate the bands.
Standard Deviation Band 1-3:
There's three bands all together, this option allows you to modify the number of standard deviations per band.
VWAP Period:
This modifies when you want the VWAP to begin (Session, Week, Month, Year).
Offset:
This moves the VWAP and the bands the amount of bars you select, default is of course set to zero.
Source:
This selects the source of calculation, HLC/3 is the default VWAP calculation.
This is a pretty self explanatory script, I thought being able to see the standard deviations of the VWAP could prove to be useful - hope you all like it!
Bollingersband
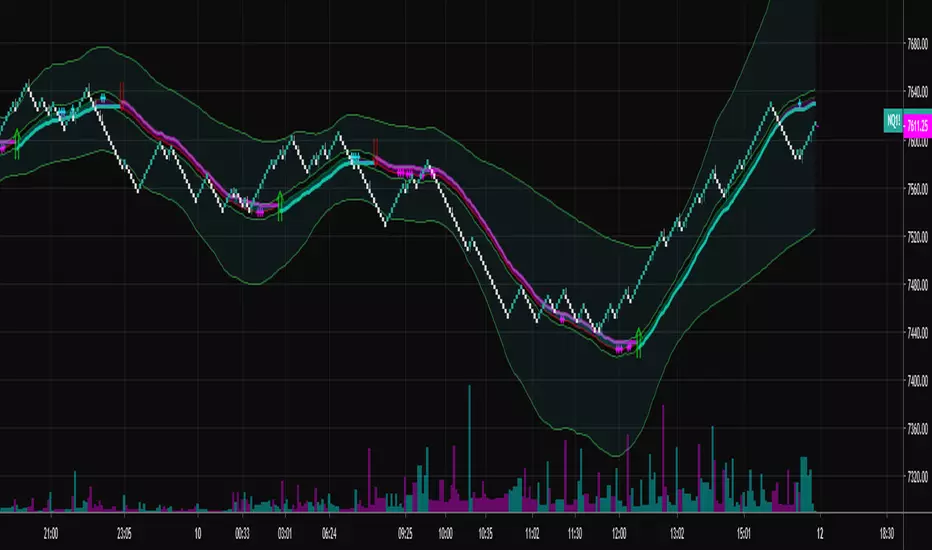
Super Moving Average
Plots one of several types of moving average types
Supports ATR/Kelter Channels
Supports Bollinger Bands
Velocity squeezes shown on the moving average to identify possible turning points
Supports ATR based stop for MA Trend Reversals
MA Trend reversal alert conditions
See related Moving Average Ribbon script.
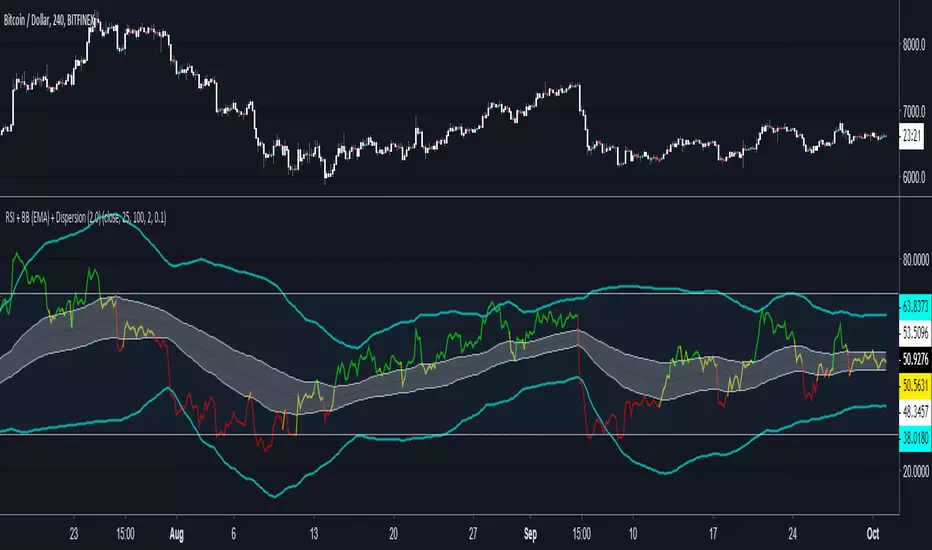
RSI + BB (EMA) + Dispersion (2.0)First version here
Initial data:
1) RSI
2) Bollinger Bands (Basis - EMA )
3) Dispersion (around basis)
Signal for purchase: RSI crosses the dispersion zone upwards
Signal for sale: RSI crosses the dispersion zone downwards
Buffer zone: white area, it is not recommended to make transactions.
--- Add ( 02.10.2018 )
1) RSI lines (overbought / oversold) = 70 / 30. Сan be changed in the settings.
2) Alerts:
• RSI line crossover Dispersion Zone (green)
• RSI line crossunder Dispersion Zone (red)