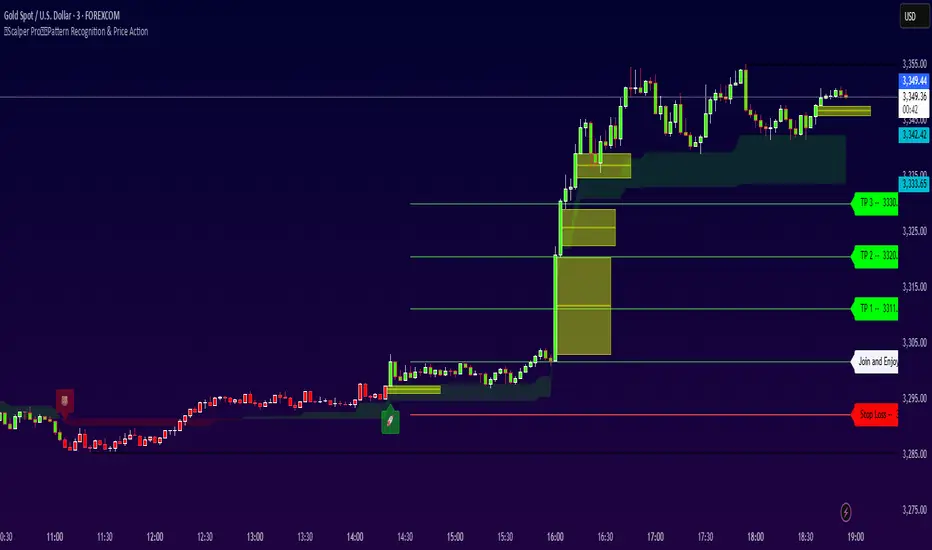
Scalper Pro Pattern Recognition & Price Action👑Scalper Pro®👑Pattern Recognition & Price Action
i.postimg.cc
Introducing the ultimate trading robot designed for serious investors! Our advanced bot analyzes market cycles, tracks targets, sets stop losses, and expertly manages your capital. With powerful algorithms and real-time insights, it identifies opportunities and delivers accurate signals, ensuring you never miss a market move. Take control of your trading strategy and maximize your profits with our cutting-edge technology. Join the future of trading today—your expert assistant is ready to help you succeed!
💡 This is not just another indicator — it's a complete trading assistant that identifies structure, signals strength, and simplifies decision-making.
🚀 Plug it into your TradingView chart today and start seeing the market in a whole new way.
💬 Need help with access, backtesting, or have any questions about our indicators?
Our support team is available 24/7 on Telegram.
Just reach out through the link below: 👉 t.me
Bot
RSI+BOLLINGER (LONG & SHORT)This indicator combines two of the most popular tools in technical analysis, the Relative Strength Index (RSI) and Bollinger Bands (BB), to generate both long (BUY) and short (SELL) trading signals.
Strategy:
Entries (Buy/Short): Entry signals are based on the RSI.
A BUY is suggested when the RSI crosses above an oversold level (default: 29), indicating a possible upward reversal.
A SHORT is suggested when the RSI crosses below an overbought level (default: 71), indicating a possible downward reversal.
Exits (Position Closure): Exit signals are based on Bollinger Bands.
A long position is closed when the price crosses below the upper Bollinger Band.
A short position is closed when the price crosses above the lower Bollinger Band.
Key Features:
Cascade Filter: Includes a smart filter that prevents opening new consecutive trades if the price hasn't moved significantly in favor of a new entry, optimizing signal quality.
Automation Alerts: Generates detailed alerts in JSON format for each event (buy, sell, close), designed for easy integration with trading bots and automated systems via webhooks.
Fully Configurable: All parameters of the RSI, Bollinger Bands, and strategy filters can be adjusted from the indicator’s settings menu.

UT Bot + LinReg Candles (Dual Sensitivity)
Script Description:
This indicator combines the popular UT Bot Alerts system with Linear Regression Candles (open source) for enhanced trend detection and trading signals in one singel script. The UT Bot features independent, then 2 x ATR sensitivity and periods controls for buy and sell signals, allowing you to fine-tune entries and exits to match your strategy. The script also overlays colored Linear Regression Candles with an optional signal line, helping you visually identify trend strength and direction. All calculations are performed on standard chart prices (no Heikin Ashi). Suitable for all asset classes and timeframes.
Eample setting for usdjpy 5 min chart for repeated buy and sell singnals based on trend:
BUY ATR period 300 multiplier 1
SELL ATR period 1 multiplier 2
Disclaimer:
This script is for informational and educational purposes only. It is not financial advice. Use at your own risk; the author assumes no responsibility for any trading results or losses.
Credits goes to to Ugurvu for linreg candles and quantnomad for UT Bot alerts that make this script possible.
Author: Patrick

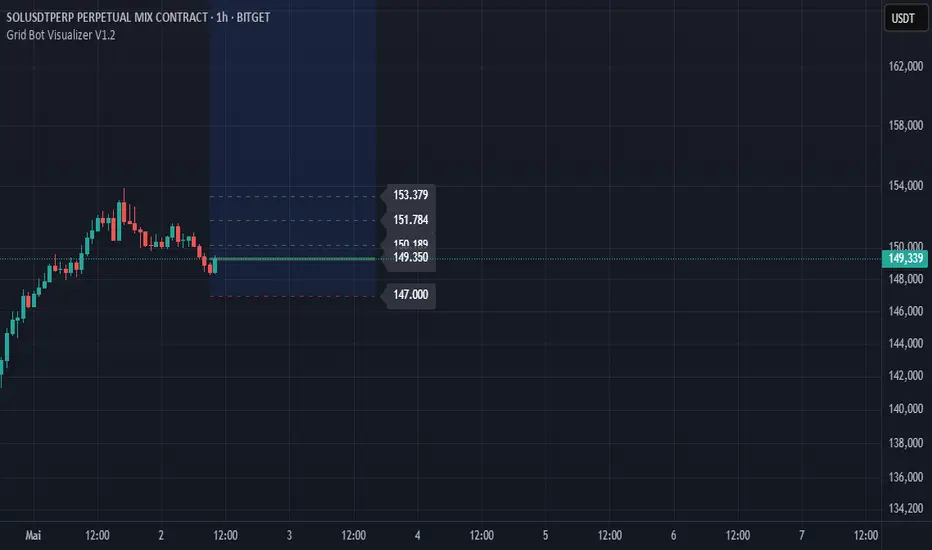
Grid Bot Visualizer V1
📊 Grid Bot Visualizer – V1
A dynamic and visual support tool for grid trading strategies.
🔧 Key Features
• Fixed grid levels based on a central entry price
• Customizable spacing, number of levels, and range
• Color-coded lines (🟢 green above, 🔴 red below)
• Expands automatically when price exceeds boundaries (within the defined box)
• Optional price labels shown outside the grid
• Grid visually framed by a blue box
• Vertical line to mark grid origin
• Built-in alert when price hits a grid level
⚙️ Use Case
Ideal for visualizing grid bot logic in volatile markets.
Monitor how price interacts with predefined zones.
✅ Alert Ready
Use alertcondition to get notified when a grid level is touched.
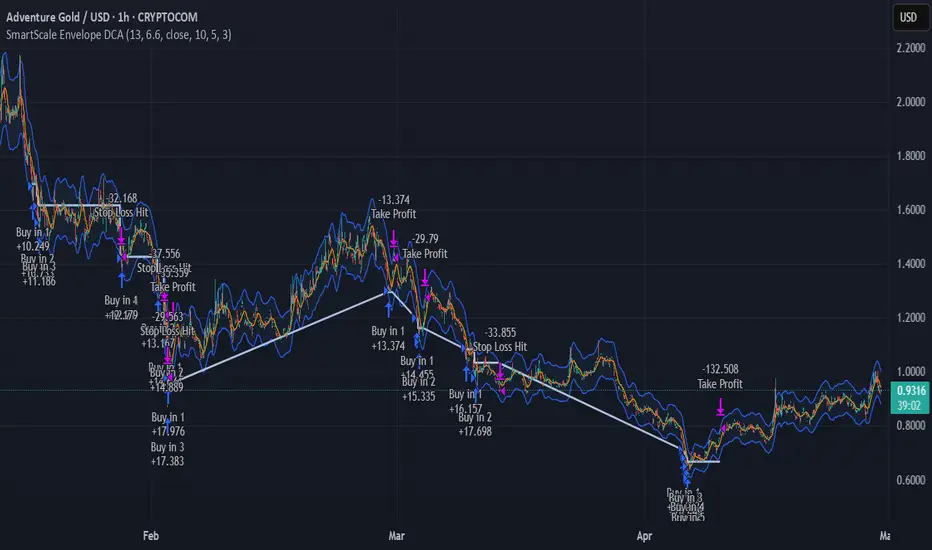
SmartScale Envelope DCA This is a Dollar-Cost Averaging (DCA) long strategy that buys when price dips below a moving average envelope and adds to the position in a stepwise, risk-controlled way. It uses up to 8 buy-ins, applies a cooldown between entries, and exits based on either a take profit from average entry price or a stop loss. Backtest range limits trades to the last 365 days for backtest control.
All input settings can and should be adjusted to the chart, as volatility in price action varies. Simply go into the inputs settings, and start from the top and move down to get better backtest results. Moving from the top down has been proven to give the best results. Then, move to properties and set your order size, pyramiding, and so on. It may be necessary to then fine tune your adjustments a second time to dial it in.
Works well on 1 hour time frames and in volatility.
Happy Trading!
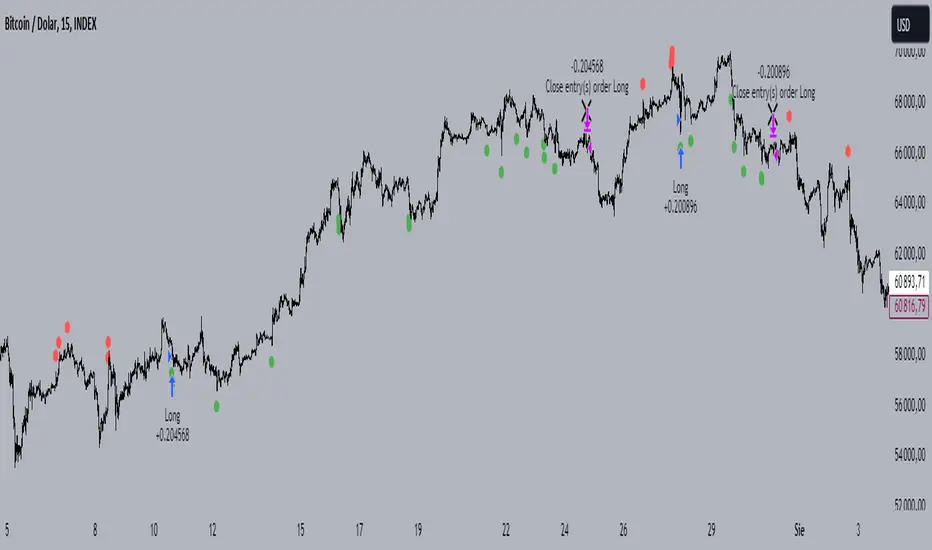
Rsi Long-Term Strategy [15min]Hello, I would like to present to you The "RSI Long-Term Strategy" for 15min tf
The "RSI Long-Term Strategy " is designed for traders who prefer a combination of momentum and trend-following techniques. The strategy focuses on entering long positions during significant market corrections within an overall uptrend, confirmed by both RSI and volume. The use of long-term SMAs ensures that trades are made in line with the broader market trend. The stop-loss feature provides risk management by limiting losses on trades that do not perform as expected. This strategy is particularly well-suited for longer-term traders who monitor 15-minute charts but look for substantial trend reversals or continuations.
Indicators and Parameters:
Relative Strength Index (RSI):
- The RSI is calculated using a 10-period length. It measures the magnitude of recent price changes to evaluate overbought or oversold conditions. The script defines oversold conditions when the RSI is at or below 30 and overbought conditions when the RSI is at or above 70.
Volume Condition:
-The strategy incorporates a volume condition where the current volume must be greater than 2.5 times the 20-period moving average of volume. This is used to confirm the strength of the price movement.
Simple Moving Averages (SMA):
- The strategy uses two SMAs: SMA1 with a length of 250 periods and SMA2 with a length of 500 periods. These SMAs help identify long-term trends and generate signals based on their crossover.
Strategy Logic:
Entry Logic:
A long position is initiated when all the following conditions are met:
The RSI indicates an oversold condition (RSI ≤ 30).
SMA1 is above SMA2, indicating an uptrend.
The volume condition is satisfied, confirming the strength of the signal.
Exit Logic:
The strategy closes the long position when SMA1 crosses under SMA2, signaling a potential end of the uptrend (a "Death Cross").
Stop-Loss:
A stop-loss is set at 5% below the entry price to manage risk and limit potential losses.
Buy and sell signals are highlighted with circles below or above bars:
Green Circle : Buy signal when RSI is oversold, SMA1 > SMA2, and the volume condition is met.
Red Circle : Sell signal when RSI is overbought, SMA1 < SMA2, and the volume condition is met.
Black Cross: "Death Cross" when SMA1 crosses under SMA2, indicating a potential bearish signal.
to determine the level of stop loss and target point I used a piece of code by RafaelZioni, here is the script from which a piece of code was taken
I hope the strategy will be helpful, as always, best regards and safe trades
;)
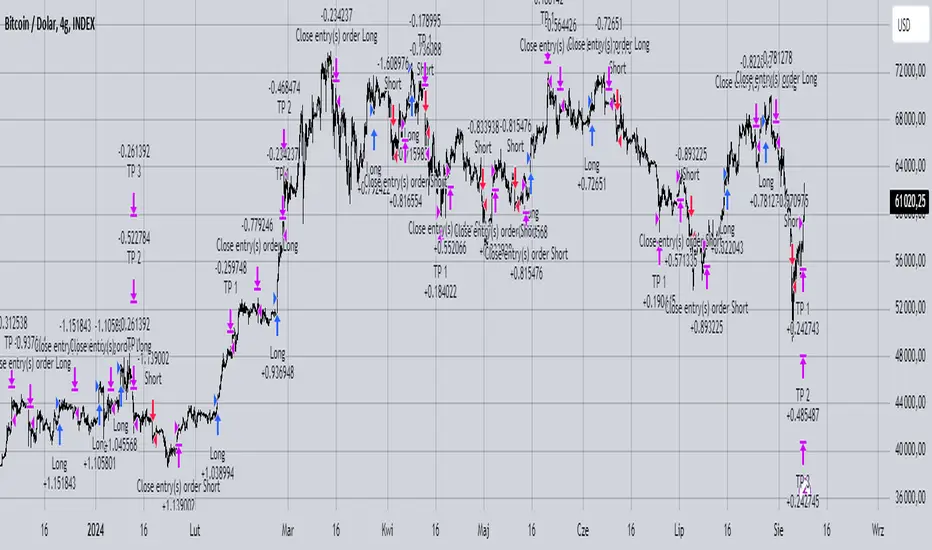
Quatro SMA Strategy [4h]Hello, I would like to present to you The "Quatro SMA" strategy
Strategy is based on four simple moving averages of different lengths and monitoring trading volume. The key idea is to identify strong market trends by comparing short-term moving averages with the long-term SMA. The strategy generates buy signals when all short-term SMAs are above the SMA(200) and the volume confirms the strength of the move. Similarly, sell signals are generated when all short-term SMAs are below the SMA(200), and the volume is sufficiently high.
The strategy manages risk by applying a stop loss and three different Take Profit levels (TP1, TP2, TP3), with varying percentages of the position closed at each level.
Each Take Profit level is triggered at a specific percentage gain, with the position being closed gradually depending on the achieved targets. The percentage of the position closed at each TP level is also defined by the user.
Indicators and Parameters:
Simple Moving Averages (SMA):
The script utilizes four simple moving averages with different lengths (4, 16, 32, 200). The first three SMAs (SMA1, SMA2, SMA3) are used to determine the trend direction, while the fourth SMA (with a length of 200) serves as a support/resistance line.
Volume:
The script monitors trading volume and checks if the current volume exceeds 2.5 times the average volume of the last 40 candles. High volume is considered as confirmation of trend strength.
Entry Conditions:
- Long Position: Triggered when SMA1 > SMA2 > SMA3, the closing price is above SMA(200), and the volume condition is met.
- Short Position: Triggered when SMA1 < SMA2 < SMA3, the closing price is below SMA(200), and the volume condition is met.
Exit Conditions:
- Long Position: Closed when SMA1 < SMA2 < SMA3 and the closing price is above SMA(200).
- Short Position: Closed when SMA1 > SMA2 > SMA3 and the closing price is below SMA(200).
to determine the level of stop loss and target point I used a piece of code by RafaelZioni, here is the script from which a piece of code was taken
I hope the strategy will be helpful, as always, best regards and safe trades
;)
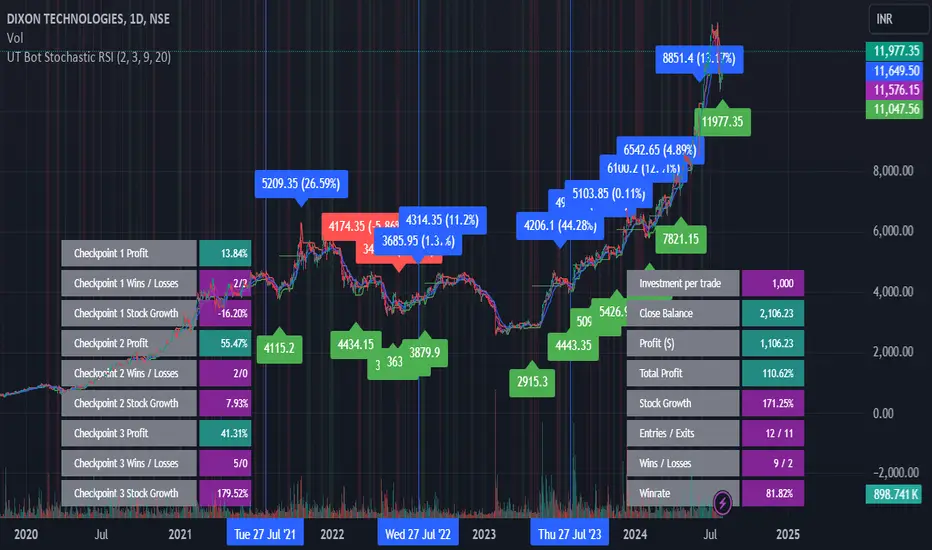
UT Bot Stochastic RSIUT Bot Stochastic RSI is a powerful trading tool designed to help traders identify potential buy and sell signals in the market. This indicator combines the Stochastic and RSI (Relative Strength Index) oscillators, two of the most popular and effective technical analysis tools, to provide a comprehensive view of market conditions.
The Stochastic oscillator is a momentum indicator that compares a security's closing price to its price range over a given time period. The RSI, on the other hand, is a momentum oscillator that measures the speed and change of price movements. By combining these two indicators, the UT Bot Stochastic RSI can help traders identify overbought and oversold conditions, as well as potential trend reversals.
The UT Bot Stochastic RSI also includes an ATR (Average True Range) trailing stop, which can be used to set stop-loss levels and manage risk. This feature is particularly useful in volatile markets, where price movements can be large and unpredictable.
In addition to its powerful technical analysis tools, the UT Bot Stochastic RSI also includes a backtesting feature, allowing traders to test their strategies on historical data. This can help traders identify the most effective settings for the indicator and improve their trading performance.
Overall, the UT Bot Stochastic RSI is a versatile and effective tool for traders of all levels, providing valuable insights into market conditions and helping to improve trading decisions
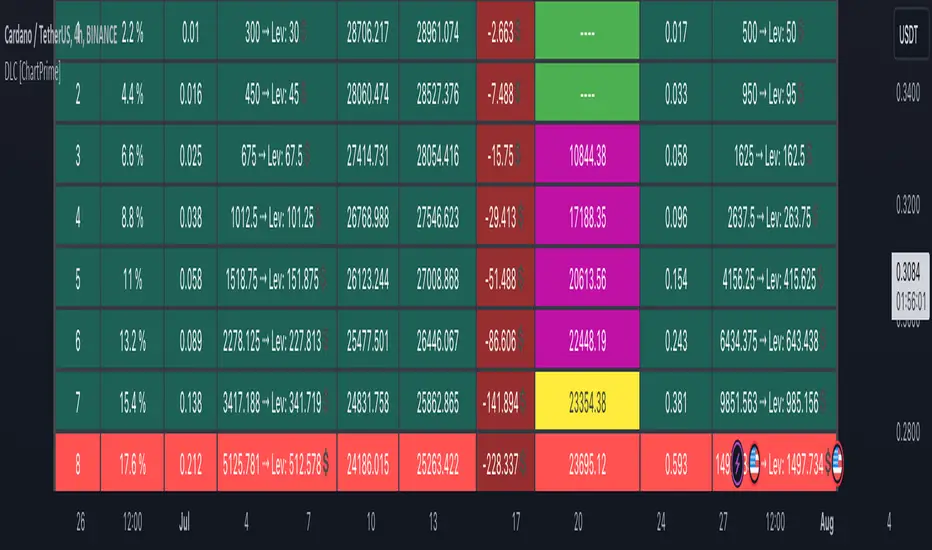
DCA Liquidation Calculation [ChartPrime]The DCA Liquidation Calculator is a powerful table indicator designed for both manual and bot-assisted traders who practice Dollar Cost Averaging (DCA). Its primary objective is to help traders avoid getting liquidated and make informed decisions when managing their positions. This comprehensive table indicator provides essential information to DCA traders, enabling them to plan their trades effectively and mitigate potential risks of liquidation.
Key Features:
Liquidation Price Awareness: The DCA Liquidation Calculator calculates and displays the liquidation price for each trade within your position. This critical information empowers traders to set appropriate stop-loss levels and avoid being liquidated in adverse market conditions, especially in leveraged trading scenarios.
DCA Recommendations: Whether you are executing DCA manually or using a trading bot, the DCA Liquidation Calculator offers valuable guidance. It suggests optimal entry prices and provides insights into the percentage deviation from the current market price, helping traders make well-timed and well-informed DCA decisions.
Position Sizing: Proper position sizing is essential for risk management. The DCA Liquidation Calculator helps traders determine the percentage of capital to allocate to each trade based on the provided insights. By using the recommended position sizing, traders can protect their capital and potentially maximize profits.
Profit and Loss Visualization: Gain real-time visibility into your Profit and Loss (PnL) with the DCA Liquidation Calculator. This feature allows you to monitor your trades' performance, enabling you to adapt your strategies as needed and make data-driven decisions.
Margin Call Indicators: Anticipating potential margin calls is crucial for maintaining a healthy trading account. The DCA Liquidation Calculator's smart analysis helps you identify and manage potential margin call situations, reducing the risk of account liquidation.
Capital Requirements: Before entering a trade, it's vital to know the required capital. The DCA Liquidation Calculator provides you with this information, ensuring you are adequately prepared to execute your trades without overextending your resources.
Maximum Trade Limit: Considering your available capital, the DCA Liquidation Calculator helps you determine the maximum number of trades you can enter. This feature ensures you maintain a disciplined and sustainable trading approach aligned with your financial capabilities.
Color-Coded Risk Indicators:
Green Liquidation Price Cell: Indicates that the position is considered safe from liquidation at the given parameters.
Yellow Liquidation Price Cell: Warns traders of potential liquidation risk. Exercise caution and monitor the trade closely to avoid undesirable outcomes.
Purple Liquidation Price Cell: Shows the liquidation price, but it does not necessarily indicate an imminent liquidation. Use this information to make prudent risk management decisions.
Red Row: Signals that the trade cannot be executed due to insufficient capital. Consider alternative strategies or ensure adequate capitalization before proceeding.
Settings explained:
In conclusion, the DCA Liquidation Calculator equips traders with essential tools to make well-calculated decisions, minimize liquidation risks, and optimize their Dollar Cost Averaging strategy. By offering comprehensive insights into your trading position, this indicator empowers you to navigate the markets with confidence and increase your potential for successful and sustainable trading.
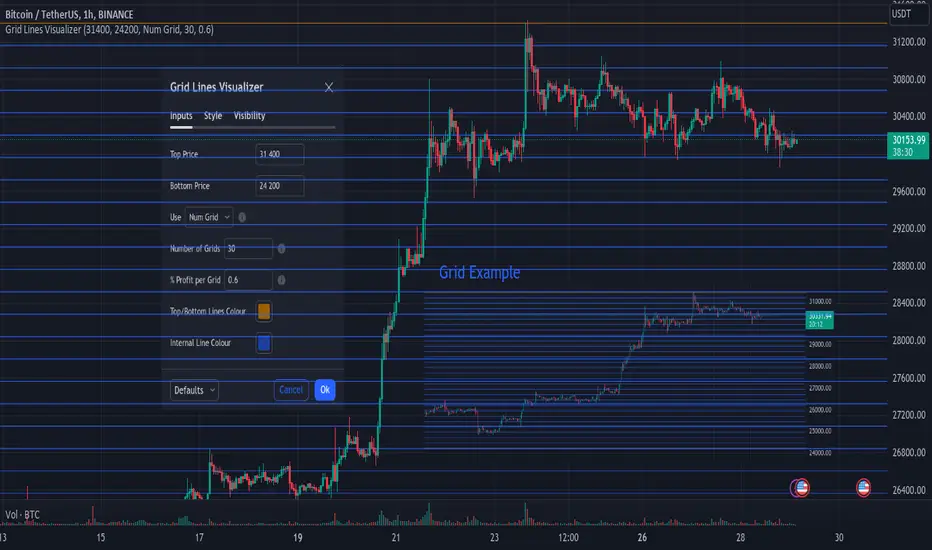
Simple Grid Lines VisualizerAbout Grid Bots
A grid bot is a type of trading bot or algorithm that is designed to automatically execute trades within a predefined price range or grid. It is commonly used in markets that exhibit ranging or sideways movement, where prices tend to fluctuate within a specific range without a clear trend.
The grid bot strategy involves placing a series of buy and sell orders at regular intervals within the predefined price range or grid. The bot essentially creates a grid of orders, hence the name. When the price reaches one of these levels, the bot will execute the corresponding trade. For example, if the price reaches a predefined lower level, the bot will buy, and if it reaches a predefined upper level, it will sell.
The purpose of the grid bot strategy is to take advantage of the price oscillations within the range. As the price moves up and down, the bot aims to generate profits by buying at the lower end of the range and selling at the higher end. By repeatedly buying and selling at these predetermined levels, the bot attempts to capture gains from the price fluctuations.
About this Script
Simple Grid Lines Visualizer is designed to assist traders in visualizing and implementing automated price grids on their charts. With just a few inputs, this script generates gridlines based on your specified top price, bottom price, and the number of grids or profit per grid.
How it Works:
Specify Top and Bottom Prices: Start by setting the top and bottom prices that define the range within which the gridlines will be generated. These prices can be based on support and resistance levels, historical data, or any other factors you consider relevant to your analysis.
Determine Grid Parameters: Choose either the number of grids or profit per grid, depending on your preference and trading strategy. If you select the number of grids, the script will evenly distribute the gridlines within the specified price range. Alternatively, if you opt for profit per grid, the script will calculate the price increment required to achieve your desired profit level per grid.
Note that when choosing Profit per Grid , an approximation usually is performed, as all grid lines must be evenly distributed. To achieve that, the script computes the grid distance using the mean price between top and bottom, then computes how many of those complete distances may enter the entire range, and lastly, creates a grid with evenly distributed distances as close as possible to the previously computed.
Customize Styling and Display: Adjust the line color, line style, transparency, and other visual aspects to ensure clear visibility on your charts.
Analyze and Trade: Once the gridlines are plotted on your chart, carefully observe how the market interacts with them. The gridlines can act as reference points for potential support and resistance levels, as well as simple buy/sell orders for a trading bot.
Try to find gridlines that intersect prices as frequently as possible from one to another.
A grid with too many lines will make lots of potential trades, but the amount traded will be minimal (as the total amount invested is divided over the number of grids).
A grid with too few lines will make lots of profits with each trade, but the trades will be less likely to occur (depending on the top/bottom distance).
This tool aims to help visually which grid parameters seem to optimize this problem.
Future versions may include automatic profit computation.
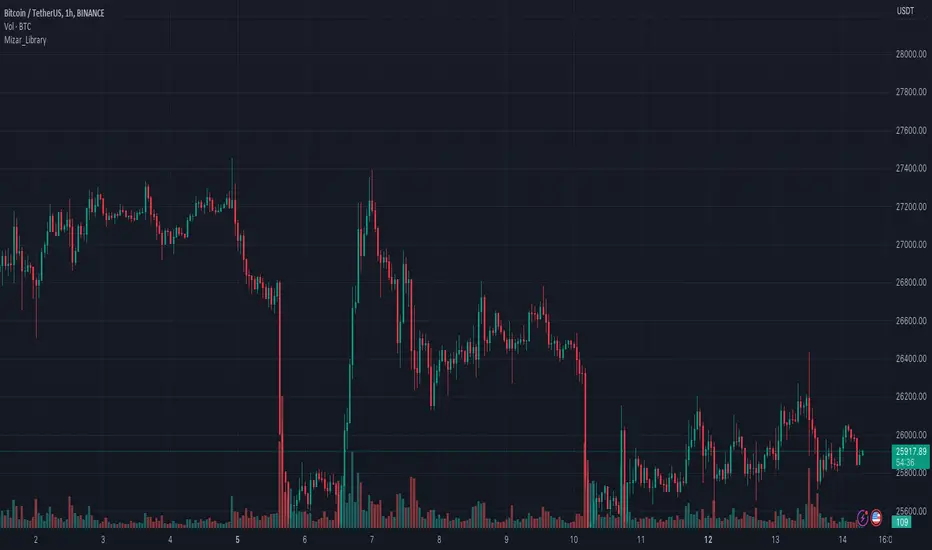
Mizar_LibraryThe "Mizar_Library" is a powerful tool designed for Pine Script™ programmer’s, providing a collection of general functions that facilitate the usage of Mizar’s DCA (Dollar-Cost-Averaging) bot system.
To begin using the Mizar Library, you first need to import it into your indicator script. Insert the following line below your indicator initiation line: import Mizar_Trading/Mizar_Library/1 as mizar (mizar is the chosen alias).
In the import statement, Mizar_Trading.Mizar_Library_v1 refers to the specific version of the Mizar Library you wish to use. Feel free to modify mizar to your preferred alias name.
Once the library is imported, you can leverage its functions by prefixing them with mizar. . This will prompt auto-completion suggestions displaying all the available user-defined functions provided by the Mizar Library.
Now, let's delve into some of the key functions available in the Mizar Library:
DCA_bot_msg(_cmd)
The DCA_bot_msg function accepts an user-defined type (UDT) _cmd as a parameter and returns a string with the complete JSON command for a Mizar DCA bot.
Parameters:
_cmd (bot_params) : ::: User-defined type (UDT) that holds all the necessary information for the bot command.
Returns: A string with the complete JSON command for a Mizar DCA bot.
rounding_to_ticks(value, ticks, rounding_type)
The rounding_to_ticks function rounds a calculated price to the nearest actual price based on the specified tick size.
Parameters:
value (float) : ::: The calculated price as float type, to be rounded to the nearest real price.
ticks (float) : ::: The smallest possible price obtained through a request in your script.
rounding_type (int) : ::: The rounding type for the price: 0 = closest real price, 1 = closest real price above, 2 = closest real price below.
Returns: A float value representing the rounded price to the next tick.
bot_params
Bot_params is an user-defined type (UDT) that represents the parameters required for a Mizar DCA bot.
Fields:
bot_id (series string) : The ID number of your Mizar DCA bot.
api_key (series string) : Your private API key from your Mizar account (keep it confidential!).
action (series string) : The command to perform: "open" (standard) or "close" optional .
tp_perc (series string) : The take profit percentage in decimal form (1% = "0.01") optional .
base_asset (series string) : The cryptocurrency you want to buy (e.g., "BTC").
quote_asset (series string) : The coin or fiat currency used for payment (e.g., "USDT" is standard if not specified) optional .
direction (series string) : The direction of the position: "long" or "short" (only applicable for two-way hedge bots) optional .
To obtain the JSON command string for the alert_function call, you can use the DCA_bot_msg function provided by the library. Simply pass the cmd_msg UDT as an argument and assign the returned string value to a variable.
Here's an example to illustrate the process:
// Import of the Mizar Library to use the included functions
import/Mizar_Trading/Mizar_Library/1 as mizar
// Example to set a variable called “cmd_msg” and all of its parameters
cmd_msg = mizar.bot_params. new()
cmd_msg.action := "open"
cmd_msg.api_key := "top secret"
cmd_msg.bot_id := "9999"
cmd_msg.base_asset := "BTC"
cmd_msg.quote_asset := "USDT"
cmd_msg.direction := "long"
cmd_msg.tp_perc := "0.015"
// Calling the Mizar conversion function named “DCA_bot_msg()” with the cmd_msg as argument to receive the JSON command and save it in a string variable called “alert_msg”
alert_msg = mizar.DCA_bot_msg(cmd_msg)
Feel free to utilize (series) string variables instead of constant strings. By incorporating the Mizar Library into your Pine Script, you gain access to a powerful set of functions and can leverage them according to your specific requirements.
For additional help or support, you can join the Mizar Discord channel. There, you'll find a dedicated Pine Script channel where you can ask any questions related to Pine Script.
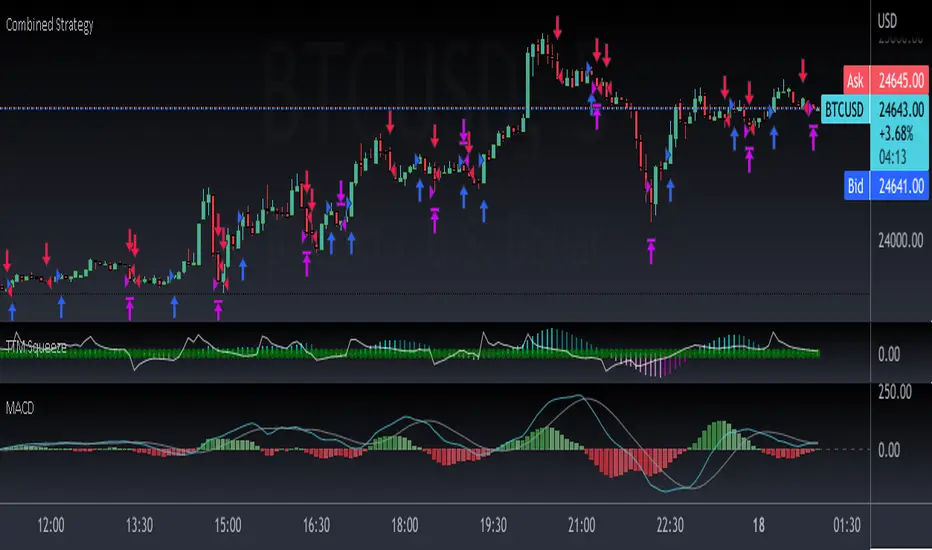
Combined Strategy Trading Bot (RSI ADX 20SMA)Trading Bot V1, This code implements a combined trading strategy that uses several indicators and strategies to make buy and sell decisions in the market. The code is written in Pine Script™, which is a programming language used in the TradingView platform. By BraelonWhitfield.Eth
The strategy uses the Average Directional Movement Index (ADX) and the Pine SuperTrend indicator to identify trends and price movements in the market. The SuperTrend indicator is a popular technical analysis tool that helps to identify the direction of the current trend and provides entry and exit points for trades.
The strategy also uses the Relative Strength Index (RSI) to identify overbought and oversold conditions in the market. The RSI is a momentum indicator that measures the speed and change of price movements in the market.
The first part of the code defines the inputs for the ADX and DI Length, which are used to calculate the ADX and DI values. The dirmov() function is used to calculate the positive and negative directional indicators (plusDM and minusDM) based on the high and low prices. The truerange variable is then calculated using the True Range (TR) formula. Finally, the plus and minus variables are calculated using the smoothed moving average of the plusDM and minusDM values.
The adx() function is then used to calculate the ADX values based on the plus and minus variables. The Pine SuperTrend indicator is defined using the pine_supertrend() function. This function uses the high-low average (hl2) and the Average True Range (ATR) to calculate the upper and lower bands for the indicator. The direction of the current trend is then determined based on whether the current price is above or below the upper or lower bands.
The RSI values are then calculated using the ta.rsi() function, with the inputs for the close price and the RSI period. The overbought and oversold conditions are defined using the OB and OS inputs, which specify the threshold values for the RSI. The upTrend and downTrend variables are defined based on the direction of the Pine SuperTrend indicator.
The next part of the code defines the 20-period Simple Moving Average (SMA) using the ta.sma() function. The os and ob variables are then calculated based on the RSI values and the OB and OS inputs. The strategy.entry() function is used to define the buy and sell orders based on the upTrend and downTrend variables, as well as the Pine SuperTrend indicator, the 20-period SMA, and the os variable.
The final part of the code defines the Channel Breakout Strategy using the ta.highest() and ta.lowest() functions to calculate the upper and lower bounds of the channel. The strategy.entry() function is then used to define the buy and sell orders based on whether the current price is above or below the upper or lower bounds.
In summary, this code implements a combined trading strategy that uses several indicators and strategies to make buy and sell decisions in the market. The strategy is designed to identify trends and price movements in the market, as well as overbought and oversold conditions, to provide entry and exit points for trades. The strategy uses the Pine SuperTrend indicator, the ADX and DI indicators, the RSI, and the 20-period SMA, as well as the Channel Breakout Strategy to make informed trading decisions.
Assassin's Grid
Introduction: Are you a fan of automated grid-based trading and holding onto your crypto assets like they're the last Snickers bar in the world? If so, this Pine script could be your new best friend!
Grid Trading Genius: The script uses some seriously advanced grid trading techniques to automatically place orders at different price levels, creating a mesh of positions that move with the market like a well-oiled machine. This strategy can be great for traders who are willing to sit back and let their positions grow like a fine wine over time.
Optimization Features: The script comes loaded with all sorts of features and tools to help traders optimize their grid positions, like position exits and custom alerts for creating limit and market orders. This helps keep traders in the loop and allows them to take action as needed, like a ninja in the night.
Unique Twists: One of the unique features of this script is the option to choose between normal or incremental entry steps in a 1,2,3,... ratio. By choosing incremental entries, traders can potentially improve their average price and increase their potential profits like a boss. Just keep in mind that this script doesn't have a stop loss feature, but it does include the option to sell without profit on the final entry or on all entries if desired. Additionally, the script is always open to improvement and any ideas for improving it are welcome, like a blank canvas.
Conclusion: If you love automated trading and have the patience and determination to stick to a solid strategy, this Pine script could be a great fit for you. It's suitable for traders who are comfortable with more complex trading approaches and are willing to put in the time and effort to learn and master the script's various features and techniques, like a Jedi Knight
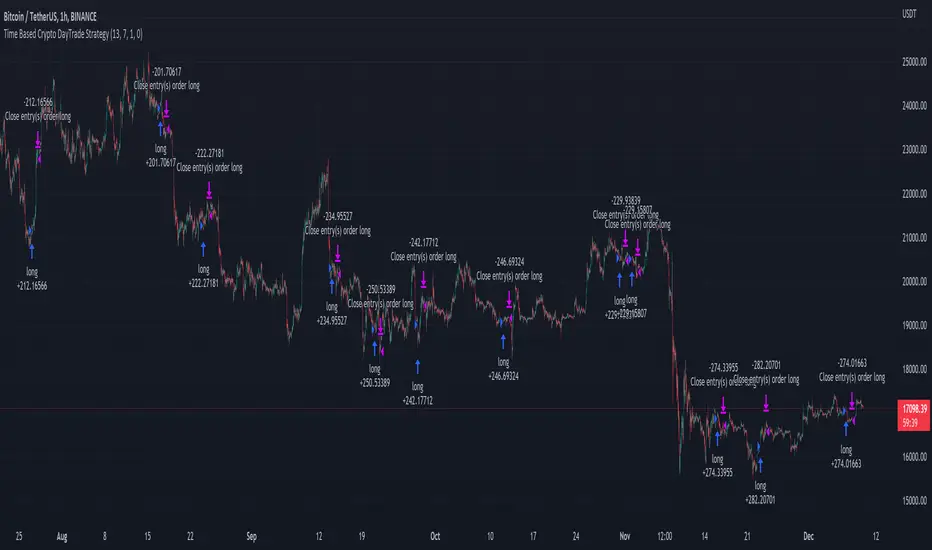
Time Based Crypto DayTrade StrategyThis is a time based strategy, designed to enter and exit within the same day of the week, using different hours for entry and exit.
The script is long only direction, and it has no risk management inside, so use it with caution.
At the same time you can also calculate each individual hour return within a certain day, and make your own idea about the best moments to be enter.
In order to filter a bit from the bad trades, I have applied an ATR filter, to check if that volatility is rising in order to help eliminate some of the bad trades when there is no volatility around.
For this example, on BTC, it seems that for the last years, on tuesday and thursday, enterring at the beginning of the daily candle, 01:00hours and exit at 00:00 hours, seems to give positive results giving the idea that can be converted in some sort of edge into our favor.
However dont take this entirelly for granted and conduct your own searches
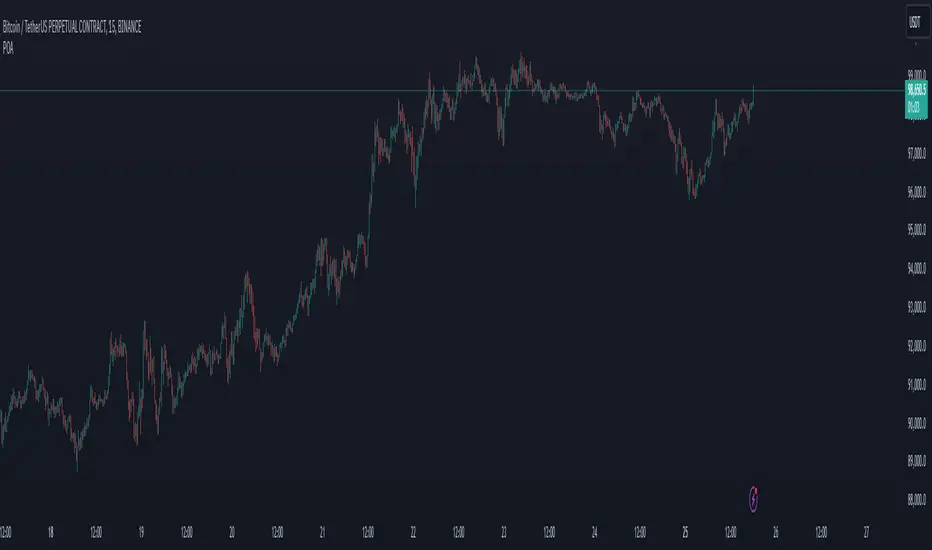
POALibrary "POA"
This library is a client script for making a webhook signal formatted string to POABOT server.
entry_message(password, percent, leverage, kis_number)
Create a entry message for POABOT
Parameters:
password : (string) The password of your bot.
percent : (float) The percent for entry based on your wallet balance.
leverage : (int) The leverage of entry. If not set, your levereage doesn't change.
kis_number : (int) The number of koreainvestment account.
Returns: (string) A json formatted string for webhook message.
close_message(password, percent, kis_number)
Create a close message for POABOT
Parameters:
password : (string) The password of your bot.
percent : (float) The percent for close based on your wallet balance.
kis_number : (int) The number of koreainvestment account.
Returns: (string) A json formatted string for webhook message.
exit_message(password, percent)
Create a exit message for POABOT
Parameters:
password : (string) The password of your bot.
percent : (float) The percent for exit based on your wallet balance.
Returns: (string) A json formatted string for webhook message.
in_trade(start_time, end_time)
Create a trade start line
Parameters:
start_time : (int) The start of time.
end_time : (int) The end of time.
Returns: (bool) Get bool for trade based on time range.
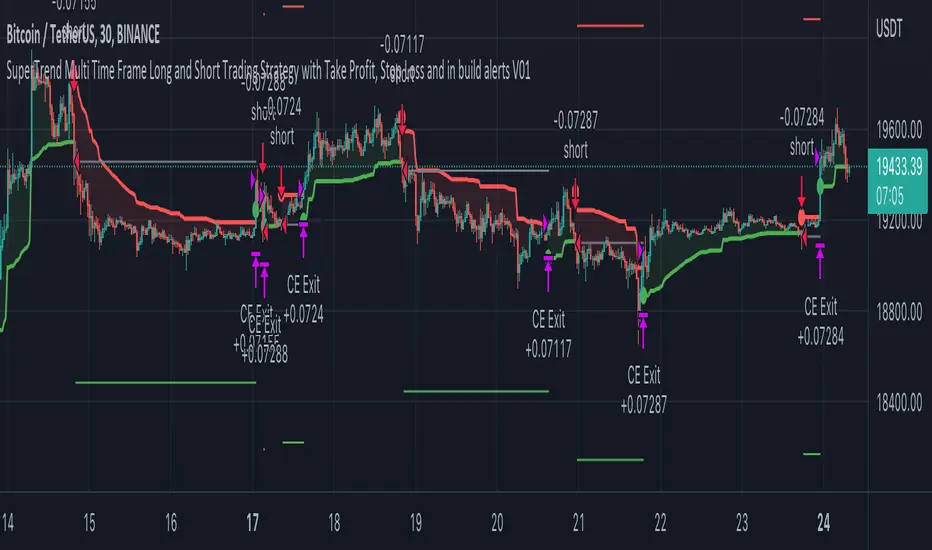
SuperTrend Multi Time Frame Long and Short Trading Strategy
Hello All
This is non-repainting Supertrend Multi Time Frame script, I got so many request on Supertrend with Multi Time Frame. This is for all of them ..I am making it open for all so you can change its coding according to your need.
How the Basic Indicator works
SuperTrend is one of the most common ATR based trailing stop indicators.
In this version you can change the ATR calculation method from the settings. Default method is RMA.
The indicator is easy to use and gives an accurate reading about an ongoing trend. It is constructed with two parameters, namely period and multiplier. The default values used while constructing a Supertrend indicator are 10 for average true range or trading period and three for its multiplier.
The average true range (ATR) plays an important role in 'Supertrend' as the indicator uses ATR to calculate its value. The ATR indicator signals the degree of price volatility .
The buy and sell signals are generated when the indicator starts plotting either on top of the closing price or below the closing price. A buy signal is generated when the ‘Supertrend’ closes above the price and a sell signal is generated when it closes below the closing price.
It also suggests that the trend is shifting from descending mode to ascending mode. Contrary to this, when a ‘Supertrend’ closes above the price, it generates a sell signal as the colour of the indicator changes into red.
A ‘Supertrend’ indicator can be used on spot, futures, options or forex, or even crypto markets and also on daily, weekly and hourly charts as well, but generally, it fails in a sideways-moving market.
How the Strategy works
This is developed based on SuperTrend.
Use two time frame for confirm all entry signals.
Two time frame SuperTrend works as Trailing stop for both long and short positions.
More securely execute orders, because it is wait until confine two time frames(example : daily and 30min)
Each time frame developed as customisable for user to any timeframe.
User can choose trading position side from Long, Short, and Both.
Custom Stop Loss level, user can enter Stop Loss percentage based on timeframe using.
Multiple Take Profit levels with customisable TP price percentage and position size.
Back-testing with custom time frame.
This strategy is develop for specially for automation purpose.
The strategy includes:
Entry for Long and Short.
Take Profit.
Stop Loss.
Trailing Stop Loss.
Position Size.
Exit Signal.
Risk Management Feature.
Backtesting.
Trading Alerts.
Use the strategy with alerts
This strategy is alert-ready. All you have to do is:
Go on a pair you would like to trade
Create an alert
Select the strategy as a Trigger
Wait for new orders to be sent to you
This is develop for specially for automating trading on any exchange, if you need to get that automating service for this strategy or any Tradingview strategy or indicator please contact me I am have 8 year experience on that field.
I hope you enjoy it!
Thanks,
Ranga
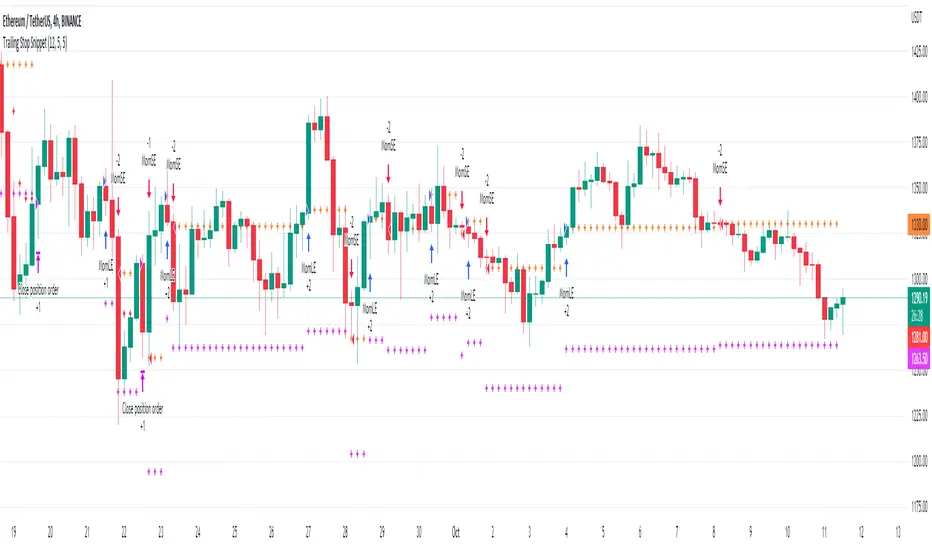
Trailing Stop SnippetThis is an example snippet that should allow for adding a trailing stop and trailing stop activation to almost any script.
You can use it by setting a trailing stop alone. This will provide you standard trailing stop functionality allowing you to lock in profits and increase your stop-loss as the price moves in your direction.
You can also set the trailing stop activation to trigger the original trailing stop at a certain level. "Once price rises 5%, set a trailing stop at break even". This would be set as 5 and 5 in the settings.
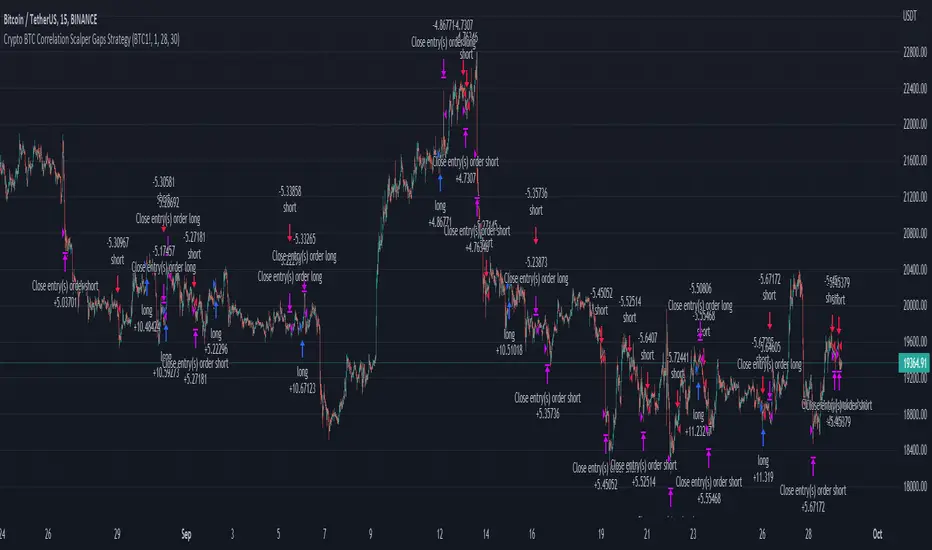
Crypto BTC Correlation Scalper Gaps StrategyThis strategy is based on the gaps theory.
In this case we have the BTC futures from CME, which acts in a way similar to stocks, and we can have gaps present between close/open session, and also sometimes between same candle due to huge movements intra candle.
At the same time I have combined this with a daily moving average, to help out a bit with the trend, since we are looking at small timeframe like 1-15/30min .
On top of that we have a reverse option, where long = short and viceversa, which can be used with against BTC pairs .
Rule are simple:
For long, we have a long gap and the close of the correlated candle is above daily sma
For short, we have a short gap and the close of the correlated candle is below daily sma
For exit:
For exit, we take the highest highest values for short entry TP, meaning we get the different from the HH and rest the current open candle distance, and use that distance as a TP.
At the same time for long entry, we take the lowest low value and rest current close of the candle to that value, and we get the TP.
Can also be applied this logic for SL aswell but from the test I have found out that exiting based on a reverse condition(when tp is not being hit), gives better results/dd overall.
If you have any questions, please let me know !
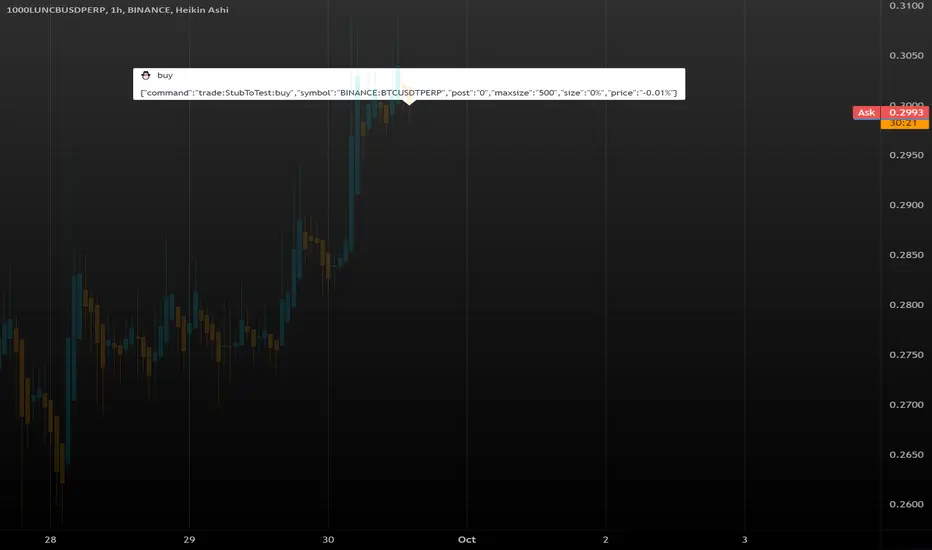
FrostyBotLibrary "FrostyBot"
JSON Alert Builder for FrostyBot.js Binance Futures and FTX orders
github.com
More Complete Version Soon.
TODO: Comment Functions and annotations from command reference ^^
TODO: Add additional whitelist and symbol mappings.
leverage()
buy()
sell()
cancelall()
closelong()
closeshort()
traillong()
trailshort()
long()
short()
takeprofit()
stoploss()
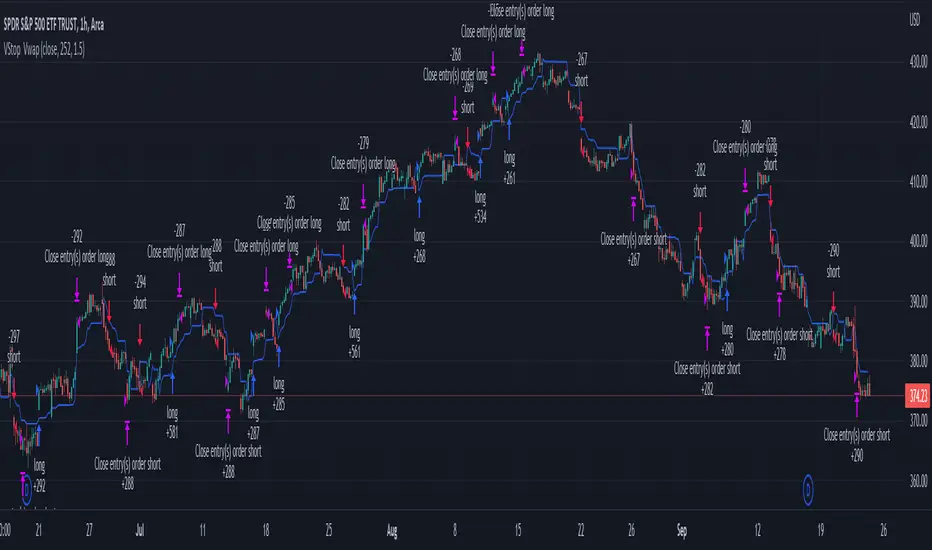
Volatility Stop with Vwap StrategyFirst the credits goes to @TradingView for their release of the volatility stop mtf indicator.
I have took it, and inside I have added a weekly vwap for a better trend direction and at the same time I have added a dynamic risk managment which is calculated from the distance between the volatility line to the close of the candle.
The rules for entry are simple:
For long:We enter when our close of the candle is above the volatility stop line and at the same time the close of the candle is above weekly vwap
For short we enter when our close of the candle is below the volatility stop line and at the same time the close of the candle is below weekly vwap.
We exit when we either have a reverse signal than the one we enterred, or based on the TP/SL which is calculated with the distance from vwap to the close of the candle.
If you have any questions please let me know !
Ultra Moving Average Rating Trend StrategyThis is a technical analysis strategy based initially on the rating strategy, but fully adapted and converted to moving average rating.
In this case we are using: Ichimoku, SMA, EMA, ALMA, SMMA, LSMA, VWMA, DEMA, HMA, KAMA FRAMA, VIDYA, JMA, TEMA, ZLEMA, TRIMA and T3 moving averages.
With all of them together I am making an index.
Rules for entry and exit:
If % percentage of all the moving averages is telling to go long , we go long or exit short. And viceversa for short.
If there are any questions, please let me know !

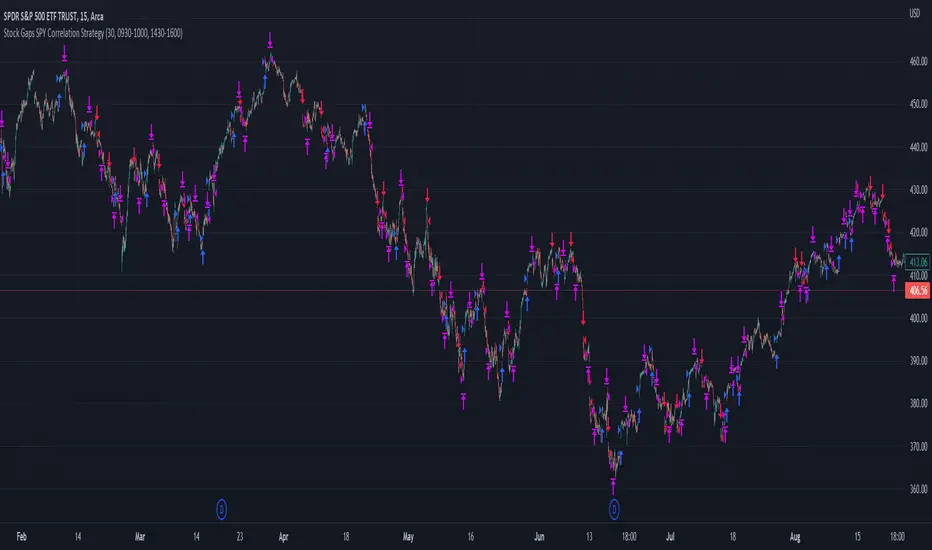
Stock Gaps SPY Correlation StrategyThis is daytrade stock strategy, designed to take the best out of the daily gaps that are forming between the close of previous day and opening of present day.
At the same time its logic has been adapted for SPY chart, in order to use correlation with the other stocks/assets/ etf which are linked with SP500 movement.
Lastly it has been added 2 new confirmation logics, based on the USI: advance/decline chart and percentage above vwap among all US stocks.
The rules for entry are simple :
We are at the opening daily candle, we have a long/short gap based on where the opening is happening and at the same time we are checking to see that the current different between the current difference between low and previous high (or viceversa) is higher than an established parameter(minimal deviation )
For exit, we exit based on time/clock parameter, in this case by default I selected 1h and half before close of the US session.
For testing purposes I have used 10% of the available capital, with a 0.0035$ comission per each share bought ( IBKR comissions)
If there are any questions, please let me know either here or in private !
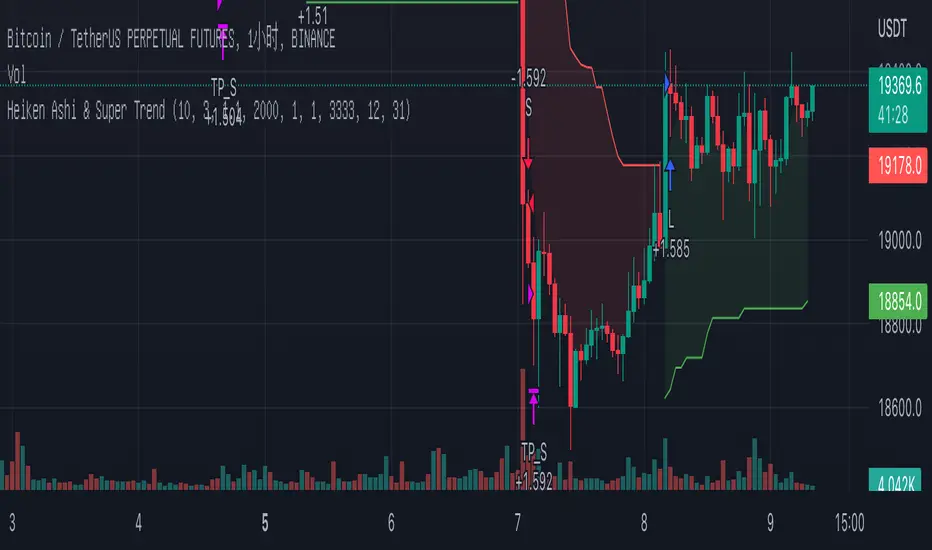
Heiken Ashi & Super TrendThis is one of my open source 1h strategies
It works on Binance: BTCUSDTPERP charts
This strategy involves two indicators
1. Heiken Ashi - a typical technical indicator to help highlight and clarify the current trend. This somehow allows the chart to ignore unnecessary fluctuations and make the trend more visible.
2.Super Trend - - One of the most common ATR-based indicators, the SuperTrend indicator is useful to help you catch big trends.
Buy entry conditions are as follows.
1. The Super Trend indicator running on the Heiken Ashi chart gives a buy signal.
2. Buy at the current market price and take profit at 1% of the normal k-line at this time.
Take profit
TP - 1%
Stop Loss
None