Bracket PreviewThe Bracket Preview indicator allows the user to set their intended bracket order distance (distance, in ticks, to take-profit and stop-loss) from the current live price so that a preview is generated and updated in real-time as price moves. This gives the trader a quick reference of where the bracket orders would be placed if a position were entered at that specific moment in time. This can be helpful by making it more obvious to the trader before a trade is placed exactly where these levels would be in relation to previous price action or if it would be better to wait for price to move to a more favorable level or accept a different Risk-Reward (RR) from this specific trade.
• “If I entered a long position now, would my target be in front of or beyond a recent consolidation area where it is likely to run into resistance and potentially reverse before hitting my take-profit?”
• “Would this bracket order place my stop-loss above or below a previous pivot or would I need to move it after entering the trade and potentially increase the risk on this trade to have it in a more logical level?”
• “If price is in a range and I enter now, would my stop be in the middle of the range while my target is outside the top of the range? Maybe I should wait for price to move to an area where my target would be inside but near the top of the range while my stop loss is below the range so that I’m not taking unnecessary risk or being forced to take an unfavorable RR.”
Brackets

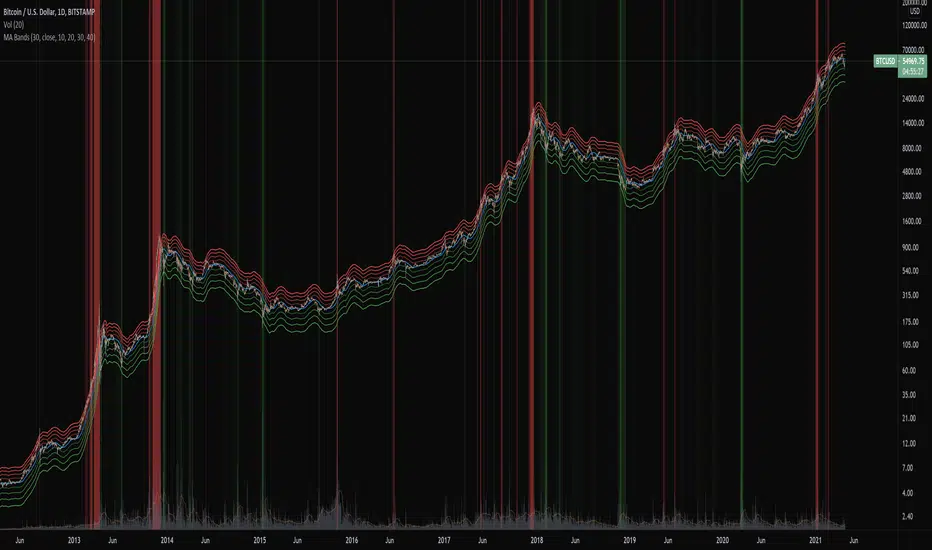
Moving Average BandsUse this script to find buy and sell zones for BTC based on momentum of the move relative to the average asset price over a given period. The script plots a series of offset bands above and below the Simple Moving Average. When price crosses another band further from the SMA, the background is rendered brighter. The brighter the background, the stronger the buy and sell signal is, as the expectation is that price wants to return to the SMA. Settings are adjustable to fine tune to various time frames and assets. Good settings for BTC Daily are length 30, layers at 10, 20, 30, and 40.
On 1H BTC/USD I use length 200, layers at 5, 10, 15, 20 to find decent swing trading opportunities.
On BTC/USD 1D chart, combine with Bitcoin Logarithmic Growth Curve from @mabonyi (original by @quantadelic )for confluence of very reliable signals.