ADR Plots + OverlayADR Plots + Overlay
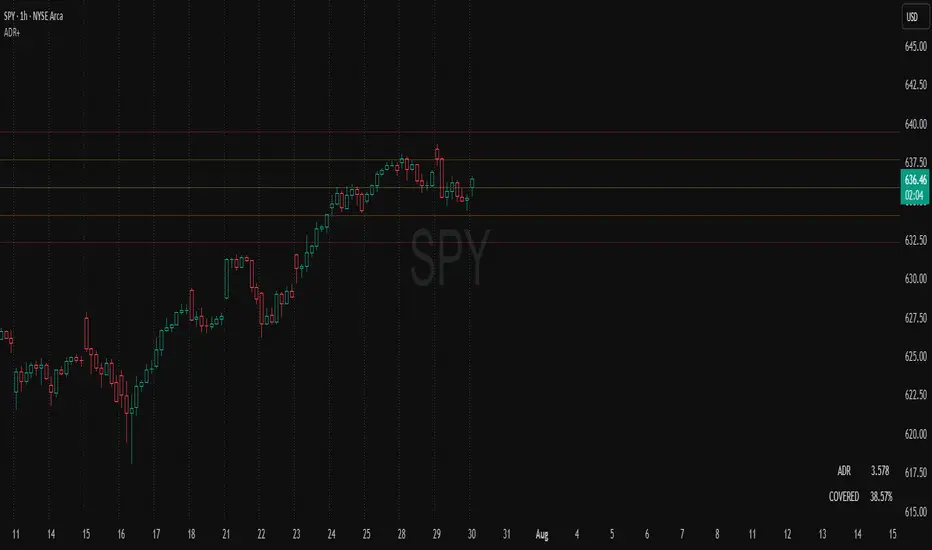
This tool calculates and displays Average Daily Range (ADR) levels on your chart, giving traders a quick visual reference for expected daily price movement. It plots guide levels above and below the daily open and shows how much of the day's typical range has already been covered—all in one interactive table and on-chart overlay.
What It Does
ADR Calculation:
Uses daily high-low differences over a user-defined period (default 14 days), smoothed via RMA, SMA, EMA, or WMA to calculate the average daily range.
Projected Levels:
Plots four reference levels relative to the current day's open price:
+100% ADR: Open + ADR
+50% ADR: Open + 50% of ADR
−50% ADR: Open − 50% of ADR
−100% ADR: Open − ADR
Coverage %:
Tracks intraday high and low prices to calculate what percentage of the ADR has already been covered for the current session:
Coverage % = (High − Low) ÷ ADR × 100
Interactive Table:
Shows the ADR value and today's ADR coverage percentage in a customizable table overlay. The table position, colors, border, transparency, and an optional empty top row can all be adjusted via settings.
Customization Options
Table Settings:
Position the table (top/bottom × left/right).
Change background color, text color, border color and thickness.
Toggle an empty top row for spacing.
Line Settings:
Choose color, line style (solid/dotted/dashed), and width.
Lines automatically reposition each day based on that day's open price and ADR calculation.
General Inputs:
ADR length (number of days).
Smoothing method (RMA, SMA, EMA, WMA).
How to Use It for Trading
Measure Daily Movement: Instantly know the expected daily price range based on historical volatility.
Identify Overextension: Use the coverage % to see if the market has already moved close to or beyond its typical daily range.
Plan Entries & Exits: Align trade targets and stops with ADR levels for more objective intraday planning.
Visual Reference: Horizontal guide lines and table update automatically as new data comes in, helping traders stay informed without manual calculations.
Ideal For
Intraday traders tracking daily volatility limits.
Swing traders wanting a quick reference for expected price movement per day.
Anyone seeking a volatility-based framework for planning targets, stops, or identifying extended market conditions.
Breadth Indicators
SCTI-RSKSCTI-RSK 是一个多功能技术指标合集,整合了多种常用技术指标于一个图表中,方便交易者综合分析市场状况。该指标包含以下五个主要技术指标模块,每个模块都可以单独显示或隐藏:
Stoch RSI - 随机相对强弱指数
KDJ - 随机指标
RSI - 相对强弱指数
CCI - 商品通道指数
Williams %R - 威廉指标
主要特点
模块化设计:每个指标都可以单独开启或关闭显示
交叉信号可视化:Stoch RSI和KDJ的金叉/死叉信号有彩色填充标识
多时间框架分析:支持不同长度的参数设置
直观界面:清晰的参数分组和颜色区分
适用场景
趋势判断
超买超卖区域识别
交易信号确认
多指标共振分析
English Description
SCTI-RSK is a comprehensive technical indicator that combines multiple popular indicators into a single chart for traders to analyze market conditions holistically. The indicator includes the following five main technical indicator modules, each can be toggled on/off individually:
Stoch RSI - Stochastic Relative Strength Index
KDJ - Stochastic Oscillator
RSI - Relative Strength Index
CCI - Commodity Channel Index
Williams %R - Williams Percent Range
Key Features
Modular Design: Each indicator can be shown or hidden independently
Visual Crossover Signals: Golden/Death crosses are highlighted with color fills for Stoch RSI and KDJ
Multi-Timeframe Analysis: Supports different length parameters
Intuitive Interface: Clear parameter grouping and color differentiation
Use Cases
Trend identification
Overbought/Oversold zone recognition
Trade signal confirmation
Multi-indicator confluence analysis
参数说明 (Parameter Explanation)
指标参数分为6个主要组别:
基础指标设置 - 控制各指标的显示/隐藏
Stoch RSI 设置 - 包括K值、D值、RSI长度等参数
KDJ 设置 - 包括周期、信号线等参数
RSI 设置 - 包括RSI长度、中期长度等参数
CCI 设置 - 包括CCI长度、中期长度等参数
Williams %R 设置 - 包括长度参数
使用建议 (Usage Suggestions)
初次使用时,可以先开启所有指标观察它们的相互关系
根据个人交易风格调整各指标的长度参数
关注多指标同时发出信号时的交易机会
结合价格行为和其他分析工具确认信号
更新日志 (Changelog)
v1.0 初始版本,整合五大技术指标
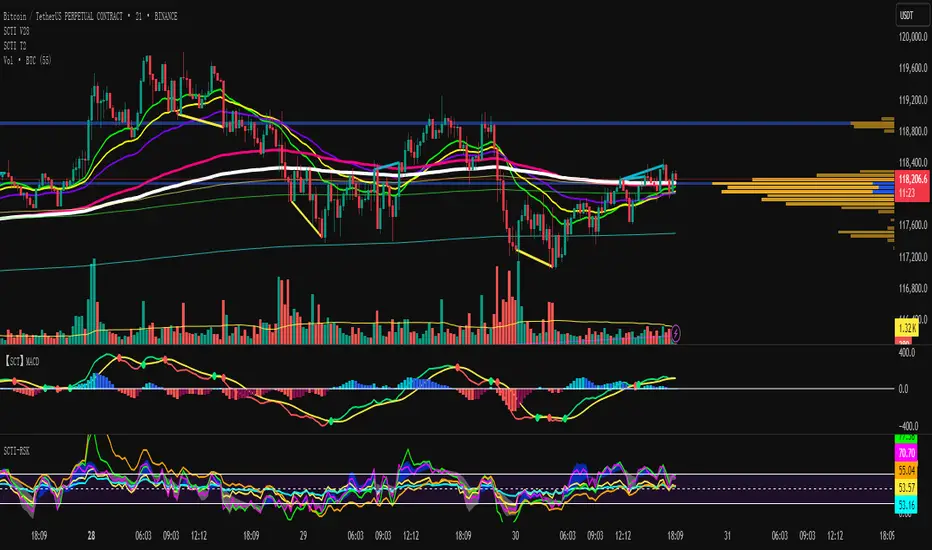
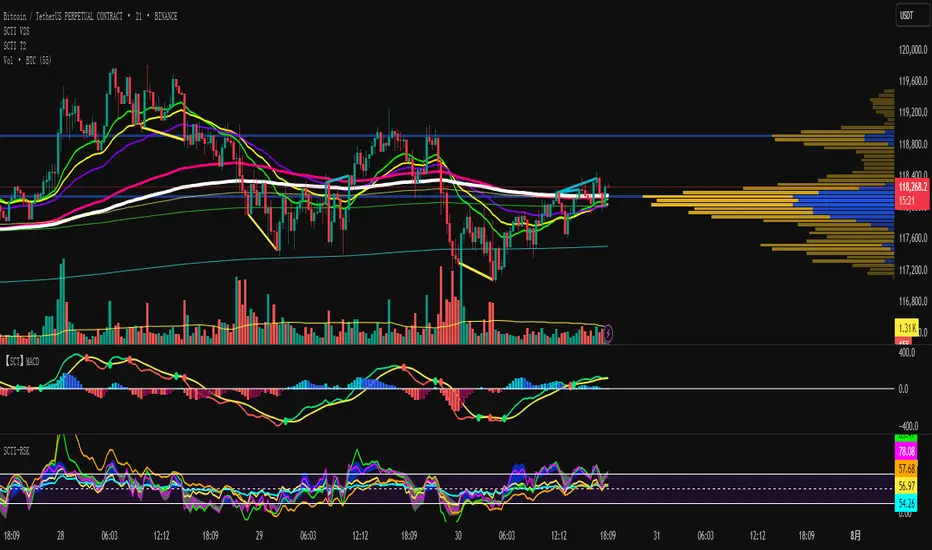
SCTI V28Indicator Overview | 指标概述
English: SCTI V28 (Smart Composite Technical Indicator) is a multi-functional composite technical analysis tool that integrates various classic technical analysis methods. It contains 7 core modules that can be flexibly configured to show or hide components based on traders' needs, suitable for various trading styles and market conditions.
中文: SCTI V28 (智能复合技术指标) 是一款多功能复合型技术分析指标,整合了多种经典技术分析工具于一体。该指标包含7大核心模块,可根据交易者的需求灵活配置显示或隐藏各个组件,适用于多种交易风格和市场环境。
Main Functional Modules | 主要功能模块
1. Basic Indicator Settings | 基础指标设置
English:
EMA Display: 13 configurable EMA lines (default shows 8/13/21/34/55/144/233/377/610/987/1597/2584 periods)
PMA Display: 11 configurable moving averages with multiple MA types (ALMA/EMA/RMA/SMA/SWMA/VWAP/VWMA/WMA)
VWAP Display: Volume Weighted Average Price indicator
Divergence Indicator: Detects divergences across 12 technical indicators
ATR Stop Loss: ATR-based stop loss lines
Volume SuperTrend AI: AI-powered super trend indicator
中文:
EMA显示:13条可配置EMA均线,默认显示8/13/21/34/55/144/233/377/610/987/1597/2584周期
PMA显示:11条可配置移动平均线,支持多种MA类型(ALMA/EMA/RMA/SMA/SWMA/VWAP/VWMA/WMA)
VWAP显示:成交量加权平均价指标
背离指标:12种技术指标的背离检测系统
ATR止损:基于ATR的止损线
Volume SuperTrend AI:基于AI预测的超级趋势指标
2. EMA Settings | EMA设置
English:
13 independent EMA lines, each configurable for visibility and period length
Default shows 21/34/55/144/233/377/610/987/1597/2584 period EMAs
Customizable colors and line widths for each EMA
中文:
13条独立EMA均线,每条均可单独配置显示/隐藏和周期长度
默认显示21/34/55/144/233/377/610/987/1597/2584周期的EMA
每条EMA可设置不同颜色和线宽
3. PMA Settings | PMA设置
English:
11 configurable moving averages, each with:
Selectable types (default EMA, options: ALMA/RMA/SMA/SWMA/VWAP/VWMA/WMA)
Independent period settings (12-1056)
Special ALMA parameters (offset and sigma)
Configurable data source and plot offset
Support for fill areas between MAs
Price lines and labels can be added
中文:
11条可配置移动平均线,每条均可:
选择不同类型(默认EMA,可选ALMA/RMA/SMA/SWMA/VWAP/VWMA/WMA)
独立设置周期长度(12-1056)
设置ALMA的特殊参数(偏移量和sigma)
配置数据源和绘图偏移
支持MA之间的填充区域显示
可添加价格线和标签
4. VWAP Settings | VWAP设置
English:
Multiple anchor period options (Session/Week/Month/Quarter/Year/Decade/Century/Earnings/Dividends/Splits)
3 configurable standard deviation bands
Option to hide on daily and higher timeframes
Configurable data source and offset settings
中文:
多种锚定周期选择(会话/周/月/季/年/十年/世纪/财报/股息/拆股)
3条可配置标准差带
可选择在日线及以上周期隐藏
支持数据源选择和偏移设置
5. Divergence Indicator Settings | 背离指标设置
English:
12 detectable indicators: MACD, MACD Histogram, RSI, Stochastic, CCI, Momentum, OBV, VWmacd, Chaikin Money Flow, MFI, Williams %R, External Indicator
4 divergence types: Regular Bullish/Bearish, Hidden Bullish/Bearish
Multiple display options: Full name/First letter/Hide indicator name
Configurable parameters: Pivot period, data source, maximum bars checked, etc.
Alert functions: Independent alerts for each divergence type
中文:
检测12种指标:MACD、MACD柱状图、RSI、随机指标、CCI、动量、OBV、VWmacd、Chaikin资金流、MFI、威廉姆斯%R、外部指标
4种背离类型:正/负常规背离,正/负隐藏背离
多种显示选项:完整名称/首字母/不显示指标名称
可配置参数:枢轴点周期、数据源、最大检查柱数等
警报功能:各类背离的独立警报
6. ATR Stop Loss Settings | ATR止损设置
English:
Configurable ATR length (default 13)
4 smoothing methods (RMA/SMA/EMA/WMA)
Adjustable multiplier (default 1.618)
Displays long and short stop loss lines
中文:
可配置ATR长度(默认13)
4种平滑方法(RMA/SMA/EMA/WMA)
可调乘数(默认1.618)
显示多头和空头止损线
7. Volume SuperTrend AI Settings | Volume SuperTrend AI设置
English:
AI Prediction:
Configurable neighbors (1-100) and data points (1-100)
Price trend length and prediction trend length settings
SuperTrend Parameters:
Length (default 3)
Factor (default 1.515)
5 MA source options (SMA/EMA/WMA/RMA/VWMA)
Signal Display:
Trend start signals (circle markers)
Trend confirmation signals (triangle markers)
6 Alerts: Various trend start and confirmation signals
中文:
AI预测功能:
可配置邻居数(1-100)和数据点数(1-100)
价格趋势长度和预测趋势长度设置
SuperTrend参数:
长度(默认3)
因子(默认1.515)
5种MA源选择(SMA/EMA/WMA/RMA/VWMA)
信号显示:
趋势开始信号(圆形标记)
趋势确认信号(三角形标记)
6种警报:各类趋势开始和确认信号
Usage Recommendations | 使用建议
English:
Trend Analysis: Use EMA/PMA combinations to determine market trends, with long-period EMAs (e.g., 144/233) as primary trend references
Divergence Trading: Look for potential reversals using price-indicator divergences
Stop Loss Management: Use ATR stop loss lines for risk management
AI Assistance: Volume SuperTrend AI provides machine learning-based trend predictions
Multiple Timeframes: Verify signals across different timeframes
中文:
趋势分析:使用EMA/PMA组合判断市场趋势,长周期EMA(如144/233)作为主要趋势参考
背离交易:结合价格与指标的背离寻找潜在反转点
止损设置:利用ATR止损线管理风险
AI辅助:Volume SuperTrend AI提供基于机器学习的趋势预测
多时间框架:建议在不同时间框架下验证信号
Parameter Configuration Tips | 参数配置技巧
English:
For short-term trading: Focus on 8-55 period EMAs and shorter divergence detection periods
For long-term investing: Use 144-2584 period EMAs with longer detection parameters
In ranging markets: Disable some EMAs, mainly rely on VWAP and divergence indicators
In trending markets: Enable more EMAs and SuperTrend AI
中文:
对于短线交易:可重点关注8-55周期的EMA和较短的背离检测周期
对于长线投资:建议使用144-2584周期的EMA和较长的检测参数
在震荡市:可关闭部分EMA,主要依靠VWAP和背离指标
在趋势市:可启用更多EMA和SuperTrend AI
Update Log | 更新日志
English:
V28 main updates:
Added Volume SuperTrend AI module
Optimized divergence detection algorithm
Added more EMA period options
Improved UI and parameter grouping
中文:
V28版本主要更新:
新增Volume SuperTrend AI模块
优化背离检测算法
增加更多EMA周期选项
改进用户界面和参数分组
Final Note | 最后说明
English: This indicator is suitable for technical traders with some experience. We recommend practicing with demo trading to familiarize yourself with all features before live trading.
中文: 该指标适合有一定经验的技术分析交易者使用,建议先通过模拟交易熟悉各项功能后再应用于实盘。
Kassa 30 70 90 Eröffnung
Kassa 30 – Subtle Lines with Offset Labels
This indicator plots horizontal price levels at ±30, ±70, and ±90 points from the market’s opening price (default 09:00).
The lines are displayed in soft gray tones to avoid chart distraction, while the labels are positioned to the left of the lines for a clean, unobstructed view of price action.
Lines extend for 3 hours after market open, making this tool ideal for breakout strategies, scalping setups, and identifying key intraday price zones.

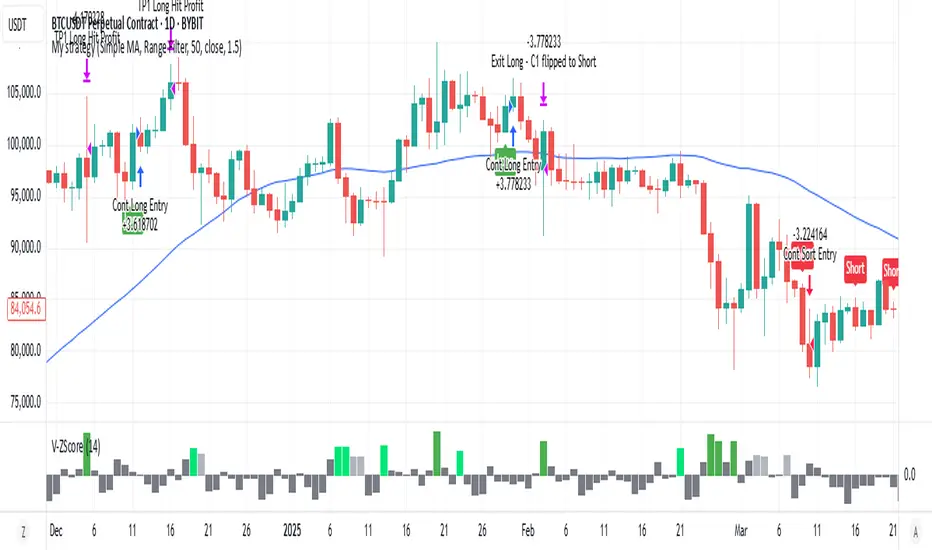
Volume Z-Score [T2][T69]🧠 Overview
This indicator calculates the Z-Score of volume to identify unusual trading activity, particularly those associated with whale-like behavior. It helps traders detect aggressive accumulation, distribution, or breakout setups based on volume anomalies relative to historical norms.
🔍 Features
Z-Score plot of volume using a configurable lookback.
Dynamic bar coloring based on Z-Score magnitude.
🐋 Small Whale marker appears when Z-Score exceeds +3.
Supports manual adjustment of sensitivity through lookback bars input.
🧪 Risk Level & Behavior Reference
🔥 Aggressive (10–14) - Fast signal, high sensitivity to volume spikes. Suitable for scalping or altcoin breakouts.
⚖️ Moderate (20–30) - Balanced filtering of noise vs real movement. Recommended for most swing traders.
🛡️ Conservative (40–60+) - Filters out noise. Reacts only to sustained large volume anomalies. Ideal for longer timeframes or large-cap coins.
⚙️ How to Use (NON DIRECTIONAL INDICATOR)
Use the Z-Score to gauge the strength of volume relative to recent history.
When Z-Score > 1.5 → Considered above-average activity.
When Z-Score > 3 → Marks a 🐋 Small Whale Move, potential for high-volatility follow-through.
Combine with price action, support/resistance, or OBV for confirmation.
⚠️ Limitations
This is a statistical signal, not directional.
Works best when paired with context: supply zones, trend bias, or large candle patterns.
🧠 Advanced Tips
Use multiple risk settings (e.g., 14 vs 50) on stacked indicators to track retail vs whale behavior separately.
Works well with low-float tokens and high-leverage exchange pairs like BTC/USDT (Bybit).
📝 Disclaimer
This script is provided for educational and analytical purposes only. Do your own research and manage your risk responsibly.
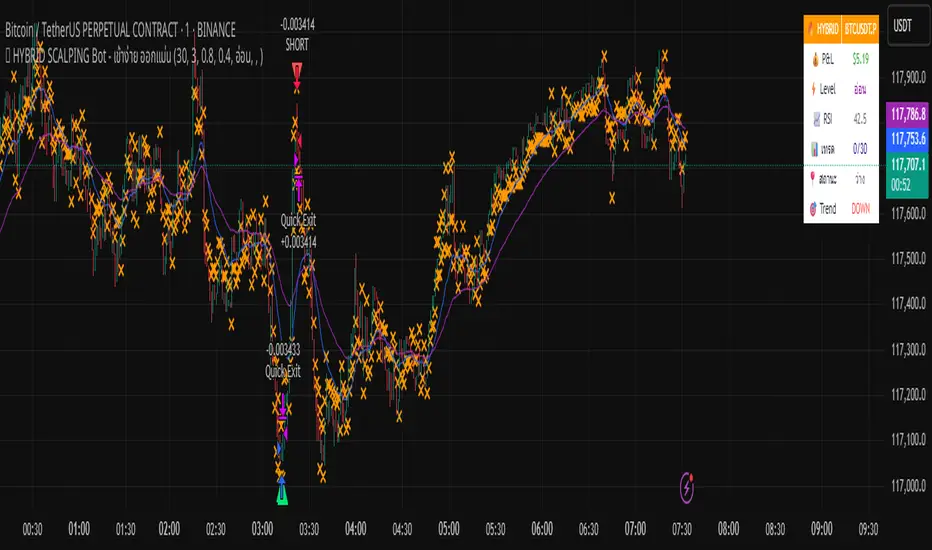
🔥 HYBRID SCALPING Bot - เข้าง่าย ออกแม่นA tool bot that helps analyze charts accurately, focusing on profits.
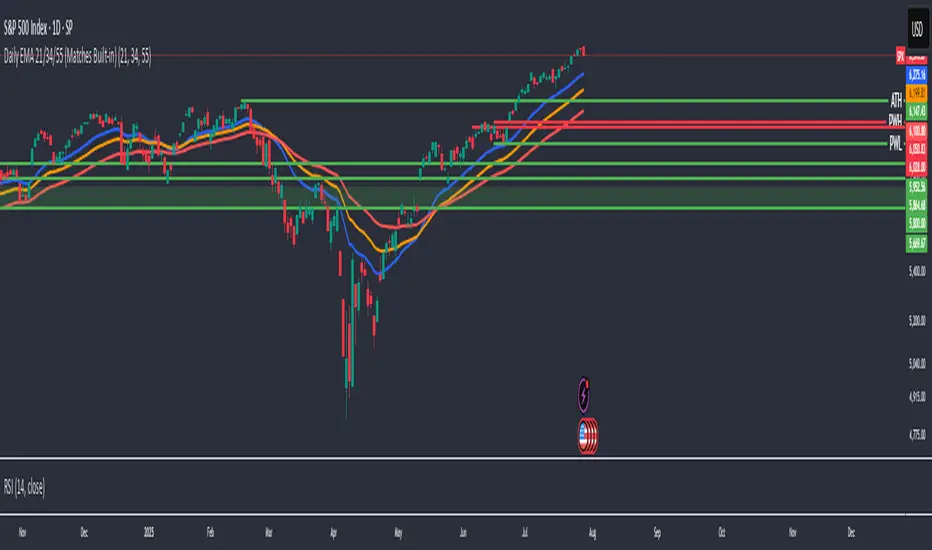
Daily EMA-21/34/50The EMAs and color coding can be changed, by default it contains 21/34/50 on Daily, The script can be edited to suit the timeframe whichever wanted
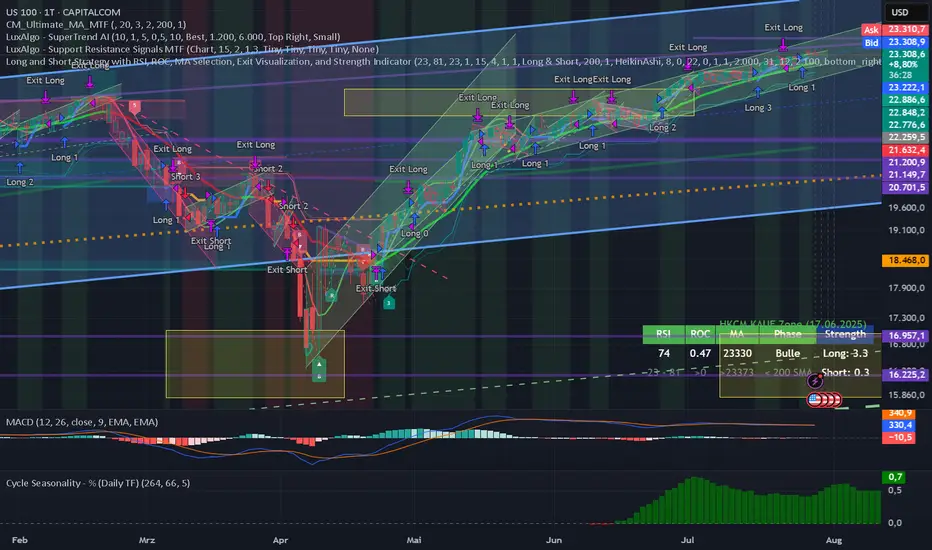
Long and Short Strategy with Multi Indicators [B1P5]Long and Short Strategy with RSI, ROC, MA Selection, Exit Visualization, and Strength Indicator
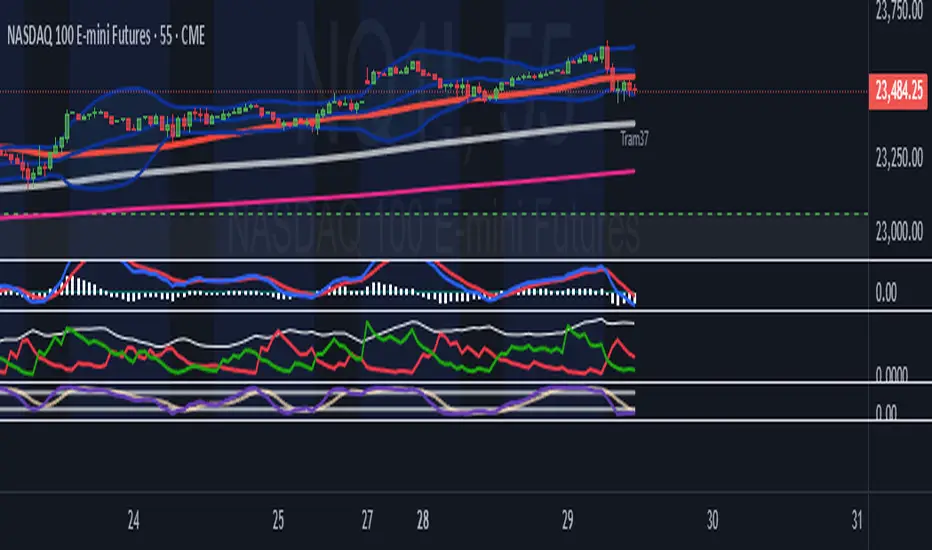
Tram37This indicator calculates and plots a 377-day Simple Moving Average (SMA) based on the closing price, designed for long-term trend analysis. The fixed 377-day period helps smooth out short-term fluctuations, providing a clear view of the underlying trend for long-term trading or investment strategies.
Intraday Bullish Scanner - Profit Ping📊 Intraday Bullish Scanner – Profit Ping Only
This custom-built TradingView script identifies high-probability intraday BUY signals on the 15-minute chart, confirmed by volume, momentum, and price action. It uses:
✅ EMA 7/14 crossovers
✅ Bullish candlestick patterns (Engulfing, Piercing, etc.)
✅ Volume spikes above 20-MA
✅ RSI between 55–65
✅ MACD histogram flip from red to green
✅ Cross-confirmation with the 30-minute trend
Once in a trade, it activates a dynamic trailing stop (starting at 2%, tightening to 1% as profit and volume increase). SELL signals are confirmed only with:
❌ MACD turning red
❌ Bearish RSI movement or drop below 50
❌ EMA 7 crossing below EMA 14
❌ A bearish candlestick (Engulfing or Piercing)
❌ Volume spike on a red candle
💰 When all SELL conditions align, a yellow triangle appears. BUYs are marked with a white triangle. Alerts can be connected directly to Python/webhook systems for full automation with IBKR.

MJBFX-Strategy (Futures Optimized)The MJBFX-Strategy is a complete market mapping tool designed to give traders a clear view of liquidity, session dynamics, and premium/discount levels. It loads automatically on any chart, fully optimized for futures and forex trading.
🔑 Key Features
Asian Session Range
Highlights the previous Asian session with a shaded box
Fixed until London open for precise reference
VWAP from Asian Session
Plots the VWAP of the previous Asian session
Dynamic fair value benchmark for intraday trading
Liquidity Sweeps (Optimized)
Detects sweeps of the Asian session high/low
Shown only on 30m, 1h, and 4h charts to reduce noise
Clean, minimal labels for clarity
Automatic Fibonacci Zone
Draws a shaded retracement zone (38.2%–61.8%) of the Asian range
Transparent fill makes it easy to read price action
Killzones
Highlights London (07:00–10:00) and New York (13:00–16:00) killzones
Semi-opaque shading to keep charts clean
Auto Trade Box (Risk/Reward)
On sweep confirmation, plots a 2R target box
Auto stop loss and take profit levels based on futures tick size
🎯 Why Use It?
The MJBFX-Strategy removes the need for manual drawing.It automatically maps:
Session highs and lows
Liquidity sweeps
VWAP and fib retracement zones
Key killzones
Perfect for session-based intraday trading in both futures and forex.
⚡ No manual settings required.Just load it onto your chart for an instant institutional view of the market.
OI Scalp AnShkjgjkjhghjhjgjgkkjhgkkjhjkjgfdfhhgghghfhfhdfhdffhdfhffhfhdfhgfhgdgfgdhgfgfgdhgfgdhgfdhgfdfhhh
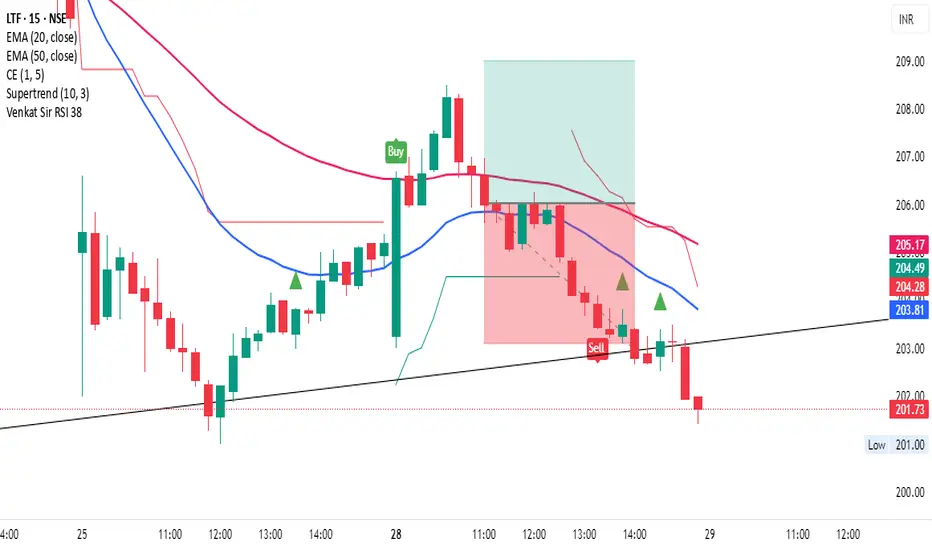
Venkat Sir RSI 38Here's a Pine Script (TradingView) code that does the following:
Uses the RSI indicator (Relative Strength Index).
Watches for RSI crossing below level 38 and then crossing above 38.
When RSI crosses above 38 (after having gone below), it plots a green triangle-up symbol above the candle that triggered the cross.
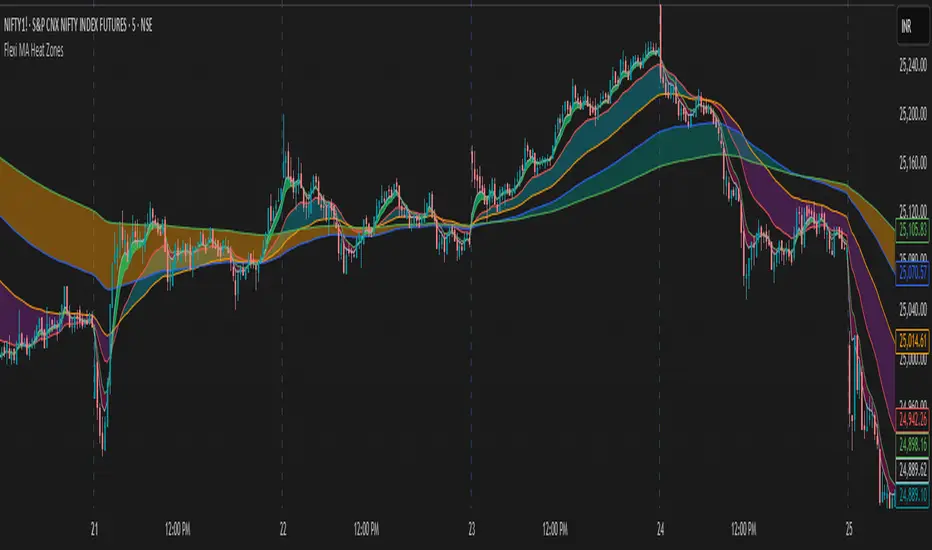
Flexi MA Heat ZonesOverview
Flexi MA Heat Zones is a powerful multi-timeframe visualization tool that helps traders easily identify trend strength, direction, and potential zones of confluence using multiple moving averages and dynamic heatmaps. The indicator plots up to three pairs of customizable moving averages, with color-coded heat zones to highlight bullish and bearish conditions at a glance.
Whether you're a trend follower, mean-reversion trader, or looking for visual confirmation zones, this indicator is designed to offer deep insights with high customizability.
⚙️ Key Features
🔄 Supports multiple MA types: Choose from EMA, SMA, WMA, VWMA to suit your strategy.
🎯 Six moving averages: Three MA pairs (MA1-MA2, MA3-MA4, MA5-MA6), each with independent lengths and colors.
🌈 Heatmap Zones: Dynamic fills between MA pairs, changing color based on bullish or bearish alignment.
👁️🗨️ Full customization: Enable/disable any MA pair and its heatmap zone from the settings.
🪞 Transparency controls: Adjust the visibility of heat zones for clarity or stylistic preference.
🎨 Color-coded for clarity: Bullish and bearish colors for each heat zone pair, fully user-configurable.
🧩 Efficient layout: Smart use of grouped inputs for easier configuration and visibility management.
📈 How to Use
Use the MA1–MA2 and MA3–MA4 zones for longer-term trend tracking and confluence analysis.
Use the faster MA5–MA6 zone for short-term micro-trend identification or scalping.
When a faster MA is above the slower one within a pair, the fill turns bullish (user-defined color).
When the faster MA is below the slower one, the fill turns bearish.
Combine with price action or other indicators for entry/exit confirmation.
🧠 Pro Tips
For trend-following strategies, consider using EMA or WMA types.
For mean-reversion or support/resistance zones, SMA and VWMA may offer better zone clarity.
Overlay with RSI, MACD, or custom entry signals for higher confidence setups.
Use different heatmap transparencies to visually separate overlapping MA zones.
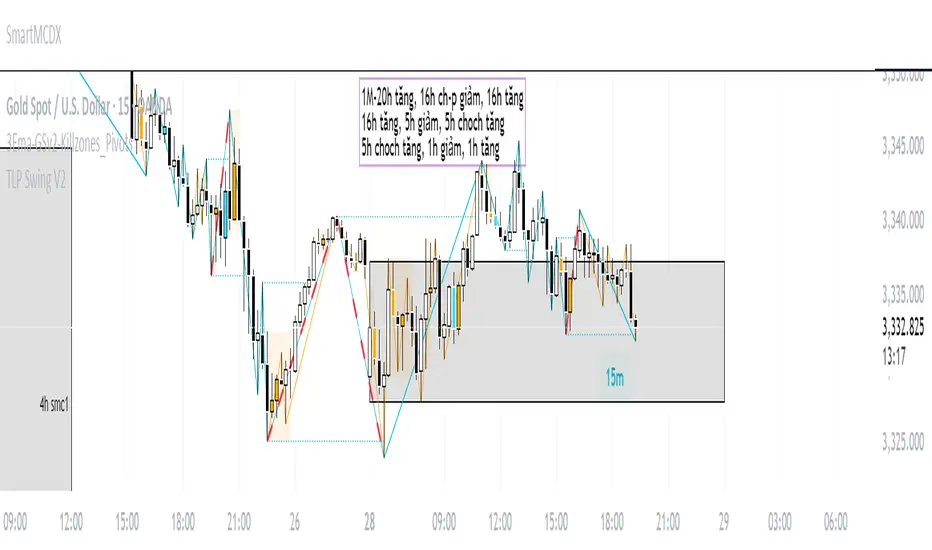
TLP Swing Chart V2thanks
// This source code is subject to the terms of the Mozilla Public License 2.0 at mozilla.org
// Sửa đổi trên code gốc của © meomeo105
// © meomeo105
//@version=5
indicator('TLP Swing Chart V2', shorttitle='TLP Swing V2', overlay=true, max_lines_count=500)
//-----Input-------
customTF = input.timeframe(defval="",title = "Show Other TimeFrame")
showTLP = input.bool(false, 'Show TLP', inline = "TLP1")
colorTLP = input.color(color.aqua, '', inline = "TLP1")
showSTLP = input.bool(true, 'Show TLP Swing', inline = "Swing1")
colorSTLP = input.color(color.aqua, '', inline = "Swing1")
showLabel = input.bool(true, 'Show Label TimeFrame')
lineSTLP = input.string(title="",options= ,defval="(─)", inline = "Swing1")
lineStyleSTLP = lineSTLP == "(┈)" ? line.style_dotted : lineSTLP == "(╌)" ? line.style_dashed : line.style_solid
//IOSB
IOSB = "TLPInOutSideBarSetting"
ISB = input(true,group =IOSB, title="showISB")
colorISB = input.color(color.rgb(250, 171, 0), inline = "ISB")
OSB = input(true,group =IOSB, title="showOSB")
colorOSB = input.color(color.rgb(56, 219, 255), inline = "OSB")
ZoneColor = input(defval = color.new(color.orange, 90),group =IOSB, title = "Background Color")
BorderColor = input(defval = color.new(color.orange, 100),group =IOSB, title = "Border Color")
/////////////////
var aCZ = array.new_float(0)
float highest = high
float lowest = low
if (array.size(aCZ) > 0)
highest := array.get(aCZ, 0)
lowest := array.get(aCZ, 1)
insideBarCondtion = low >= lowest and low <= highest and high >= lowest and high <= highest
if ( insideBarCondtion == true )
array.push(aCZ, high )
array.push(aCZ, low )
if( array.size(aCZ) >= 2 and insideBarCondtion == false )
float maxCZ = array.max(aCZ)
float minCZ = array.min(aCZ)
box.new(bar_index - (array.size(aCZ) / 2) - 1, maxCZ, bar_index - 1, minCZ, bgcolor = ZoneColor, border_color = BorderColor)
array.clear(aCZ)
//////////////////////////Global//////////////////////////
var arrayLineTemp = array.new_line()
// Funtion
f_resInMinutes() =>
_resInMinutes = timeframe.multiplier * (
timeframe.isseconds ? 1. / 60. :
timeframe.isminutes ? 1. :
timeframe.isdaily ? 1440. :
timeframe.isweekly ? 10080. :
timeframe.ismonthly ? 43800. : na)
// Converts a resolution expressed in minutes into a string usable by "security()"
f_resFromMinutes(_minutes) =>
_minutes < 1 ? str.tostring(math.round(_minutes*60)) + "S" :
_minutes < 60 ? str.tostring(math.round(_minutes)) + "m" :
_minutes < 1440 ? str.tostring(math.round(_minutes/60)) + "H" :
_minutes < 10080 ? str.tostring(math.round(math.min(_minutes / 1440, 7))) + "D" :
_minutes < 43800 ? str.tostring(math.round(math.min(_minutes / 10080, 4))) + "W" :
str.tostring(math.round(math.min(_minutes / 43800, 12))) + "M"
f_tfRes(_res,_exp) =>
request.security(syminfo.tickerid,_res,_exp,lookahead=barmerge.lookahead_on)
var label labelError = label.new(bar_index, high, text = "", color = #00000000, textcolor = color.white,textalign = text.align_left)
sendError(_mmessage) =>
label.set_xy(labelError, bar_index + 3, close )
label.set_text(labelError, _mmessage)
var arrayLineChoCh = array.new_line()
var label labelTF = label.new(time, close, text = "",color = color.new(showSTLP ? colorSTLP : colorTLP,95), textcolor = showSTLP ? colorSTLP : colorTLP,xloc = xloc.bar_time, textalign = text.align_left)
//////////////////////////TLP//////////////////////////
var arrayXTLP = array.new_int(5,time)
var arrayYTLP = array.new_float(5,close)
var arrayLineTLP = array.new_line()
int drawLineTLP = 0
_high = high
_low = low
_close = close
_open = open
if(customTF != timeframe.period)
_high := f_tfRes(customTF,high)
_low := f_tfRes(customTF,low)
_close := f_tfRes(customTF,close)
_open := f_tfRes(customTF,open)
highPrev = _high
lowPrev = _low
// drawLineTLP => 2:Tiếp tục 1:Đảo chiều; // Outsidebar 2:Tiếp tục 3:Tiếp tục và Đảo chiều 4 : Đảo chiều 2 lần
drawLineTLP := 0
if(_high > highPrev and _low > lowPrev )
if(array.get(arrayYTLP,0) > array.get(arrayYTLP,1))
if(_high <= high)
array.set(arrayXTLP, 0, time)
array.set(arrayYTLP, 0, _high )
drawLineTLP := 2
else
array.unshift(arrayXTLP,time)
array.unshift(arrayYTLP,_high )
drawLineTLP := 1
else if(_high < highPrev and _low < lowPrev )
if(array.get(arrayYTLP,0) > array.get(arrayYTLP,1))
array.unshift(arrayXTLP,time)
array.unshift(arrayYTLP,_low )
drawLineTLP := 1
else
if(_low >= low)
array.set(arrayXTLP, 0, time)
array.set(arrayYTLP, 0, _low )
drawLineTLP := 2
else if(_high >= highPrev and _low < lowPrev or _high > highPrev and _low <= lowPrev )
if(array.get(arrayYTLP,0) > array.get(arrayYTLP,1))
if(_high >= array.get(arrayYTLP,0) and array.get(arrayYTLP,1) < _low )
if(_high <= high)
array.set(arrayXTLP, 0, time)
array.set(arrayYTLP, 0, _high )
drawLineTLP := 2
else if(_high >= array.get(arrayYTLP,0) and array.get(arrayYTLP,1) > _low )
if(_close < _open)
if(_high <= high)
array.set(arrayXTLP, 0, time)
array.set(arrayYTLP, 0, _high )
array.unshift(arrayXTLP,time)
array.unshift(arrayYTLP,_low )
drawLineTLP := 3
else
array.unshift(arrayXTLP,time)
array.unshift(arrayYTLP,_low )
array.unshift(arrayXTLP,time)
array.unshift(arrayYTLP,_high )
drawLineTLP := 4
else if(array.get(arrayYTLP,0) < array.get(arrayYTLP,1))
if(_low <= array.get(arrayYTLP,0) and _high < array.get(arrayYTLP,1))
if(_low >= low)
array.set(arrayXTLP, 0, time)
array.set(arrayYTLP, 0, _low )
drawLineTLP := 2
else if(_low <= array.get(arrayYTLP,0) and _high > array.get(arrayYTLP,1))
if(_close > _open)
if(_low >= low)
array.set(arrayXTLP, 0, time)
array.set(arrayYTLP, 0, _low )
array.unshift(arrayXTLP,time)
array.unshift(arrayYTLP,_high )
drawLineTLP := 3
else
array.unshift(arrayXTLP,time)
array.unshift(arrayYTLP,_high )
array.unshift(arrayXTLP,time)
array.unshift(arrayYTLP,_low )
drawLineTLP := 4
else if((_high <= highPrev and _low >= lowPrev ))
highPrev := highPrev
lowPrev := lowPrev
if(f_resInMinutes() < f_tfRes(customTF,f_resInMinutes()) and drawLineTLP == 0)
if(array.get(arrayYTLP,0) > array.get(arrayYTLP,1))
if(array.get(arrayYTLP,0) <= high)
array.set(arrayXTLP, 0, time)
drawLineTLP := 2
else
if(array.get(arrayYTLP,0) >= low)
array.set(arrayXTLP, 0, time)
drawLineTLP := 2
if((showSTLP or showTLP) and f_resInMinutes() <= f_tfRes(customTF,f_resInMinutes()))
if(drawLineTLP == 2)
if(array.size(arrayLineTLP) >0)
line.set_xy2(array.get(arrayLineTLP,0),array.get(arrayXTLP,0),array.get(arrayYTLP,0))
else
array.unshift(arrayLineTLP,line.new(array.get(arrayXTLP,1),array.get(arrayYTLP,1),array.get(arrayXTLP,0),array.get(arrayYTLP,0), color = colorTLP,xloc = xloc.bar_time, style = lineStyleSTLP))
else if(drawLineTLP == 1)
array.unshift(arrayLineTLP,line.new(array.get(arrayXTLP,1),array.get(arrayYTLP,1),array.get(arrayXTLP,0),array.get(arrayYTLP,0), color = colorTLP,xloc = xloc.bar_time, style = lineStyleSTLP))
else if(drawLineTLP == 3)
if(array.size(arrayLineTLP) >0)
line.set_xy2(array.get(arrayLineTLP,0),array.get(arrayXTLP,1),array.get(arrayYTLP,1))
else
array.unshift(arrayLineTLP,line.new(array.get(arrayXTLP,2),array.get(arrayYTLP,2),array.get(arrayXTLP,1),array.get(arrayYTLP,1), color = colorTLP,xloc = xloc.bar_time, style = lineStyleSTLP))
array.unshift(arrayLineTLP,line.new(array.get(arrayXTLP,1),array.get(arrayYTLP,1),array.get(arrayXTLP,0),array.get(arrayYTLP,0), color = colorTLP,xloc = xloc.bar_time, style = lineStyleSTLP))
else if(drawLineTLP == 4)
array.unshift(arrayLineTLP,line.new(array.get(arrayXTLP,2),array.get(arrayYTLP,2),array.get(arrayXTLP,1),array.get(arrayYTLP,1), color = colorTLP,xloc = xloc.bar_time, style = lineStyleSTLP))
array.unshift(arrayLineTLP,line.new(array.get(arrayXTLP,1),array.get(arrayYTLP,1),array.get(arrayXTLP,0),array.get(arrayYTLP,0), color = colorTLP,xloc = xloc.bar_time, style = lineStyleSTLP))
//////////////////////////Swing TLP//////////////////////////
var arrayXSTLP = array.new_int(5,time)
var arrayYSTLP = array.new_float(5,close)
var arrayLineSTLP = array.new_line()
int drawLineSTLP = 0
int drawLineSTLP1 = 0
if(showSTLP)
if(math.max(array.get(arrayYSTLP,0),array.get(arrayYSTLP,1)) < math.min(array.get(arrayYTLP,0),array.get(arrayYTLP,1)) or math.min(array.get(arrayYSTLP,0),array.get(arrayYSTLP,1)) > math.max(array.get(arrayYTLP,0),array.get(arrayYTLP,1)))
//Khởi tạo bắt đầu
drawLineSTLP1 := 5
array.set(arrayXSTLP, 0, array.get(arrayXTLP,1))
array.set(arrayYSTLP, 0, array.get(arrayYTLP,1))
array.unshift(arrayXSTLP,array.get(arrayXTLP,0))
array.unshift(arrayYSTLP,array.get(arrayYTLP,0))
// drawLineSTLP kiểm tra điểm 1 => 13:Tiếp tục có sóng hồi // 12|19(reDraw):Tiếp tục không có sóng hồi // 14:Đảo chiều
if(array.get(arrayXTLP,0) == array.get(arrayXTLP,1))
if(array.get(arrayXSTLP,0) >= array.get(arrayXTLP,2) and array.get(arrayYSTLP,0) != array.get(arrayYTLP,1) and ((array.get(arrayYTLP,1) > array.get(arrayYTLP,2) and array.get(arrayYSTLP,0) > array.get(arrayYSTLP,1)) or (array.get(arrayYTLP,1) < array.get(arrayYTLP,2) and array.get(arrayYSTLP,0) < array.get(arrayYSTLP,1))))
drawLineSTLP1 := 12
array.set(arrayXSTLP, 0, array.get(arrayXTLP,1))
array.set(arrayYSTLP, 0, array.get(arrayYTLP,1))
else if(array.get(arrayXSTLP,0) <= array.get(arrayXTLP,2))
if((array.get(arrayYSTLP,0) > array.get(arrayYSTLP,1) and array.get(arrayYTLP,1) < array.get(arrayYSTLP,1)) or (array.get(arrayYSTLP,0) < array.get(arrayYSTLP,1) and array.get(arrayYTLP,1) > array.get(arrayYSTLP,1)))
drawLineSTLP1 := 14
array.unshift(arrayXSTLP,array.get(arrayXTLP,1))
array.unshift(arrayYSTLP,array.get(arrayYTLP,1))
else if((array.get(arrayYSTLP,0) > array.get(arrayYSTLP,1) and array.get(arrayYTLP,1) > array.get(arrayYSTLP,0)) or (array.get(arrayYSTLP,0) < array.get(arrayYSTLP,1) and array.get(arrayYTLP,1) < array.get(arrayYSTLP,0)))
drawLineSTLP1 := 13
_max = math.min(array.get(arrayYSTLP,0),array.get(arrayYSTLP,1))
_min = math.max(array.get(arrayYSTLP,0),array.get(arrayYSTLP,1))
_max_idx = 0
_min_idx = 0
for i = 2 to array.size(arrayXTLP)
if(array.get(arrayXSTLP,0) >= array.get(arrayXTLP,i))
break
if(_min > array.get(arrayYTLP,i))
_min := array.get(arrayYTLP,i)
_min_idx := array.get(arrayXTLP,i)
if(_max < array.get(arrayYTLP,i))
_max := array.get(arrayYTLP,i)
_max_idx := array.get(arrayXTLP,i)
if(array.get(arrayYSTLP,0) > array.get(arrayYSTLP,1))
array.unshift(arrayXSTLP,_min_idx)
array.unshift(arrayYSTLP,_min)
else if(array.get(arrayYSTLP,0) < array.get(arrayYSTLP,1))
array.unshift(arrayXSTLP,_max_idx)
array.unshift(arrayYSTLP,_max)
array.unshift(arrayXSTLP,array.get(arrayXTLP,1))
array.unshift(arrayYSTLP,array.get(arrayYTLP,1))
if(f_resInMinutes() < f_tfRes(customTF,f_resInMinutes()))
if(array.get(arrayYSTLP,0) == array.get(arrayYTLP,1) and array.get(arrayXSTLP,0) != array.get(arrayXTLP,1))
array.set(arrayXSTLP, 0, array.get(arrayXTLP,1))
drawLineSTLP1 := 19
if(f_resInMinutes() <= f_tfRes(customTF,f_resInMinutes()))
if(drawLineSTLP1 == 12 or drawLineSTLP1 == 19)
if(array.size(arrayLineSTLP) >0)
line.set_xy2(array.get(arrayLineSTLP,0),array.get(arrayXSTLP,0),array.get(arrayYSTLP,0))
else
array.unshift(arrayLineSTLP,line.new(array.get(arrayXSTLP,1),array.get(arrayYSTLP,1),array.get(arrayXSTLP,0),array.get(arrayYSTLP,0), color = colorSTLP,xloc = xloc.bar_time))
else if(drawLineSTLP1 == 14)
array.unshift(arrayLineSTLP,line.new(array.get(arrayXSTLP,1),array.get(arrayYSTLP,1),array.get(arrayXSTLP,0),array.get(arrayYSTLP,0), color = colorSTLP,xloc = xloc.bar_time))
else if(drawLineSTLP1 == 13)
array.unshift(arrayLineSTLP,line.new(array.get(arrayXSTLP,2),array.get(arrayYSTLP,2),array.get(arrayXSTLP,1),array.get(arrayYSTLP,1), color = colorSTLP,xloc = xloc.bar_time))
array.unshift(arrayLineSTLP,line.new(array.get(arrayXSTLP,1),array.get(arrayYSTLP,1),array.get(arrayXSTLP,0),array.get(arrayYSTLP,0), color = colorSTLP,xloc = xloc.bar_time))
else if(drawLineSTLP1 == 15)
if(array.size(arrayLineSTLP) >0)
line.set_xy2(array.get(arrayLineSTLP,0),array.get(arrayXSTLP,1),array.get(arrayYSTLP,1))
else
array.unshift(arrayLineSTLP,line.new(array.get(arrayXSTLP,2),array.get(arrayYSTLP,2),array.get(arrayXSTLP,1),array.get(arrayYSTLP,1), color = colorSTLP,xloc = xloc.bar_time))
array.unshift(arrayLineSTLP,line.new(array.get(arrayXSTLP,1),array.get(arrayYSTLP,1),array.get(arrayXSTLP,0),array.get(arrayYSTLP,0), color = colorSTLP,xloc = xloc.bar_time))
// drawLineSTLP kiểm tra điểm 0 => 3:Tiếp tục có sóng hồi // 2|9(reDraw):Tiếp tục không có sóng hồi // 4:Đảo chiều
if(array.get(arrayXSTLP,0) >= array.get(arrayXTLP,1) and array.get(arrayYSTLP,0) != array.get(arrayYTLP,0) and ((array.get(arrayYTLP,0) > array.get(arrayYTLP,1) and array.get(arrayYSTLP,0) > array.get(arrayYSTLP,1)) or (array.get(arrayYTLP,0) < array.get(arrayYTLP,1) and array.get(arrayYSTLP,0) < array.get(arrayYSTLP,1))))
drawLineSTLP := 2
array.set(arrayXSTLP, 0, array.get(arrayXTLP,0))
array.set(arrayYSTLP, 0, array.get(arrayYTLP,0))
else if(array.get(arrayXSTLP,0) <= array.get(arrayXTLP,1))
if((array.get(arrayYSTLP,0) > array.get(arrayYSTLP,1) and array.get(arrayYTLP,0) < array.get(arrayYSTLP,1)) or (array.get(arrayYSTLP,0) < array.get(arrayYSTLP,1) and array.get(arrayYTLP,0) > array.get(arrayYSTLP,1)))
drawLineSTLP := 4
array.unshift(arrayXSTLP,array.get(arrayXTLP,0))
array.unshift(arrayYSTLP,array.get(arrayYTLP,0))
else if((array.get(arrayYSTLP,0) > array.get(arrayYSTLP,1) and array.get(arrayYTLP,0) > array.get(arrayYSTLP,0)) or (array.get(arrayYSTLP,0) < array.get(arrayYSTLP,1) and array.get(arrayYTLP,0) < array.get(arrayYSTLP,0)))
drawLineSTLP := 3
_max = math.min(array.get(arrayYSTLP,0),array.get(arrayYSTLP,1))
_min = math.max(array.get(arrayYSTLP,0),array.get(arrayYSTLP,1))
_max_idx = 0
_min_idx = 0
for i = 1 to array.size(arrayXTLP)
if(array.get(arrayXSTLP,0) >= array.get(arrayXTLP,i))
break
if(_min > array.get(arrayYTLP,i))
_min := array.get(arrayYTLP,i)
_min_idx := array.get(arrayXTLP,i)
if(_max < array.get(arrayYTLP,i))
_max := array.get(arrayYTLP,i)
_max_idx := array.get(arrayXTLP,i)
if(array.get(arrayYSTLP,0) > array.get(arrayYSTLP,1))
array.unshift(arrayXSTLP,_min_idx)
array.unshift(arrayYSTLP,_min)
else if(array.get(arrayYSTLP,0) < array.get(arrayYSTLP,1))
array.unshift(arrayXSTLP,_max_idx)
array.unshift(arrayYSTLP,_max)
array.unshift(arrayXSTLP,array.get(arrayXTLP,0))
array.unshift(arrayYSTLP,array.get(arrayYTLP,0))
if(f_resInMinutes() < f_tfRes(customTF,f_resInMinutes()))
if(array.get(arrayYSTLP,0) == array.get(arrayYTLP,0) and array.get(arrayXSTLP,0) != array.get(arrayXTLP,0))
array.set(arrayXSTLP, 0, array.get(arrayXTLP,0))
drawLineSTLP := 9
if(f_resInMinutes() <= f_tfRes(customTF,f_resInMinutes()))
if(drawLineSTLP == 2 or drawLineSTLP == 9)
if(array.size(arrayLineSTLP) >0)
line.set_xy2(array.get(arrayLineSTLP,0),array.get(arrayXSTLP,0),array.get(arrayYSTLP,0))
else
array.unshift(arrayLineSTLP,line.new(array.get(arrayXSTLP,1),array.get(arrayYSTLP,1),array.get(arrayXSTLP,0),array.get(arrayYSTLP,0), color = colorSTLP,xloc = xloc.bar_time))
else if(drawLineSTLP == 4)
array.unshift(arrayLineSTLP,line.new(array.get(arrayXSTLP,1),array.get(arrayYSTLP,1),array.get(arrayXSTLP,0),array.get(arrayYSTLP,0), color = colorSTLP,xloc = xloc.bar_time))
else if(drawLineSTLP == 3)
array.unshift(arrayLineSTLP,line.new(array.get(arrayXSTLP,2),array.get(arrayYSTLP,2),array.get(arrayXSTLP,1),array.get(arrayYSTLP,1), color = colorSTLP,xloc = xloc.bar_time))
array.unshift(arrayLineSTLP,line.new(array.get(arrayXSTLP,1),array.get(arrayYSTLP,1),array.get(arrayXSTLP,0),array.get(arrayYSTLP,0), color = colorSTLP,xloc = xloc.bar_time))
else if(drawLineSTLP == 5)
if(array.size(arrayLineSTLP) >0)
line.set_xy2(array.get(arrayLineSTLP,0),array.get(arrayXSTLP,1),array.get(arrayYSTLP,1))
else
array.unshift(arrayLineSTLP,line.new(array.get(arrayXSTLP,2),array.get(arrayYSTLP,2),array.get(arrayXSTLP,1),array.get(arrayYSTLP,1), color = colorSTLP,xloc = xloc.bar_time))
array.unshift(arrayLineSTLP,line.new(array.get(arrayXSTLP,1),array.get(arrayYSTLP,1),array.get(arrayXSTLP,0),array.get(arrayYSTLP,0), color = colorSTLP,xloc = xloc.bar_time))
///////////////////////Other//////////////////////////////////
if(f_resInMinutes() <= f_tfRes(customTF,f_resInMinutes()))
if(showSTLP)
if(showLabel and (barstate.islast or barstate.islastconfirmedhistory))
texLabel = f_resInMinutes() == f_tfRes(customTF,f_resInMinutes()) ? f_resFromMinutes(f_resInMinutes()) : f_resFromMinutes(f_tfRes(customTF,f_resInMinutes()))
label.set_xy(labelTF,array.get(arrayXSTLP,0),array.get(arrayYSTLP,0))
label.set_text(labelTF,texLabel)
label.set_style(labelTF,array.get(arrayYSTLP,0) < array.get(arrayYSTLP,1) ? label.style_label_upper_right : label.style_label_lower_right)
if(not showTLP)
arrayLineTemp := array.copy(arrayLineTLP)
for itemArray in arrayLineTemp
if(line.get_x1(itemArray) < array.get(arrayXSTLP,0))
line.delete(itemArray)
array.remove(arrayLineTLP,array.indexof(arrayLineTLP, itemArray))
//Inside Bars - Outside Bars
insideBar() => ISB and high <= high and low >= low ? 1 : 0
outsideBar() => OSB and (high > high and low < low ) ? 1 : 0
//Inside and Outside Bars
barcolor(insideBar() ? color.new(colorISB,0) : na )
barcolor(outsideBar() ? color.new(colorOSB,0) : na )
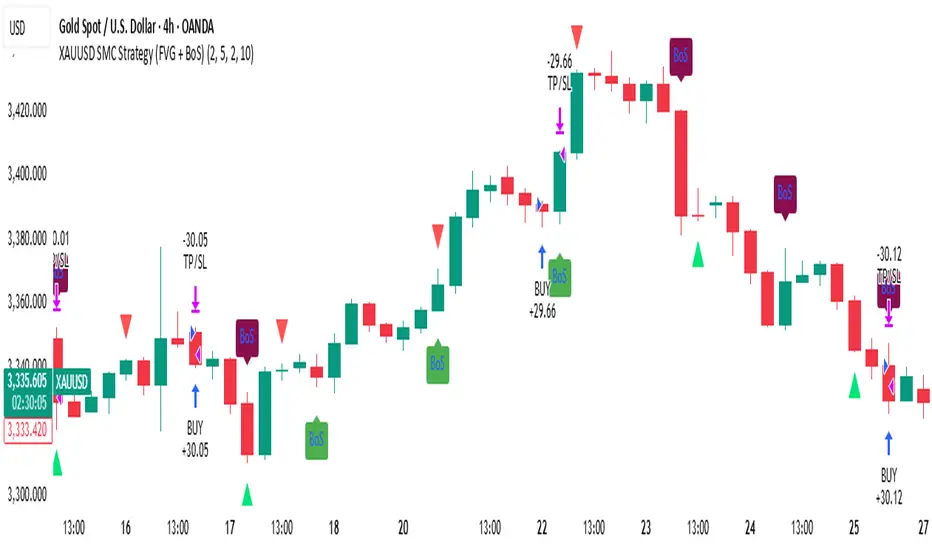
XAUUSD SMC Strategy (FVG + BoS)This advanced TradingView strategy is built for serious traders who follow Smart Money Concepts (SMC), with a special focus on Fair Value Gaps (FVG) and Break of Structure (BoS). The script automates trade entries and visual signals based on clean price action, while also allowing for performance backtesting through the built-in Strategy Tester.
The purpose of this script is to combine high-probability SMC signals with a clear and flexible backtest engine. Traders can visually confirm institutional moves (like imbalances and structure breaks) while simultaneously analyzing strategy performance, risk-reward, and execution logic — all from one chart.
⚙️ Key Features
FVG Detection: Automatically identifies bullish and bearish fair value gaps, highlighting imbalance zones between institutional buying and selling activity.
Break of Structure (BoS): Clearly shows bullish and bearish structure breaks, helping traders confirm directional bias and spot trend shifts with clarity.
Trade Execution Logic: Designed with actual strategy.entry() and strategy.exit() functions, this script simulates trades using risk-controlled logic with stop loss and take profit targeting.
Spaced Signal Visualization: Avoids chart clutter by spacing FVG and BoS signals, making the visual output clean and readable — even on fast-moving charts like XAUUSD.
Risk-Reward Customization: Easily set your own risk:reward ratio and stop-loss buffer, ensuring each trade is simulated according to your personal strategy or trading plan.
Cool-Down System: Add a delay between trades using the “Bars Between Trades” setting to prevent overtrading during volatile periods.
Live and Historical Insights: Signals appear in real-time, while also being plotted historically — making it easy to scroll back and study how the market behaved under this logic.
Fully Editable Parameters: Customize FVG size, structure lookback, spacing intervals, and more to fit your unique interpretation of SMC methodology.
🧠 How It Works
This strategy combines two key concepts:
FVG (Fair Value Gaps): Price zones where the market moved too quickly and left an imbalance between buyers and sellers. These gaps often act as magnets for price or areas of reversal.
BoS (Break of Structure): Points where the price breaks through a significant high or low, indicating a potential shift in market direction.
When both FVG and BoS align under certain conditions — and the cooldown requirement is satisfied — the strategy places a trade. A take profit and stop loss are automatically applied based on your inputs.
📈 Practical Use Cases
Trend Confirmation: Use BoS signals to validate trend continuation trades, especially when FVG confirms the imbalance.
Reversal Zones: Spot potential turning points when price fills an FVG and breaks previous structure in the opposite direction.
Backtest SMC Logic: Validate your theory by testing this strategy over historical XAUUSD data using real stop loss / take profit logic.
Refine Entry Timing: Study how structure breaks and FVGs align in different timeframes to improve entry precision.
💡 Best For
Traders learning or mastering Smart Money Concepts
Price action purists who avoid indicators
XAUUSD scalpers, day traders, or swing traders
Strategy developers who want visual + backtested confirmation
📌 Notes
The default strategy places trades every 10 candles to ensure the engine runs — replace this with your refined FVG + BoS logic as needed.
Works best on Gold (XAUUSD) 4H, 1H, or 15m timeframes depending on volatility and structure spacing.
🔒 Disclaimer
This strategy is for educational purposes only. It does not constitute financial advice. Always test and validate any trading logic before applying it to a live market. Trading carries risk — use proper risk management.
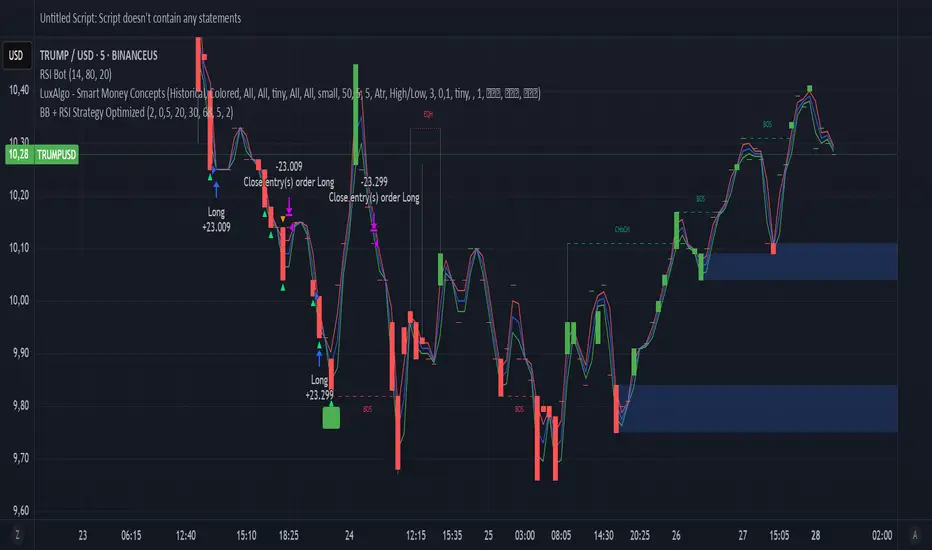
BB + RSI Strategy Optimized✅ Pine Script Version 5
✅ Complete Strategy: Long + Short
✅ Automatic Entry and Exit
✅ Visual Signals: Buy/Sell, Short/Cover
✅ Trailing Take Profit
✅ Progressive
🧠 Blackbox Alpha v6 (Buy/Sell Only)Blackbox Alpha v6 Strategy – Institutional-Grade Intraday Trading
Overview:
The Blackbox Alpha v6 is a precision-engineered intraday trading strategy inspired by the world's top 0.1% traders — including philosophies from Jim Simons, Mark Minervini, Stefan Salomon, and Stanley Druckenmiller. It is designed to deliver ultra-high-probability Buy/Sell signals by using a multi-layered confirmation model that runs entirely in the background. Only confirmed signals appear on the chart – no noise, no clutter.
🔍 Core Strategy Logic
This strategy generates a Buy or Sell entry only when all of the following conditions are met:
✅ Trend Confirmation
EMA 20 > EMA 50 (bullish trend)
ADX > 20 (trend strength)
RSI confirms momentum direction
📊 Volume Validation
Volume spike above 20-period average × multiplier
Volume Climax (highest volume in last 10 candles)
Relative Volume Index (RVI) > 1.5
🎯 Price Structure + Pattern Recognition
Price near Fibonacci retracement zones (0.382 for Buy, 0.618 for Sell)
Bullish/Bearish engulfing candle pattern as trigger
🧠 Institutional Bias
Price must be above Anchored VWAP (Buy) or below (Sell)
Must be within predefined order block zones (smart money behavior)
📈 Signal Behavior
Buy Signal: Only appears when all trend, volume, price action, and institutional filters confirm.
Sell Signal: Same logic, mirrored for bearish market conditions.
Visualization: Minimalist – only Buy (green triangle) and Sell (red triangle) arrows.
🧪 Backtest Engine
Fully integrated with strategy.entry, strategy.close, stop and limit execution logic
User-configurable stop-loss and take-profit in %
Optimized for 15m, 1h, and 1D charts
🚀 Performance Philosophy
Rather than generating many signals, this strategy targets very selective, high-probability trades with asymmetric reward-to-risk opportunities — exactly like institutional traders and quant funds.
Ideal for traders seeking signal precision > signal frequency.

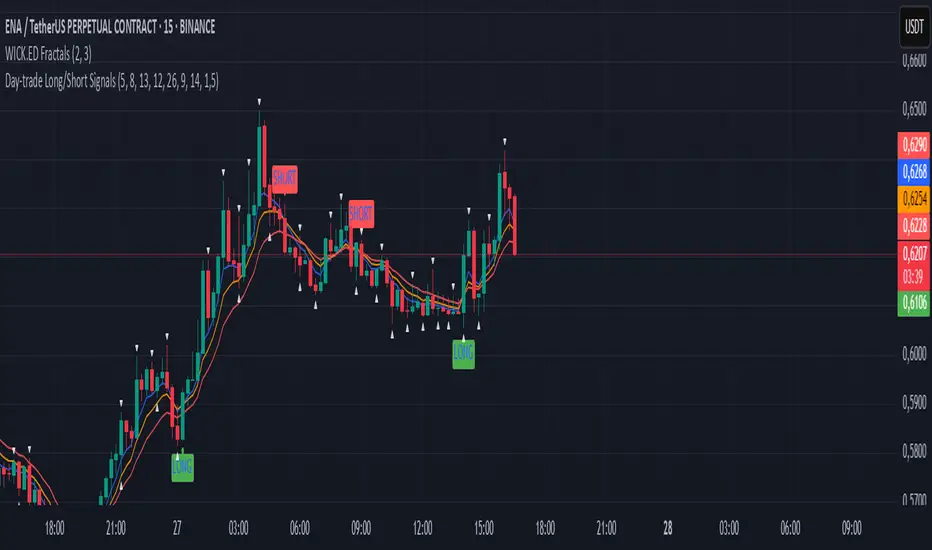
Day‑trade Long/Short Signalsday trade Long\Short signals idskator
Displays EMA 5, 8, and 13 to track the trend.
Signals LONG when EMA5 crosses above EMA8 and the MACD line is above the signal line.
Signals SHORT when EMA5 crosses below EMA8 and the MACD line is below the signal line.
Volume in ₹ (Total Traded Value in Crores)vikram dayal volume chart with total traded value in crores

RSI + VWAP Strategy by vipindaskr🔍 This script combines RSI and VWAP for intraday trend-based entries.
✅ *Buy Signal:*
- Price above VWAP
- RSI > 60
- Green background + up triangle shown
❌ *Sell Signal:*
- Price below VWAP
- RSI < 40
- Red background + down triangle shown
📈 Ideal for Nifty 50 intraday traders using 5-minute chart.
Developed by vipindaskr 💻
