RSI & Volume Impact Analyzer Ver.1.00Description:
The RSI VOL Score indicator combines the Relative Strength Index (RSI) and volume data through a mathematical calculation to assist traders in identifying and confirming potential trend reversals and continuations. By leveraging both momentum (RSI) and volume data, this indicator provides a more comprehensive view of market strength compared to using RSI or volume alone.
How It Works:
This indicator calculates a score by comparing the RSI against its moving average, adjusted by the volume data. The resulting score quantifies market momentum and strength. When the score crosses its signal line, it may indicate key moments where the market shifts between bullish and bearish trends, potentially helping traders spot these changes earlier.
Calculation Methods:
The RSI VOL Score allows users to select between several calculation methods to suit their strategy:
SMA (Simple Moving Average): Provides a balanced smoothing approach.
EMA (Exponential Moving Average): Reacts more quickly to recent price changes, offering faster signals.
VWMA (Volume Weighted Moving Average): Emphasizes high-volume periods, focusing on stronger market moves.
WMA (Weighted Moving Average): Applies greater weight to recent data for a more responsive signal.
What the Indicator Plots:
Score Line: Represents a combined metric based on RSI and volume, helping traders gauge the overall strength of the trend.
Signal Line: A smoothed version of the score that helps traders identify potential trend changes. Bullish signals occur when the score crosses above the signal line, while bearish signals occur when the score drops below.
Key Features:
Trend Identification: The score and signal line crossovers can help confirm emerging bullish or bearish trends, allowing traders to act on upward or downward momentum.
Customizable Settings: Traders can adjust the lengths of the RSI and signal line and choose between different moving averages (SMA, EMA, VWMA, WMA) to tailor the indicator to their trading style.
Timeframe-Specific: The indicator works within the selected timeframe, ensuring accurate trend analysis based on the current market context.
Practical Use Cases:
Trending Markets: In trending markets, this indicator helps confirm bullish or bearish signals by validating price moves with volume. Traders can use the crossover of the score and signal line as a guide for entering or exiting trades based on trend strength.
Ranging Markets: In ranging markets, the indicator helps filter out false signals by confirming if price movements are backed by volume, making it a useful tool for traders looking to avoid entering during weak or uncertain market conditions.
Interpreting the Score and Signal Lines:
Bullish Signal: A bullish signal occurs when the score crosses above the signal line, indicating a potential upward trend in momentum and price.
Bearish Signal: A bearish signal is generated when the score crosses below the signal line, suggesting a potential downward trend or weakening market momentum.
By mathematically combining RSI and volume data into a single trend score, the RSI VOL Score indicator provides traders with a powerful tool for identifying trend shifts early and making more confident trading decisions.
Important Note:
The signals generated by this indicator should be interpreted in conjunction with other analysis tools. It is always advisable to confirm signals before making any trading decisions.
Disclaimer:
This indicator is designed to assist traders in their decision-making process and does not provide financial advice. The creators of this tool are not responsible for any financial losses or trading decisions made based on its signals. Trading involves significant risk, and users should seek professional advice or conduct their own research before making any trading decisions.
Buyerstrength

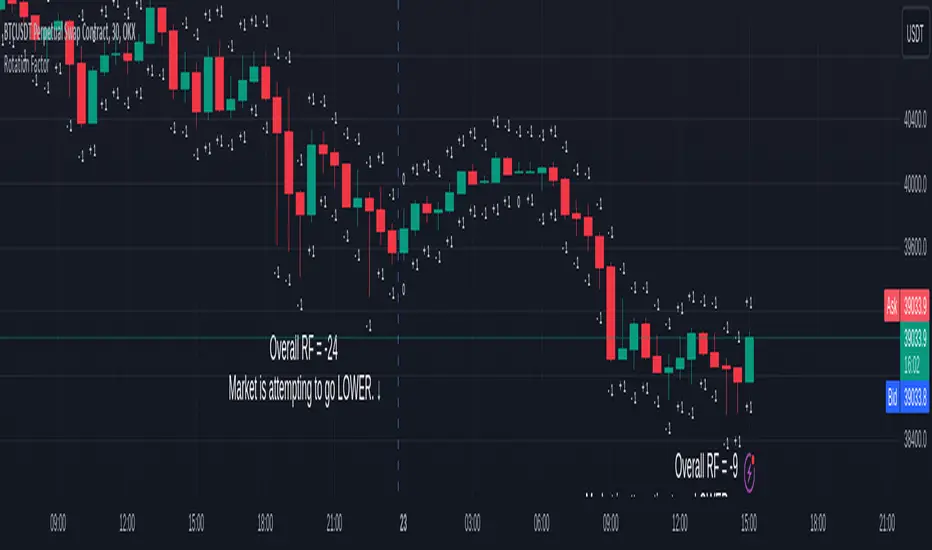
Rotation Factor for TPO and OHLC (Classic)The Rotation Factor objectively measures attempted market direction(or market sentiment) for a given period. It records the cumulative directional attempts of auction rotations within a given period, thus, helping traders determine which way the market is trying to go and which market participant is exerting greater control or influence.
Theory
The premise is that a greater number of bars auctioning higher contrasted to bars auctioning lower indicates that buyers are exerting greater control over price within the given period(usually daily). In this case, the market is attempting to go higher (Market is Bullish). The same is true for a greater number of bars auctioning lower than higher, which, in this case, indicates that the sellers are exerting greater control over price within the given period and that the market is attempting to go lower (Market is Bearish).
Calculation
Each bar is individually measured in relation to the immediate previous bar, and calculations are reset at the beginning of each period.
For every bar, two variables are utilised: One for the highs and another for the lows. During bar start, these variables are initiated at 0.
As the period progresses, these variables are set accordingly: If the high of the current bar is higher than that of the previous bar, then the bar's highs variable is assigned a "+1". If the opposite is true, it is given a "-1". Finally, if both bar highs are equal, it is, instead, assigned a "0". The same is true for the lows: if the low of the current bar is higher than that of the previous low, then the bar's lows variable is assigned a "+1". Similarly, the opposite is given a "-1", while equal lows causes it to be assigned a "0". All highs and lows are then summed together resulting to a total, which becomes the Rotational Factor.
Presentation
Furthermore, this Rotation Factor Indicator is presented as it is calculated, which is the presentation utilised by classic sources (hence the name classic).
Features
1. Customisable Tick Size/Granularity : The calculation tick size/ granularity is customisable which can be accessed through the indicator settings.
2. Customisable Labels : The colour and sizes used by the labels are customisable the better for accessibility.
3. Period Separator : A separator is rendered to represent period borders (start and end). If separators are already present on your chart, you can remove them from the indicator settings.
Works for both split Market Profile(TPO) charts and regular OHLC bars/candle charts
The Rotation Factor is usually used with a Split Market Profile (TPO). However, if no such tool is available, you will still be able to benefit from the Rotation Factor as the price ranges of Split Market Profiles and OHLC bars/candles are one and the same. In such cases, it is recommended that you set your chart to use a 30 minute timeframe and the indicator's period to "daily" to simulate a Split Market Profile.
Note :
The Rotation Factor is, to quote, "by no means not an all-conclusive indication of future market direction.". It only helps determine which way the market is trying to go by objectively measuring the market's directional attempts.