Candle Range Detector by TradeTech AnalysisCandle Range Detector by TradeTech Analysis
This advanced indicator identifies and visualizes price compression zones based on inside bar formations, then tracks how price behaves around those zones — offering valuable insights into liquidity sweeps, range expansions, and trap/mitigation behavior.
The script builds upon the foundational concept of range-based price action, commonly used by institutional traders, and adds automation, mitigation tracking, and sweep detection to map how price reacts around these critical ranges.
🔍 How It Works:
• Range Formation: A new range is detected when the current candle forms entirely within the high and low of the previous candle (i.e., an inside bar). This behavior often indicates price compression and potential breakout zones.
• Range Extension: Once a range is confirmed, the script projects upper and lower boundaries (using either a percentage-based multiplier or Fibonacci log extension), providing context for expected breakout zones.
• Mitigation Tracking: The script continuously monitors whether price breaks above or below the projected extensions, marking that range as mitigated — useful for confirming whether liquidity was absorbed.
• Sweep Detection: If price re-visits a mitigated zone and shows signs of a liquidity sweep (via wick + close behavior), the indicator triggers visual sweep labels and optional alerts.
🧠 Optional Visual Enhancements:
• Highlight range-forming candles with light blue background (toggle on/off)
• Midpoint dotted line for symmetry analysis
• Labels for “Range High” and “Range Low” for visual clarity
• Dynamic box drawing that adapts upon mitigation or continuation
⚙️ Customizable Features:
• Choose between Normal and Fibonacci-based detection modes
• Toggle visibility of range boxes, extension lines, and sweep markers
• Configure sweep alerts, mitigation window size, and visual transparency
⸻
🧪 Use Cases
• Identify consolidation zones before major price moves
• Confirm liquidity sweeps for entry/exit traps
• Visualize and test mitigation behavior of past zones
• Combine with Order Flow or Volume Profile tools to enhance context
⸻
⚠️ This is a fully original implementation that goes beyond classical inside-bar scanners by incorporating mitigation, extension projection, and liquidity sweeps — making it a powerful tool for intraday, swing, and even Smart Money-based trading setups.
Candlerange

Candle Range Theory | Flux Charts💎 GENERAL OVERVIEW
Introducing our new Candle Range Theory Indicator! This powerful tool offers a strategy built around the Candle Range Theory, which analyzes market movements through the relative size and structure of price candles. For more information about the process, check the "HOW DOES IT WORK" section.
Features of the new Candle Range Theory Indicator :
Implementation of the Candle Range Theory
FVG & Order Block Entry Methods
2 Different TP / SL Methods
Customizable Execution Settings
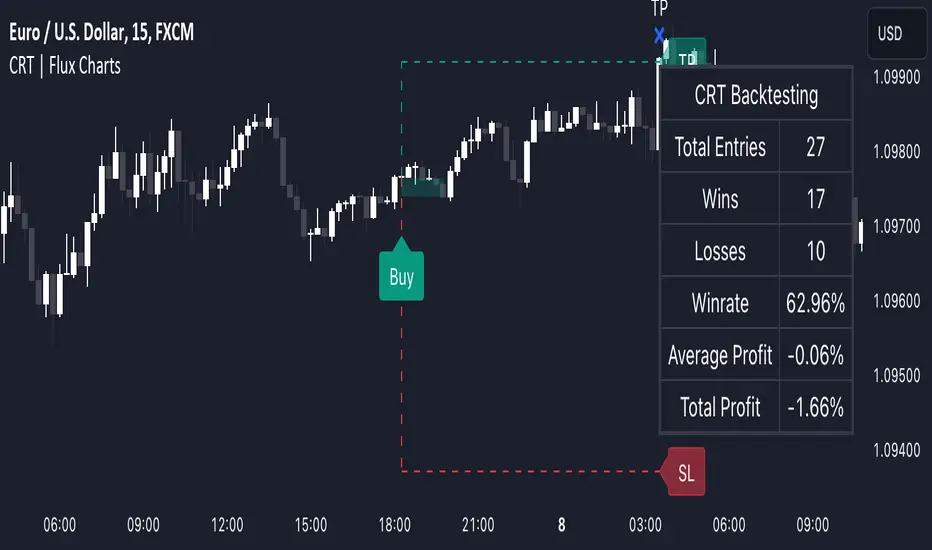
Customizable Backtesting Dashboard
Alerts for Buy, Sell, TP & SL Signals
📌 HOW DOES IT WORK ?
The Candle Range Theory (CRT) indicator operates by identifying significant price movements through the relative size and structure of candlesticks. A key part of the strategy is determining large candles based on their range compared to the Average True Range (ATR) in a higher timeframe. Once identified, a breakout of either the high wick or the low wick of the large candle is required. This breakout is considered a liquidity grab. After that, the indicator waits for confirmation through Fair Value Gaps (FVGs) or Order Blocks (OBs). The confirmation structure must be the opposite direction of the breakout, for example if the high wick is broken, a bearish FVG is required for the short entry. After a confirmation signal is received, the indicator will trigger entry points based on your chosen entry method (FVG or OB), and exit points will be calculated using either a dynamic ATR-based TP/SL method or fixed percentages. Alerts for Buy, Sell, Take-Proft, and Stop-Loss are available.
🚩 UNIQUENESS
This indicator stands out because it combines two highly effective entry methods: Fair Value Gaps (FVGs) and Order Blocks (OBs). You can choose between these strategies depending on market conditions. Additionally, the dynamic TP/SL system uses the ticker's volatility to automatically calculate stop-loss and take-profit targets. The backtesting dashboard provides metrics about the performance of the indicator. You can use it to tune the settings for best use in the current tiker. The Candle Range Theory approach offers more flexibility compared to traditional indicators, allowing for better customization and control based on your risk tolerance.
⚙️ SETTINGS
1. General Configuration
Higher Timeframe: Customize the higher timeframe for analysis. Recommended combinations include M15 -> H4, H4 -> Daily, Daily -> Weekly, and Weekly -> Monthly.
HTF Candle Size: Define the size of the higher timeframe candles as Big, Normal, or Small to filter valid setups based on their range relative to ATR.
Entry Mode: Choose between FVGs and Order Blocks for your entry triggers.
Require Retracement: Enable this option if you want a retracement to the FVG or OB for entry confirmation.
Show HTF Candle Lines: Toggle to display the higher timeframe candle lines for better visual clarity.
2. Fair Value Gaps
FVG Sensitivity: You may select between Low, Normal, High or Extreme FVG detection sensitivity. This will essentially determine the size of the spotted FVGs, with lower sensitivities resulting in spotting bigger FVGs, and higher sensitivities resulting in spotting all sizes of FVGs.
3. Order Blocks
Swing Length: Swing length is used when finding order block formations. Smaller values will result in finding smaller order blocks.
4. TP / SL
TP / SL Method:
a) Dynamic: The TP / SL zones will be auto-determined by the algorithm based on the Average True Range (ATR) of the current ticker.
b) Fixed : You can adjust the exact TP / SL ratios from the settings below.
Dynamic Risk: The risk you're willing to take if "Dynamic" TP / SL Method is selected. Higher risk usually means a better winrate at the cost of losing more if the strategy fails. This setting is has a crucial effect on the performance of the indicator, as different tickers may have different volatility so the indicator may have increased performance when this setting is correctly adjusted.