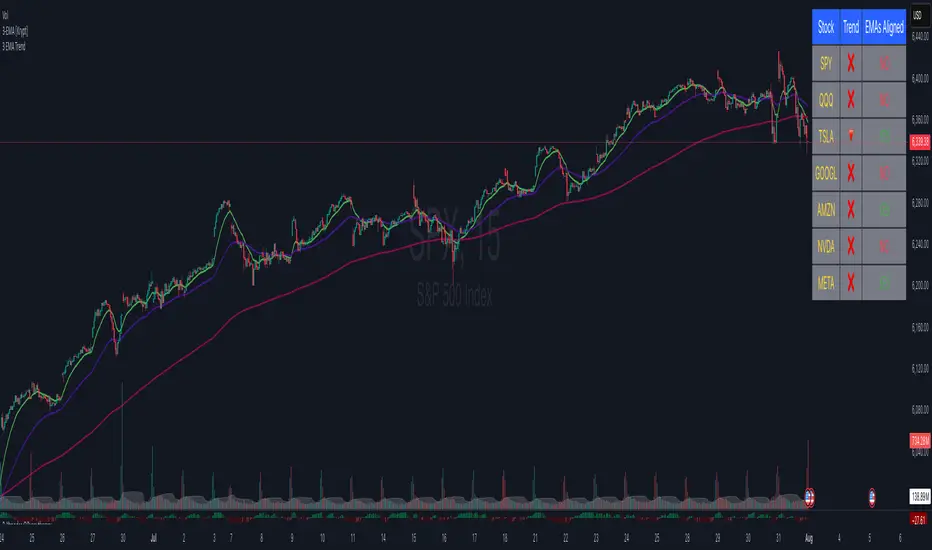
3 EMA cross overThis Pine Script displays the 3 EMA trend status for a list of popular stocks in a dynamic table. It calculates and monitors 13 EMA, 48 EMA, and 200 EMA for each ticker to detect bullish or bearish alignment.
Best Use:
Use this script to quickly scan market trends across multiple stocks and identify potential trade opportunities based on EMA alignment.
Candlestick Analysis
Dual Supertrend tohungmc tikDual Supertrend is an advanced trend-following indicator that combines two Supertrend strategies — a Large Supertrend and a Small Supertrend — to provide you with more precise entry and exit signals.
This indicator plots two Supertrend lines:
Large Supertrend (Blue and Orange): A broader trend that reacts slower to price movements.
Small Supertrend (Green and Red): A faster trend that responds quicker to market changes.
Key Features:
Customizable ATR Periods and Multipliers for both Large and Small Supertrends.
Buy/Sell Signals: When the Small Supertrend trend changes, and it's aligned with the Large Supertrend, you get reliable buy and sell signals.
Highlighting: The background can be highlighted in green or red, depending on whether the Large Supertrend is in an uptrend or downtrend.
Alerts: Alerts can be set for buy/sell signals or when the trend direction changes.
Use Case:
This indicator is designed for traders looking to follow both long-term and short-term trends. By combining the slower Large Supertrend with the faster Small Supertrend, it gives a more comprehensive view of market trends and better entry/exit points.
Indicator Inputs:
ATR Periods and Multipliers: Control how sensitive the Supertrend reacts to market changes.
Highlighting: Enable/Disable background highlighting.
Buy/Sell Signals: Option to show buy/sell signals based on trend direction changes.

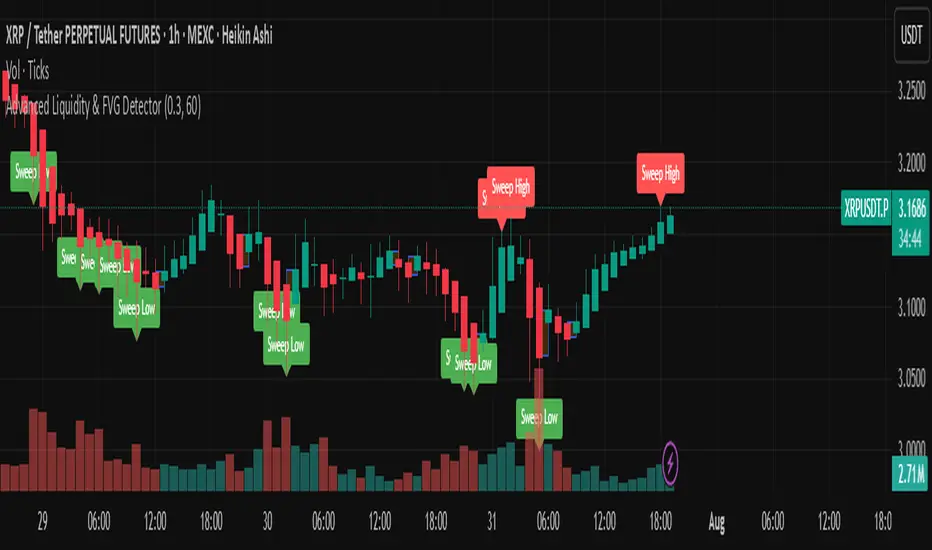
Advanced Liquidity & FVG Detector With Entry/Exit SignalsThe Advanced Liquidity & FVG Detector is more than just an indicator—it's a complete trading system that brings institutional-grade market analysis to individual traders. By combining liquidity detection, fair value gap analysis, sweep/grab pattern recognition, and intelligent risk management, this indicator provides everything needed for sophisticated market analysis and high-probability trading opportunities.
Whether you're a day trader, swing trader, or position trader, this indicator adapts to your style and timeframe, providing the insights needed to make informed trading decisions with confidence. The Pine Script v6 compatibility ensures future-proof performance and seamless integration with the latest TradingView features.
Transform your trading experience with professional-grade market structure analysis—tradable insights delivered in real-time, right on your chart.
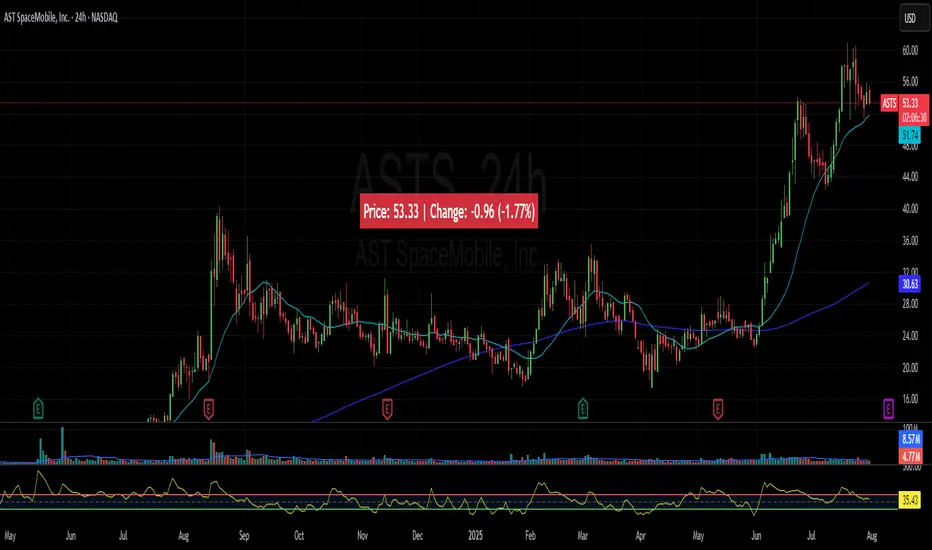
Price Widget on ScreenSimple yet useful script, to see the PRICE/CHANGE of the chart you are on. I use it in my 6/8 charts screen, so you can see the graph and the price.
NativeLenSA CISD w/1st 5m FVG5m CISD + FVG Indicator which works best on 5m TimeFrame, with the concept of 5m Liquidity sweeps of the previous highs/lows and the next candle closing below/above the opening price of candle that swept the highs/lows.
A line marking +CISD or -CISD will show as soon as the CISD is created, and a first 5m Fair Value Gap will also be displayed. This is advantageous for an extra confluence and re-entry.
The indicator also provides the trader with:
i. The flexibility of allowing to only show Bearish, Bullish or both Bearish and Bullish CISD + FVG,
ii. Showing only London Session, New York Session, or both London and New York Sessions' CISD & FVG,
iii. Option of hiding/showing 5m CISD+FVG on time frames greater than 5m,
iv. Adjustable:
(a) Look back bars (max=300),
(b) CISD line length,
(c) FVG line length,
v. Customizable Bearish and Bullish CISD line colors.
I hope you find value in this indicator, and convenient for time when trading, no CISD markups needed

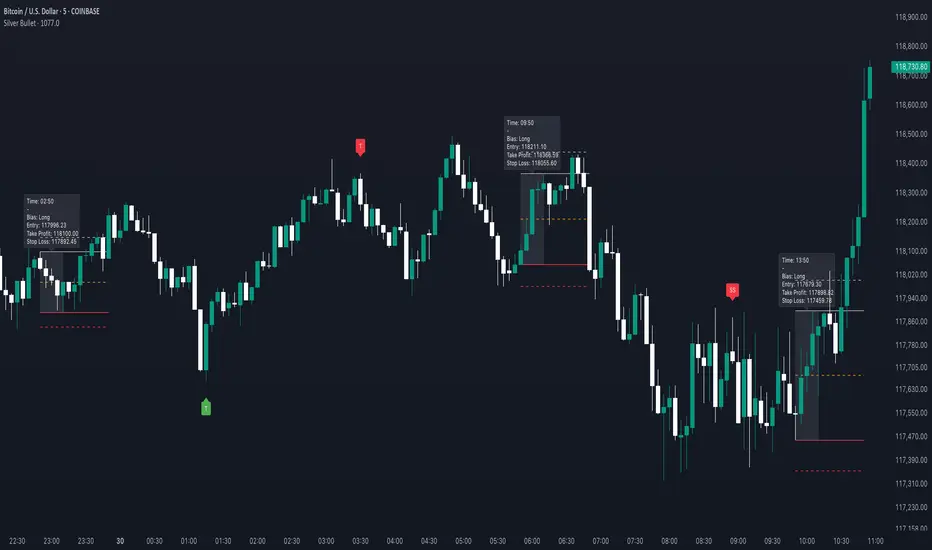
Silver BulletSilver Bullet is a trading tool built for finding cleaner, higher-probability setups. It focuses on key windows of market movement and adds helpful tools like daily range levels and candlestick patterns.
Whether you’re trading breakouts or reversals, Silver Bullet gives you a clearer view of the market and more confidence in your setups.
⸻
🔹 Trading Setup #1: Macro Time
The Macro Time setting offers two modes: Macro Bullet and Silver Bullet. Both help traders focus on specific times when the market tends to deliver clean moves.
• Macro Bullet is based on the high and low of a full macro session. It automatically detects the session’s range and bias, then offers optimal entries for either Long or Short setups. Once the session resolves, it provides Fibonacci-based levels for entry, target, and stop loss.
• Silver Bullet is based on ICT concepts and focuses on the hourly range for London, NY AM, and NY PM sessions. It’s designed for quick time blocks and highlights key levels as the session unfolds.
To use this setup, set Macro Time to “ICT Sessions” and select your preferred mode under Bullet Mode.
⸻
🔹 Trading Setup #2: Daily Range
Enable Daily Range to draw Fibonacci levels based on either the previous day’s candle or the current day’s developing range. These levels help you identify potential support, resistance, and midpoint zones throughout the day.
With the current day’s range, levels automatically update in real time as new highs or lows form — keeping your chart aligned with evolving price action.
⸻
🔹 Trading Setup #3: Candlestick Patterns
Turn on Candlestick Patterns to automatically highlight clean reversal signals such as Hammers, Hanging Men, Shooting Stars, and Tweezers. Each pattern is detected using specific criteria and trend filters to reduce noise and improve reliability. They work especially well as confirmation signals around key levels or session zones.
Silver Bullet brings structure, clarity, and precision to your intraday trading. By combining time-based bias, price action levels, and pattern recognition, it helps you trade with purpose — not guesswork. Use one setup or combine all three for a complete view of the market, tailored to your style and session of choice.
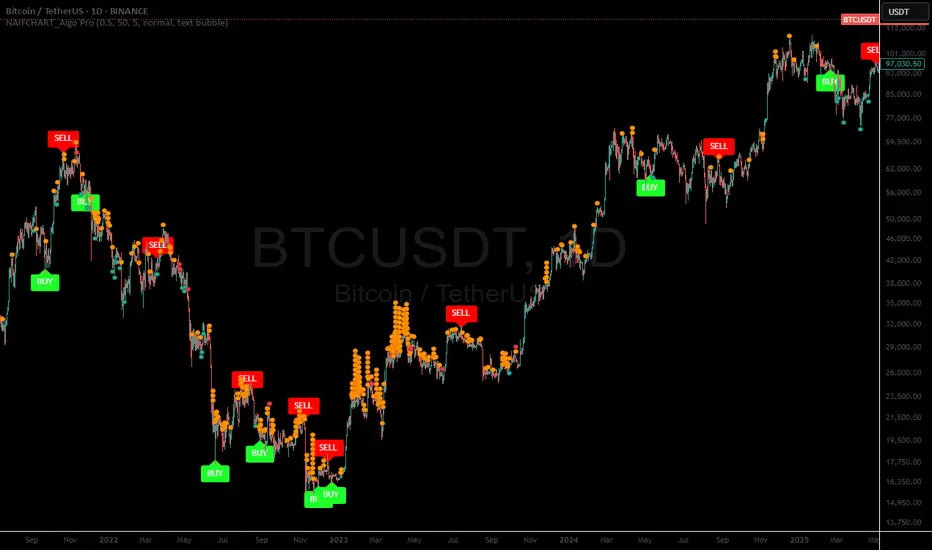
NAIFCHART_Algo Pro# NAIFCHART Algo Pro: Advanced Candlestick Pattern Analysis Tool
## Overview
The NAIFCHART Algo Pro indicator represents an innovative approach to candlestick pattern analysis, combining traditional engulfing patterns with advanced technical filters. This indicator was developed and shared by the trading community at t.me focusing on high-probability reversal signals through multi-layered confirmation.
## Core Algorithm Components
**Candle Stability Index**: Measures the ratio between candle body and total range (including wicks). Higher values indicate more decisive price action with stronger conviction. Default setting of 0.5 ensures only stable, well-formed candles generate signals, filtering out indecisive market conditions.
**RSI Momentum Filter**: Utilizes 14-period RSI with customizable threshold (default 50) to confirm overbought/oversold conditions. Buy signals require RSI below the threshold, while sell signals need RSI above the inverse threshold, ensuring momentum alignment with pattern direction.
**Candle Delta Analysis**: Examines price movement over a specified period (default 5 candles) to confirm directional bias. This filter ensures patterns occur after meaningful price moves in the opposite direction, increasing reversal probability.
**Engulfing Pattern Recognition**: Identifies classic bullish and bearish engulfing formations where the current candle completely engulfs the previous candle's body, indicating potential momentum shift.
## Signal Generation Logic
**Buy Signal Criteria**:
- Bullish engulfing pattern formation
- Candle stability above threshold level
- RSI below specified threshold (oversold condition)
- Price decrease over the delta length period
- Confirmed bar state (prevents repainting)
**Sell Signal Criteria**:
- Bearish engulfing pattern formation
- Candle stability above threshold level
- RSI above inverse threshold (overbought condition)
- Price increase over the delta length period
- Confirmed bar state (prevents repainting)
## Advanced Features
**Signal Filtering**: Optional "Disable Repeating Signals" feature prevents signal clusters by blocking consecutive identical signals. This enhances chart clarity and reduces noise in trending markets where multiple patterns might form in sequence.
**Visual Customization**: Multiple label styles including text bubbles, triangles, and arrows with full color customization. Label sizes range from tiny to huge, allowing adaptation to different chart configurations and personal preferences.
**Alert Integration**: Built-in alert system notifies traders immediately when buy or sell conditions are met, enabling real-time trade execution without constant chart monitoring.
## Implementation Strategy
**Timeframe Optimization**: The indicator performs effectively across multiple timeframes, with higher timeframes (1-hour and above) providing more reliable signals due to reduced market noise. Shorter timeframes require more conservative position sizing due to increased false signal probability.
**Parameter Tuning**:
- Increase Candle Stability Index for more selective signals in volatile markets
- Adjust RSI threshold based on market conditions (lower for trending markets, higher for ranging conditions)
- Modify Candle Delta Length for different trend confirmation periods
**Risk Management**: Combine signals with proper stop loss placement below/above the engulfing pattern's extreme points. Consider position sizing based on pattern strength and overall market context.
## Market Application
**Reversal Trading**: Primary application focuses on identifying high-probability reversal points after extended moves. The multi-filter approach significantly reduces false signals compared to basic engulfing pattern strategies.
**Trend Confirmation**: In trending markets, signals align with pullback completion, providing optimal entry points for trend continuation strategies. The RSI and delta filters help identify temporary retracements rather than trend changes.
**Range Trading**: Within sideways markets, signals often occur near range boundaries, providing effective support and resistance bounce opportunities with clearly defined risk parameters.
## Performance Optimization
**Market Selection**: The indicator performs best on liquid instruments with clear candlestick formations. Avoid extremely volatile or thin markets where patterns may be less reliable.
**Session Timing**: Consider trading sessions when focusing on specific markets. Major session overlaps often provide clearer patterns due to increased participation and volume.
**Confirmation Techniques**: While the indicator provides internal filtering, additional confirmation through volume analysis, key support/resistance levels, or broader market context enhances signal reliability.
## Community Resources
Access ongoing strategy discussions and optimization techniques through the source community at t.me where traders share practical applications and parameter adjustments for different market conditions.
The collaborative environment provides valuable insights into optimal settings for various trading styles and market environments, along with real-time feedback on signal quality and performance.
## Conclusion
NAIFCHART Algo Pro offers a sophisticated approach to candlestick pattern trading through intelligent filtering and confirmation mechanisms. The indicator's strength lies in combining traditional pattern recognition with modern technical analysis filters, creating a robust framework for identifying high-probability reversal opportunities.
Success with this tool requires understanding each component's role in signal generation and adapting parameters to match current market conditions and personal trading style. The community-driven development ensures practical relevance and ongoing refinement based on real trading experiences.
Practice with demo accounts to develop familiarity with signal timing and optimal parameter settings before live implementation. The indicator's systematic approach provides clear entry signals while maintaining flexibility for different risk management and position sizing strategies.
Engulfing DashboardThis is an indicator that detects candles based on the **Engulfing system** I’ve studied — from **wick to wick**.
It determines whether it’s a Buy or Sell based on the **opening price** and how the candle moves.
Anyone familiar with the Engulfing system will know how to use it.
It’s especially useful for people who use only **one screen** and can’t constantly monitor multiple timeframes.
And don’t forget:
**Trend is your friend.**

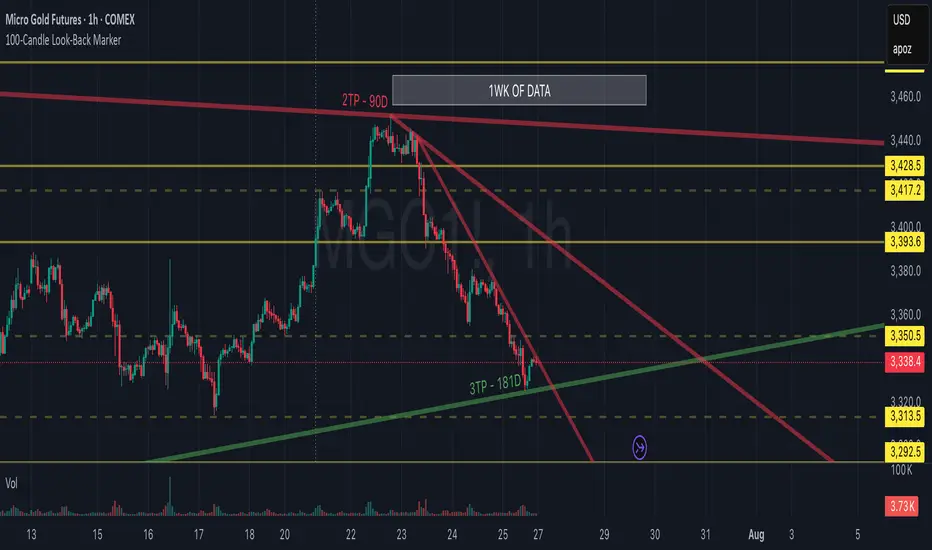
100-Candle Look-Back MarkerIt simply redraws one vertical dotted line that always sits exactly 100 bars behind the current bar, so you can check at a glance that any trend-line you draw has at least 100 candles of data to the right of it.
GLOBEX BOX v1.0All credit to the creator and teacher of this strategy, @RS.
The "GOBEX BOX v1.0" indicator draws customizable horizontal rectangles (with optional midlines and labels) around specific opening candles in the EST timezone ("America/New_York").
It highlights:
The 09:30–09:31 EST 1-minute candle high/low for Monday through Friday.
The 18:00–18:05 EST 5-minute candle high/low for Sunday through Thursday.
Various customizable features are in the indicator settings.
Happy trading!

Order Block + Liquidity Sniper by TradingNexus🧠 Order Block + Liquidity Sniper by TradingNexus
📌 How the Indicator Works – Explanation of Visual Elements
🔺 Triangles – Liquidity Sniper Signals
Green triangle below candle (▲): This is a Bullish Liquidity Sniper Signal. It indicates that price swept liquidity below a Swing Low, triggering stop-losses, and then returned back above a bullish Order Block zone. This suggests potential institutional buying interest and could mark a strong buy opportunity.
Red triangle above candle (▼): This is a Bearish Liquidity Sniper Signal. It shows that price swept above a Swing High to collect liquidity and then returned below a bearish Order Block zone. This implies possible institutional selling after a liquidity hunt and may signal a short entry.
🟢 Circles – Order Block Zones
Green circle (●): Represents a Bullish Order Block area – typically the last bearish candle before a strong bullish move. Price returning to this zone may react due to renewed institutional buying.
Red circle (●): Marks a Bearish Order Block – the last bullish candle before a strong bearish move. These zones may act as resistance when price revisits.
✖️ Crosses – Liquidity Zones
Purple cross (+): Identifies a Swing High liquidity level – a short-term high where many stop-loss orders are likely clustered.
Orange cross (+): Marks a Swing Low liquidity zone – a key area where stop orders from long positions may reside.
This indicator seeks precise institutional-style entries by detecting when price:
Sweeps liquidity at a recent swing high or low;
Then reacts from a valid Order Block zone.
The triangle markers highlight potential Sniper entries, while circles and crosses help visualize the key zones that underpin these moves.
Use this tool to improve timing, context, and confidence in your trades – especially when combining with SMC or price action frameworks.
Built by TradingNexus – designed for price action traders who use Smart Money Concepts (SMC).

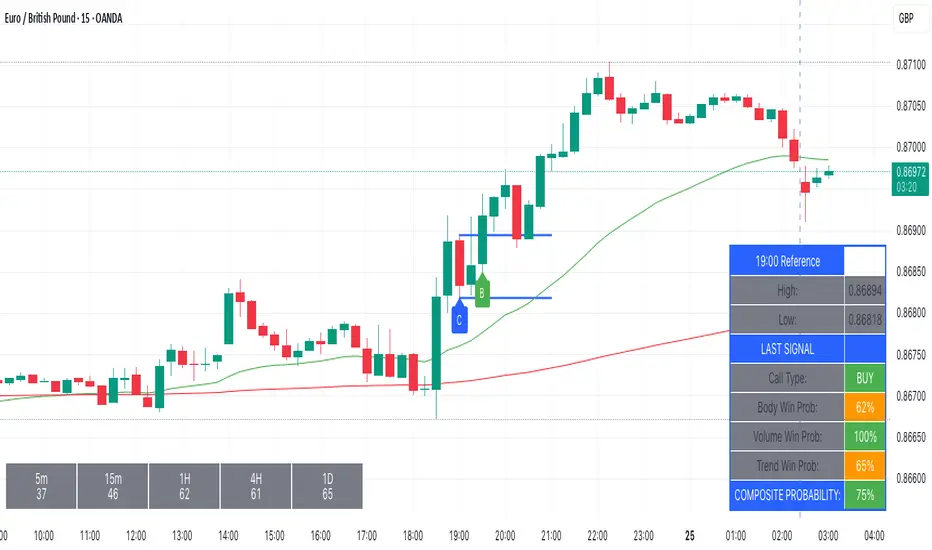
Kairos BarakahTrade with precision during high-probability windows using this advanced Pine Script indicator, designed specifically for Indian Standard Time (IST). The tool identifies key reversal opportunities within a user-defined trading session, combining time-based reference levels, sequence-validated signals, and multi-factor win probability analysis for confident decision-making.
Key Features
1. Time-Based Reference Levels
Automatically sets high/low reference levels at a customizable start time (default: 19:00 IST).
Active trading window with adjustable duration (default: 135 minutes).
Clear visual reference lines for easy tracking.
2. Intelligent Signal Generation
Initial Signals:
Buy (B): Triggered when price closes above the reference high.
Sell (S): Triggered when price closes below the reference low.
Reversal Signals (R):
Valid only after an initial signal, ensuring proper sequence.
Buy Reversal: Price closes above reference high (after a Sell signal).
Sell Reversal: Price closes below reference low (after a Buy signal).
3. Multi-Dimensional Win Probability
Body Strength: Measures candle conviction (body size / total range).
Volume Confirmation: Compares current volume to 20-period average.
Trend Alignment: Uses EMA crosses (9/21) and RSI (14) for momentum.
Composite Score: Weighted blend of all factors, color-coded for quick interpretation:
🟢 >70%: High-confidence signal.
🟠 40-69%: Moderate confidence.
🔴 <40%: Weak signal.
4. Professional Visualization
Clean labels (B/S/R) at signal points.
Real-time reference table showing levels, active signal, and probabilities.
Customizable alerts for all signal types.
Why Use This Indicator?
IST-Optimized: Tailored for Indian market hours.
Rules-Based Reversals: Avoids false signals with strict sequence checks.
Data-Driven Confidence: Win probability metrics reduce guesswork.
Flexible Setup: Adjust time windows and parameters to fit your strategy.
SMC Core Concepts TradingNexus (BOS, CHoCH, FVG, OB) - Stage 1🔍 SMC Core Concepts TradingNexus – Stage 1 (BOS, CHoCH, FVG, OB)
Smart Money Concepts made visual and accessible.
This indicator helps traders identify key institutional structures such as Break of Structure (BOS), Change of Character (CHoCH), Fair Value Gaps (FVG), and Order Blocks (OB) – all automatically detected and visualized on the chart.
✅ Features in Stage 1:
🔹 BOS Detection – Detects bullish and bearish structure breaks based on swing points
🔹 CHoCH Identification – Spots potential change of character after a trend
🔹 Fair Value Gap Zones – Highlights imbalances between candles
🔹 Order Block Zones – Detects key OB zones before strong price moves
🔹 Smart Auto-Cleanup – Automatically removes old boxes to optimize performance
🔹 User Inputs – Configure swing sensitivity and toggle each feature
🧠 Built for Traders Seeking Clarity
This script is ideal for SMC traders who want clear structure-based setups without drawing everything manually. Designed for both scalpers and swing traders who follow institutional logic.
🚀 Stage 2 (Coming Soon):
Liquidity zones (EQH/EQL)
Internal vs. external BOS
Mitigation blocks
Bias detection
Buy/Sell signal system
Smart SL/TP zones
Alerts system
👤 Created by TradingNexus
💬 Open-source & community-driven. Feel free to fork, contribute, or suggest improvements.

Digital Clock with Candle Alert📊 Digital Clock with Candle Alert
A sleek, customizable digital clock for your trading charts that displays real-time with seconds and provides visual alerts before new candles form. Never miss a candle entry again!
✨ Key Features:
- Real-time Digital Clock - Shows hours, minutes, and seconds in your chosen timezone
- Visual Candle Alerts - Blinking notification before new candles form
- Multi-Timeframe Alerts - Get alerts for any timeframe regardless of your chart period
- Fully Customizable - Colors, size, position, and alert timing all configurable
- Half-Second Blinking - Eye-catching 2Hz blink rate for maximum visibility
- 6 Timezone Options - Exchange, UTC, New York, London, Tokyo, Sydney
🎯 Use Cases:
- Scalping - Know exactly when the next candle will form
- Entry Timing - Perfect for strategies that enter on new candles
- Multi-Timeframe Trading - Monitor higher timeframe candles while on lower timeframes
- General Awareness - Always know the current time in your trading timezone
⚙️ Settings:
Time Settings:
- Timezone selection (Exchange default or specific zones)
Display Options:
- Text and background colors for normal operation
- Alert colors for blinking state
- Text size (tiny to huge)
- Position (9 locations on chart)
Alert Configuration:
- Enable/disable blinking alerts
- Select timeframe to monitor
- Alert lead time (5 seconds to 1 hour)
📝 Important Notes:
- Clock updates depend on incoming price ticks
- During low-volume periods, updates may be less frequent
- Works best on liquid instruments during active market hours
- Alert timeframe is independent of your chart timeframe
💡 Tips:
- Use contrasting alert colors for maximum visibility
- Set lead time based on your reaction needs
- Position clock where it won't obstruct price action
- Try red background with white text for urgent alerts
🔄 Version 1.0 - Initial release

Impulse Alert - Demand (Buy) [Fixed]🔵 Impulse Alert – Demand (Buy)
This indicator is designed to detect high-probability Demand Zones based on impulsive bullish price action, helping traders get alerted only when it matters most.
🧠 Core Logic:
Scans the chart for 2 consecutive bullish impulsive candles with significant range (body size)
Also captures single large bullish impulse candles that often mark institutional buying
Marks the origin of the move as a potential Demand Zone
Sends alerts when such bullish setups form, allowing you to monitor charts passively
⚙️ Features:
✅ Alerts on impulsive move formations
✅ Detects both 2-candle and single-candle impulses
✅ Custom zone detection logic based on pip size and momentum
✅ Cleaner & smarter: removes distractions and avoids false signals
📌 Best Used For:
Smart Money / Supply & Demand traders
Identifying potential institutional buy zones
Executing trades with HTF confluence
Traders who want to get alerted without screen-watching
🔁 Suggested Strategy:
Set HTF directional bias (H1, H4, D1)
Use this indicator on LTF (1M–15M) for impulsive bullish entries
Wait for price to return to the marked zone for low-risk entries
💡 Pro Tip: Combine with your Supply Zone (Sell) indicator to track both sides of market structure and increase R:R
👤 Created by: Rohit Jadhav | YT/Insta/X - @GrowthByTrading
📬 Want updates, enhancements, or personal versions? Leave feedback or reach out through profile!
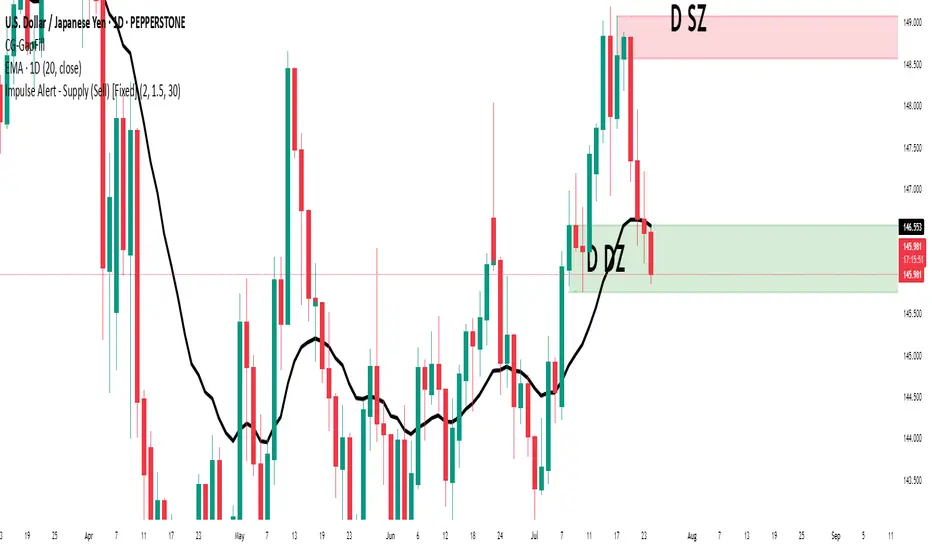
Impulse Alert - Supply (Sell) [Fixed]🟥 Supply Zone (Sell) – Institutional Order Block Detector
This custom indicator automatically detects valid Supply Zones (Sell Zones) based on Smart Money Concepts and institutional trading behavior.
🔍 How It Works:
Identifies strong bearish impulsive moves after price forms a potential Order Block
Valid supply zones are plotted after:
A valid rally–base–drop or drop–base–drop structure
A shift in structure or clear imbalance is detected
The zone is created from the last bullish candle before a strong bearish engulfing move
Zones remain on chart until price revisits and reacts
📊 Use Case:
Ideal for traders using Smart Money Concepts (SMC), Supply & Demand, or ICT-inspired strategies
Perfect for scalping, day trading, or swing setups
Designed for confluence with HTF bias and LTF execution
⚙️ Features:
Supply Zone auto-plotting
Customizable zone color and opacity
Alerts when price returns to the zone (retest entry opportunity)
🧠 Tip for Best Use:
Use in confluence with:
HTF Supply zones (manual or other indicator)
Market Structure breaks
Fair Value Gaps or Imbalance zones
Strong impulsive moves from HTF to LTF
🔁 Future Additions (Coming Soon):
Demand Zone detection
Zone strength rating system
Refined zone filters (volume, candle size, etc.)
Alerts for mitigation or invalidation
📌 Created by: Rohit Jadhav | Real-time market trader | YT/Insta - @GrowthByTrading
💬 Feedback? Drop a comment or connect via profile for updates and tutorials!
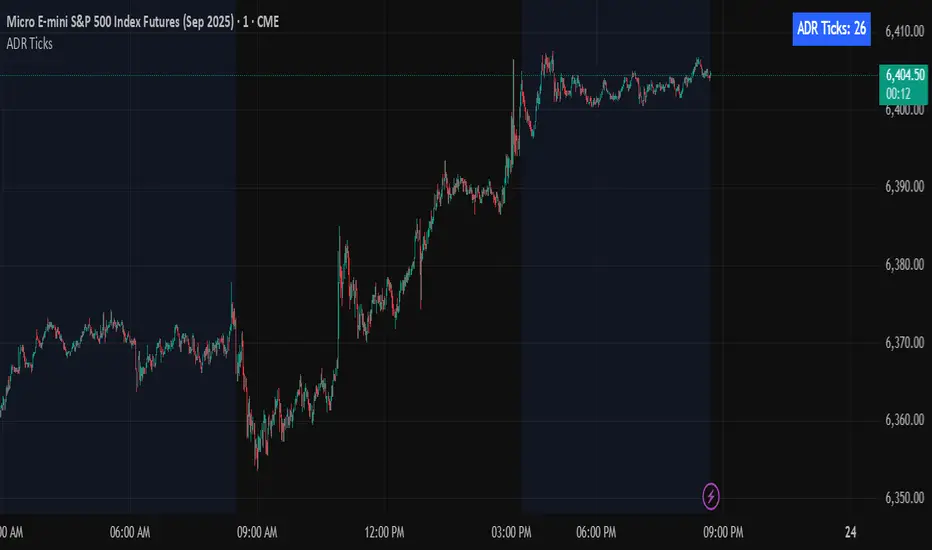
Average Daily Range in TicksPurpose: The ADR Ticks Indicator calculates and displays the average daily price range of a financial instrument, expressed in ticks, over a user-specified number of days. It provides traders with a measure of average daily volatility, which can be used for position sizing, setting stop-loss/take-profit levels, or assessing market activity.
Calculation: Computes the average daily range by taking the difference between the daily high and low prices, averaging this range over a customizable number of days, and converting the result into ticks (using the instrument's minimum tick size).
Customization: Includes a user input to adjust the number of days for the average calculation and a toggle to show/hide the ADR Ticks value in the table.
Risk Management: Helps traders estimate typical daily price movement to set appropriate stop-loss or take-profit levels.
Market Analysis: Offers insight into average daily volatility, useful for day traders or swing traders assessing whether a market is trending or ranging.
Technical Notes:
The indicator uses barstate.islast to update the table only on the last bar, reducing computational load and preventing overlap.
The script handles different chart timeframes by pulling daily data via request.security, making it robust across various instruments and timeframes.
Enhanced Order Block Zones v6I created this indicator to identify orders blocks and label them on timeframes of 15 minutes and lower. This only identifies fairly recent orders blocks based off the performance of the markets. Always remember orders blocks are more accurate at higher timeframes. However, this can be utilized to see more real time orders blocks as they form.

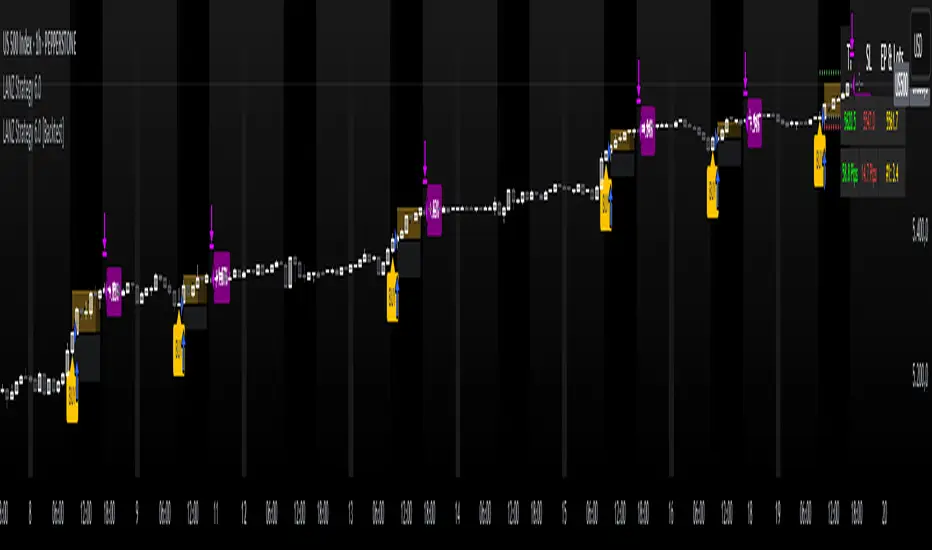
LANZ Strategy 6.0 [Backtest]🔷 LANZ Strategy 6.0 — Precision Backtesting Based on 09:00 NY Candle, Dynamic SL/TP, and Lot Size per Trade
LANZ Strategy 6.0 is the simulation version of the original LANZ 6.0 indicator. It executes a single LIMIT BUY order per day based on the 09:00 a.m. New York candle, using dynamic Stop Loss and Take Profit levels derived from the candle range. Position sizing is calculated automatically using capital, risk percentage, and pip value — allowing accurate trade simulation and performance tracking.
📌 This is a strategy script — It simulates real trades using strategy.entry() and strategy.exit() with full money management for risk-based backtesting.
🧠 Core Logic & Trade Conditions
🔹 BUY Signal Trigger:
At 09:00 a.m. NY (New York time), if:
The current candle is bullish (close > open)
→ A BUY order is placed at the candle’s close price (EP)
Only one signal is evaluated per day.
⚙️ Stop Loss / Take Profit Logic
SL can be:
Wick low (0%)
Or dynamically calculated using a % of the full candle range
TP is calculated using the user-defined Risk/Reward ratio (e.g., 1:4)
The TP and SL levels are passed to strategy.exit() for each trade simulation.
💰 Risk Management & Lot Size Calculation
Before placing the trade:
The system calculates pip distance from EP to SL
Computes the lot size based on:
Account capital
Risk % per trade
Pip value (auto or manual)
This ensures every trade uses consistent, scalable risk regardless of instrument.
🕒 Manual Close at 3:00 p.m. NY
If the trade is still open by 15:00 NY time, it will be closed using strategy.close().
The final result is the actual % gain/loss based on how far price moved relative to SL.
📊 Backtest Accuracy
One trade per day
LIMIT order at the candle close
SL and TP pre-defined at execution
No repainting
Session-restricted (only runs on 1H timeframe)
✅ Ideal For:
Traders who want to backtest a clean and simple daily entry system
Strategy developers seeking reproducible, high-conviction trades
Users who prefer non-repainting, session-based simulations
👨💻 Credits:
💡 Developed by: LANZ
🧠 Logic & Money Management Engine: LANZ
📈 Designed for: 1H charts
🧪 Purpose: Accurate simulation of LANZ 6.0's NY Candle Entry system
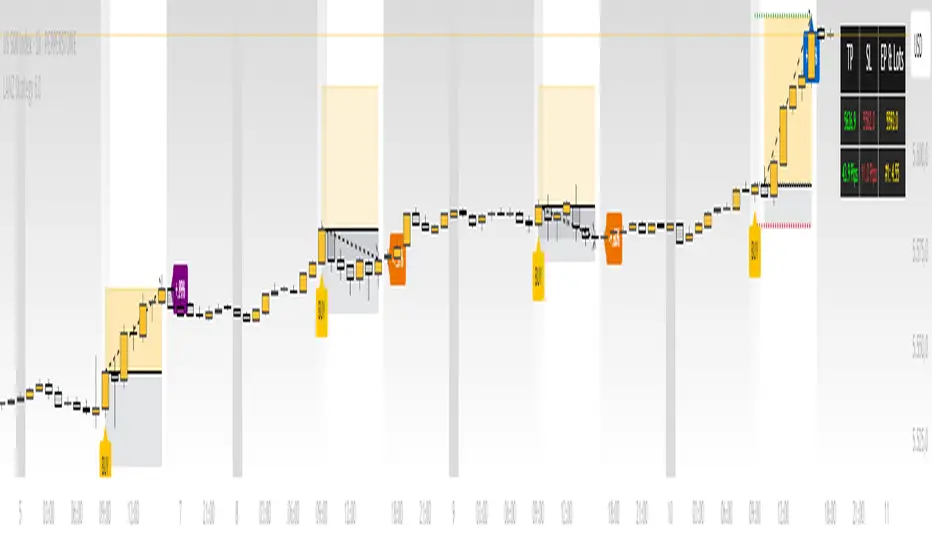
LANZ Strategy 6.0🔷 LANZ Strategy 6.0 — One-Shot NY Candle Logic with Dynamic SL/TP, Multi-Account Lot Sizing and Visual Confirmation System
LANZ Strategy 6.0 is a high-precision, visually driven indicator that executes a single operation per day based on the 09:00 a.m. New York candle. Built for simplicity and accuracy, it calculates dynamic Stop Loss and Take Profit levels using the candle range, and adapts position sizing per account with pip-accurate risk control. All actions are visualized in real-time for full clarity.
📌 This is an indicator, not a strategy — It does not place trades automatically, but provides exact entry setups, SL/TP levels, risk-based lot size guidance, and optional alerts.
🧠 Core Logic & Features
🚀 Entry Signal (BUY Only)
A BUY setup is triggered only once per day, when:
The current candle is the 09:00–10:00 a.m. NY session candle
The candle is bullish (close > open)
This single candle is used to define the trade levels for the day, and the signal is only evaluated once. If bullish, a visual "BUY" label appears with SL/TP/EP levels calculated from the candle body or full range.
⚙️ Stop Loss and Take Profit
You can configure:
SL as a percentage of the candle’s range (from wick to wick), or use the wick extreme
RR ratio (e.g., 1:4) to dynamically calculate the TP based on SL
Each level is drawn as a line:
EP (Entry Price) at the candle’s close
SL below the low (or % of range)
TP above the entry at the selected RR
💰 Risk-Based Lot Size Calculation per Account
Manage up to 5 independent accounts simultaneously. Each account can have:
Its own capital
Its own risk percentage per trade
Lot size is calculated automatically for each based on:
Defined SL in pips
The pip value (auto-detected for Forex or manually defined for indices/gold)
📋 All lot sizes are displayed in a dedicated info panel, with their corresponding risk-adjusted values per account.
🖼️ Trade Visualization Panel
When a trade is active, a clean table is displayed in the top-right corner showing:
TP / SL / EP levels
Distance in pips for SL and TP
Lot size per account
Line visuals (style, color, thickness) are fully customizable.
🧪 Outcome Tracking (Real-Time Labels)
For each trade:
If SL is hit → a label shows “–1.00%” at the SL level
If TP is hit → a label shows “+X.XX%” at the TP level
If still open at 3:00 p.m. NY, the trade closes manually and the actual result (in %) is calculated and labeled on chart
🔔 Alerts You Can Trust
You'll get an alert when:
A BUY entry is confirmed
SL or TP is hit
Manual close is triggered at 15:00 NY
All alerts include the symbol, price, and result for immediate action or tracking.
🧭 Execution Flow Summary
Every day:
At 09:00 a.m. NY → Evaluate candle
If bullish:
Set EP, SL, TP
Calculate lot sizes
Plot lines + labels
Display dashboard panel
Monitor SL/TP hits
At 15:00 NY → Force close if needed
💡 Ideal For:
Traders who want a clean, single-shot entry system per day
Index or gold traders who operate with strict SL/TP logic
Anyone managing multiple accounts or fixed-capital models
Visual learners and disciplined execution fans
👨💻 Credits:
💡 Developed by: LANZ
🧠 Execution Model & Logic Design: LANZ
📅 Designed for: 1H timeframe, high-conviction NY-based entries
📈 Purpose: Clean decision-making, precision risk control, visual certainty
[Top] Multi-Candle Pattern DetectorThe Multi-Candle Pattern Detector is a powerful tool that scans for a wide variety of high-probability candlestick formations directly on the chart. It highlights key multi-bar reversal and continuation patterns using intuitive emoji-based labels and descriptive tooltips, helping traders quickly assess market conditions and potential setups.
Supported patterns include:
Bullish & Bearish Engulfing
Morning Star / Evening Star
Three Line Strike
Rising / Falling Three Methods
Hammer / Inverted Hammer / Hanging Man / Gravestone Doji
To reduce false signals, this script includes a built-in trend filter using a custom LHAMA (Low-High Adaptive Moving Average) calculation. Patterns are only displayed when recent price action is not flat, helping traders avoid entries during consolidation.
Users can toggle each pattern type individually, making the script adaptable for various strategies and timeframes.
⸻
Potential Uses
Reversal Spotting: Identify key inflection points at the end of trends.
Continuation Confirmation: Confirm trend strength following brief pauses in momentum.
Price Action Training: Visually reinforce recognition of textbook candlestick patterns.
Strategy Integration: Combine with trend or volume filters for more advanced rule-based systems.
⸻
This indicator is suitable for traders who rely on price action and candlestick psychology, and is useful across all asset classes and chart intervals.
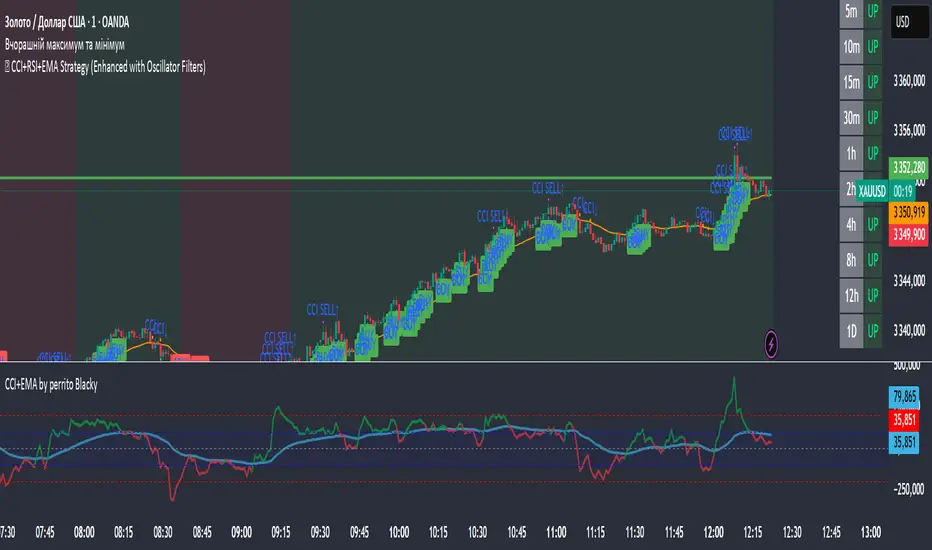
🏹 CCI+RSI+EMA Strategy (Enhanced with Oscillator Filters)This script is a multi-indicator trading strategy that combines trend-following and momentum signals using CCI, RSI, and EMA, enhanced with MACD and Stochastic filters for more reliable entries.
🧠 Core Concept
The strategy aims to:
Identify the trend using EMA(50) and a long-term comparison of EMA 35 vs EMA 169;
Spot momentum using CCI and RSI;
Filter entries through MACD and Stochastic confirmations to avoid false signals.
📌 Buy Conditions:
✅ Price is above EMA
✅ RSI is above a set threshold (default: 45)
✅ CCI is above a set threshold (default: 0)
✅ Uptrend confirmed by EMA 35 > EMA 169
✅ CCI has recently reached oversold levels (e.g. below -100)
✅ MACD shows bullish crossover
✅ Stochastic confirms exit from oversold zone
📌 Sell Conditions:
✅ Price is below EMA
✅ RSI is below a set threshold (default: 55)
✅ CCI is below 0
✅ Downtrend confirmed by EMA 35 < EMA 169
✅ CCI has recently reached overbought levels (e.g. above 100)
✅ MACD shows bearish crossover
✅ Stochastic confirms exit from overbought zone
🎯 Features:
Fully customizable inputs — adapt to your own trading style.
Trend background shading — green for uptrend, red for downtrend.
Enhanced entry logic — filters out weak signals.
CCI Cross and Trigger markers — additional confirmation tools.
🔔 Alerts
You can set alerts for ENHANCED BUY and ENHANCED SELL to never miss a quality signal.
📈 Use Case:
This tool is suitable for:
Manual trading entries and exits
Being a component of a broader trading system
Semi-automation with alert-based strategies
⚠️ Disclaimer:
This script is for educational and testing purposes only. It is not financial advice. Always backtest and demo trade before using on a live account.