Scalper Pro Pattern Recognition & Price Action👑Scalper Pro®👑Pattern Recognition & Price Action
i.postimg.cc
Introducing the ultimate trading robot designed for serious investors! Our advanced bot analyzes market cycles, tracks targets, sets stop losses, and expertly manages your capital. With powerful algorithms and real-time insights, it identifies opportunities and delivers accurate signals, ensuring you never miss a market move. Take control of your trading strategy and maximize your profits with our cutting-edge technology. Join the future of trading today—your expert assistant is ready to help you succeed!
💡 This is not just another indicator — it's a complete trading assistant that identifies structure, signals strength, and simplifies decision-making.
🚀 Plug it into your TradingView chart today and start seeing the market in a whole new way.
💬 Need help with access, backtesting, or have any questions about our indicators?
Our support team is available 24/7 on Telegram.
Just reach out through the link below: 👉 t.me
Candlestick analysis
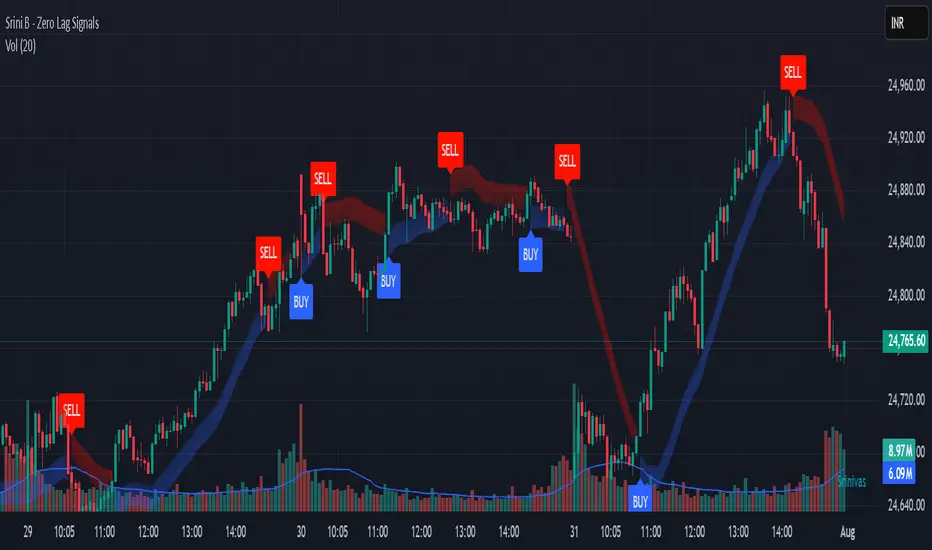
Srini B - Zero Lag Trend SignalsFinal version with minor changes. This indicator displays buy & sell alerts as per settings defined and comes out really well. Just my own personal indicator for own use.
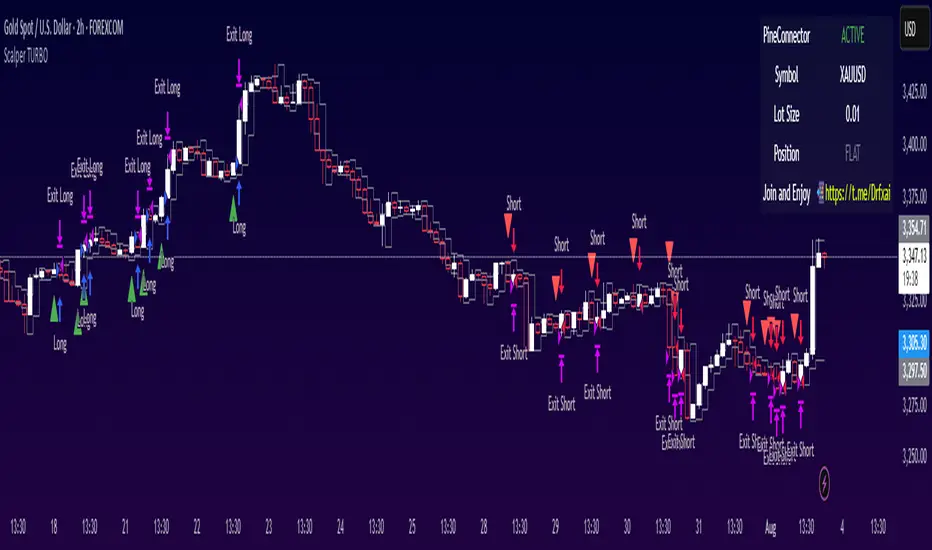
GOD Scalper TURBO Pattern Recognition & Price Action🚀 Introducing: 👑Scalper TURBO👑 – Your Ultimate TradingView Companion for High-Speed Scalping & Auto-Trading!
Trade Smarter. Trade Faster. Trade Automated.
The world's fastest scalper robot with the ability to analyze and trade in second-by-second time frames with an incredible 900% monthly profitability.
🔥 What is 👑Scalper TURBO👑?
Scalper TURBO is a high-performance Pine Script 5 strategy designed for aggressive and intelligent scalping on TradingView. It combines breakout detection, multi-indicator confirmation, time-based filtering, and full PineConnector integration for automated live trading with MetaTrader 5 (MT5). Whether you want to backtest, trade manually, or connect with MT5 via PineConnector – this tool is your edge.
⚙️ Key Features
✅ Fast Execution Logic — Uses real-time tick data with calc_on_every_tick=true
✅ EMA, SMA, RSI & ATR Filters — Combines trend, momentum, and volatility in one strategy
✅ Breakout Strategy — Trades breakouts above resistance or below support
✅ Multi-Time Filter Zones — 4 customizable intraday trading windows to avoid choppy hours
✅ PineConnector-Ready — Seamless alerts for auto-trading with MT5, customizable lot sizes
✅ Dynamic Stop Loss / Take Profit — Based on ATR multipliers for adaptable risk
✅ Trail Stop Support — Optional trailing stop-loss system
✅ Built-in Risk Labels — Live performance and signal info right on the chart
✅ Minimal Resource Usage — Pre-computed constants and cached indicators for speed
✅ Recommended Use Cases:
XAUUSD / Gold scalping (default)
1m to 5m charts (for high-frequency setups)
Live auto-trading via PineConnector
Backtesting and optimization with historical data
🧠 Pro Tips
For best results, run it during high-volume market hours (enable time filters like London/NY session).
Use trailing stop in volatile assets for maximizing gains.
Integrate with PineConnector Pro for seamless MT5 execution.
Combine with your own overlays or confirmation tools.
📣 Join the Movement
💬 Created by @DrFXAi – follow on TradingView for updates, improvements, and more elite scripts.
🚀 Ready to Automate Your Edge?
📌 Add 👑Scalper TURBO👑 to your chart today and take control of your scalping game with automation, speed, and intelligence!
💬 Need help with access, backtesting, or have any questions about our indicators?
Our support team is available 24/7 on Telegram.
Just reach out through the link below: 👉 t.me
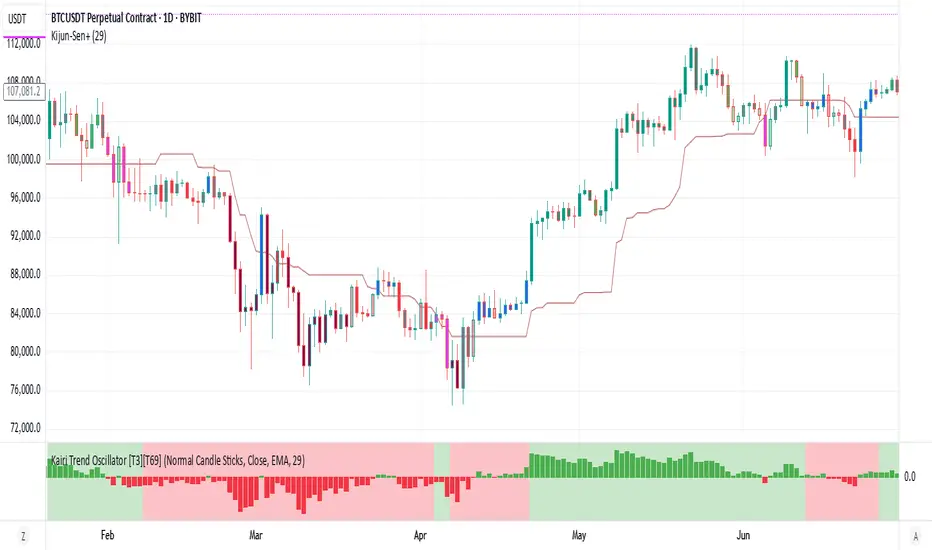
Kairi Trend Oscillator [T3][T69]📌 Overview
The Kairi Trend Oscillator is a Japanese-inspired hybrid oscillator combining Heikin-Ashi trend clarity with the Kairi (乖離率) indicator — a measure of price deviation from a moving average. This dual-layer system gives you both trend direction and trend strength/health, designed to highlight trend maturity and avoid overextended entries.
✨ Features
Heikin-Ashi or normal candlestick input modes
Multiple moving average options: SMA, EMA, DEMA, VWMA, and Kijun
Visual color-coded trend zones: overbought, oversold, healthy, weak, and reversal conditions
Full Kairi column plot with dynamic coloring
Adaptive logic for trend detection (linear regression or Heikin-Ashi structure)
Built-in reversal detection based on divergence between Kairi and trend direction
⚙️ How to Use
Choose Candle Type: Select Heiken Ashi or Normal Candlesticks via the Candle Mode dropdown.
Select Source: Choose open, high, low, or close as the input for Kairi computation.
Set MA Type & Length: Configure the moving average mode and its length under Moving Average Settings.
Interpret the Plot:
Green/Red bars: Show Kairi oscillator values above/below 0
Background color: Shows current trend (green = uptrend, red = downtrend)
Candle color overlays:
🟩 Teal = Overextended Bulls
🟥 Maroon = Overextended Bears
✅ Green = Healthy Uptrend
🔻 Red = Healthy Downtrend
🟨 Light tones = Weak trends
🔄 Blue/Fuchsia = Possible reversal detected
🔧 Configuration
Inputs:
Candle Mode: Heiken Ashi or Normal Candle Sticks
Source: Open, High, Low, Close
MA Mode: SMA, EMA, DEMA, VWMA, or Kijun
MA Length: Default is 29
🧪 Advanced Tips
Use Heikin-Ashi mode for better trend smoothing.
Kairi divergence (e.g., bullish Kairi in a downtrend) may signal upcoming reversal — watch for blue or fuchsia bars.
Combine with momentum indicators (e.g. RSI or MACD) for confluence-based setups.
For mean reversion strategies, fade extreme Kairi readings (> ±5%).
⚠️ Limitations
Not suited for ranging markets without trend.
Kairi extremes may remain elevated in strong trends — avoid early counter-trend entries.
Reversal logic is not a confirmation signal; use with caution.
📌 Disclaimer
This script is educational and illustrative. Always backtest thoroughly before using in live markets.
High Volume Small Body Finder What This Script Does:
Highlights candles where:
Body is small compared to the full candle range
Volume is much higher than the recent average
Use this on any chart (crypto, stocks, forex) to spot absorption, indecision, or potential reversal points.

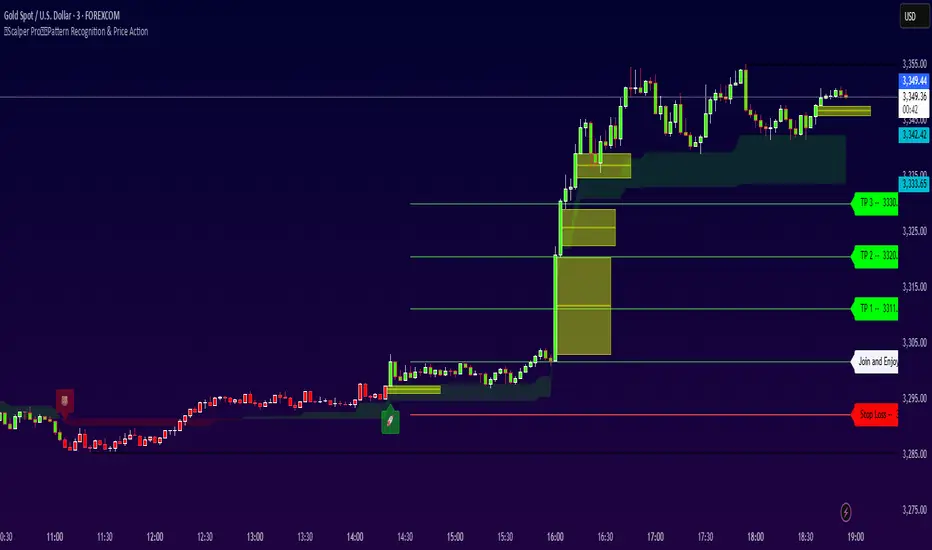
GOALZONE INDIWhy Use the "GOALZONE INDI" Indicator?
Are you looking for a reliable tool to enhance your gold trading strategy?
Introducing "GOALZONE INDI", a smart and easy-to-use indicator specifically designed to help traders make informed decisions in the gold market.
What Makes "GOALZONE INDI" Stand Out?
* Tailored for Gold (XAUUSD):
Specially optimized to detect crucial trend changes in gold prices, offering you timely signals to buy or sell.
* Precise Entry Points:
Uses smart moving average crossovers to identify the best moments for entry and exit, reducing guessing and improving profitability.
* Real-Time Alerts:
Get instant notifications when buy or sell signals occur—whether you're at your desk or on the go. Never miss a critical trading opportunity again!
* Easy to Use:
Clear visual signals on your chart show exactly when the market is favorable, perfect for both beginners and experienced traders.
* Ideal for Short-Term Trading:
Designed to generate signals on 1-minute charts, helping you capitalize on quick market movements in the fast-paced gold market.
Why Trader's Love It:
* Increase Confidence:
Making trade decisions becomes easier with accurate signals specific to gold trends.
* Save Time:
Automate your analysis—spend less time guessing and more time trading confidently.
* Maximize Profits:
Spot those crucial moments when the price movement is about to turn, giving you a competitive edge.
Start Using "GOALZONE INDI" Today!
Whether you're looking to refine your short-term trading strategy or want a trustworthy tool to guide your trades in gold markets, "GOALZONE INDI" is the perfect addition to your trading arsenal. Try it now and watch your trading confidence and results improve!

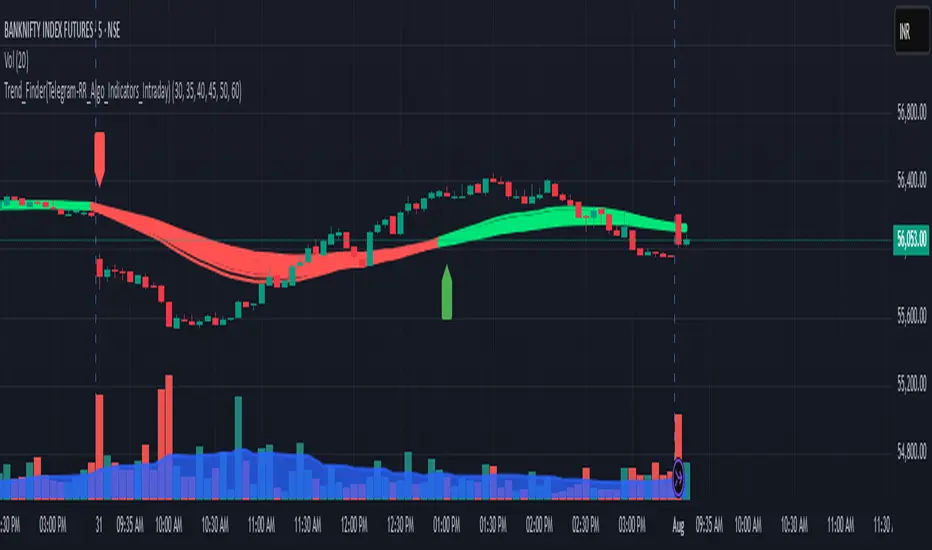
Trend_Finder(Telegram-RR_Algo_Indicators_Intraday)EMA Inputs
It uses 6 EMAs with customizable lengths (defaults: 30, 35, 40, 45, 50, 60).
Trend Conditions
Bullish Trend: All EMAs are strictly ordered from smallest to largest, meaning short-term prices are leading long-term prices upward.
Bearish Trend: All EMAs are ordered from largest to smallest, meaning short-term prices are falling below long-term ones.
Neutral: EMAs are mixed and do not meet the above criteria.
Trend Tracking
The script remembers the current trend and only flips when a full trend reversal condition is confirmed.
Gracias mi Dios Sammy IndicadorNASDAQ:QQQ //@version=5
indicator("Gracias mi Dios Sammy Indicador", overlay=true, max_labels_count=500)
// Cálculo de condiciones de velas
isBullish = close > open
isBearish = close < open
prevBullish = close > open
prevBearish = close < open
// Patrón Alcista (A): vela verde envuelve completamente a la roja previa
bullishEngulfing = isBullish and prevBearish and close > open and open < close
// Patrón Bajista (B): vela roja envuelve completamente a la verde previa
bearishEngulfing = isBearish and prevBullish and close < open and open > close
// Marcar con “A” (alcista) y “B” (bajista)
plotshape(bullishEngulfing, title="Alcista", style=shape.labelup, color=color.green, text="A", size=size.tiny, location=location.belowbar, textcolor=color.white)
plotshape(bearishEngulfing, title="Bajista", style=shape.labeldown, color=color.red, text="B", size=size.tiny, location=location.abovebar, textcolor=color.white)
// Alertas
alertcondition(bullishEngulfing, title="Alerta Alcista", message="Patrón Alcista (A) detectado")
alertcondition(bearishEngulfing, title="Alerta Bajista", message="Patrón Bajista (B) detectado")

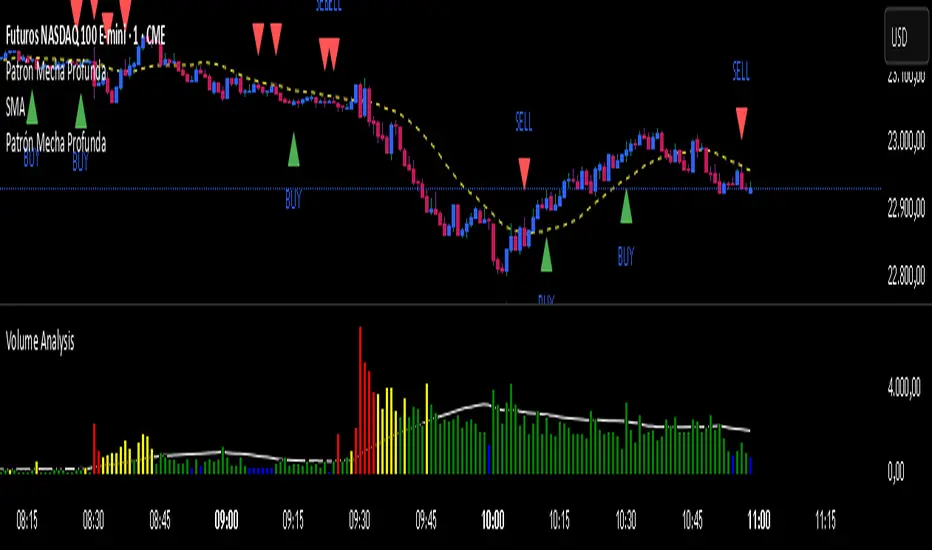
Patrón Mecha ProfundaThis pattern must be combined with a 20-period moving average. It is used to know the direction of the price. When the pattern appears and the price is above the 20-period moving average, it is a bullish signal and vice versa.
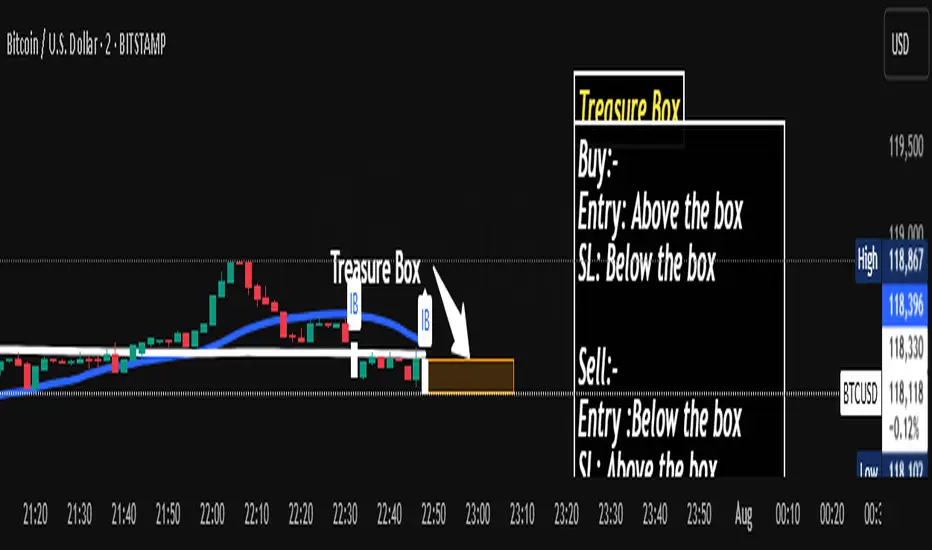
Wx2 Treasure Box – Institutional EntryBuy:-
Entry: Above the box
SL: Below the box
Sell:-
Entry :Below the box
SL: Above the box
RRR: 1:2
Best Location near 200MA
TF: Any TF
Watch My Video:
youtu.be
H1/L1 Trap MarkerH1 L1 Trap Marker based on Al Brooks PA
You can use it to detect trap traders and help determine your trade.

KILLZONE INDIWhy Use the "KILLZONE INDI" Indicator?
Are you looking for a reliable tool to enhance your gold trading strategy?
Introducing "KILLZONE INDI", a smart and easy-to-use indicator specifically designed to help traders make informed decisions in the gold market.
What Makes "KILLZONE INDI" Stand Out?
* Tailored for Gold (XAUUSD):
Specially optimized to detect crucial trend changes in gold prices, offering you timely signals to buy or sell.
* Precise Entry Points:
Uses smart moving average crossovers to identify the best moments for entry and exit, reducing guessing and improving profitability.
* Real-Time Alerts:
Get instant notifications when buy or sell signals occur—whether you're at your desk or on the go. Never miss a critical trading opportunity again!
* Easy to Use:
Clear visual signals on your chart show exactly when the market is favorable, perfect for both beginners and experienced traders.
* Ideal for Short-Term Trading:
Designed to generate signals on 1-minute charts, helping you capitalize on quick market movements in the fast-paced gold market.
Why Trader's Love It:
* Increase Confidence:
Making trade decisions becomes easier with accurate signals specific to gold trends.
* Save Time:
Automate your analysis—spend less time guessing and more time trading confidently.
* Maximize Profits:
Spot those crucial moments when the price movement is about to turn, giving you a competitive edge.
Start Using "KILLZONE INDI" Today!
Whether you're looking to refine your short-term trading strategy or want a trustworthy tool to guide your trades in gold markets, "KILLZONE INDI" is the perfect addition to your trading arsenal. Try it now and watch your trading confidence and results improve!

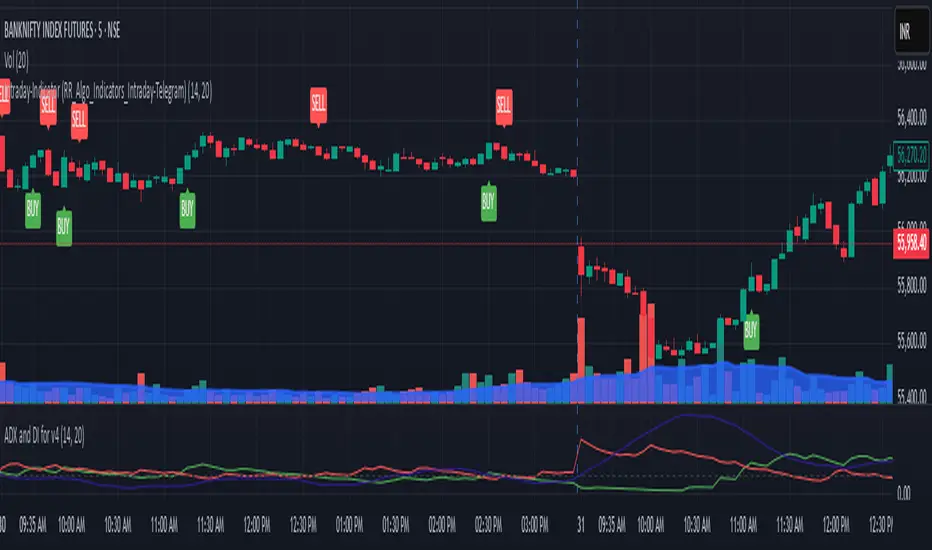
Buy/Sell Labels-RR_AlgoAI (Telegram-RR_Algo_Indicators_Intraday)This indicator uses the Trend Movement to identify shifts in market trend. When the positive movement crosses above the negative, it signals a potential bullish move and marks the chart with a "BUY" label along with a green trend line from the candle's low. Conversely, when Negative movement crosses above Positive Movement, it signals bearish potential, showing a "SELL" label and a red trend line from the candle's high. It also plots the smoothed difference between to show trend strength.
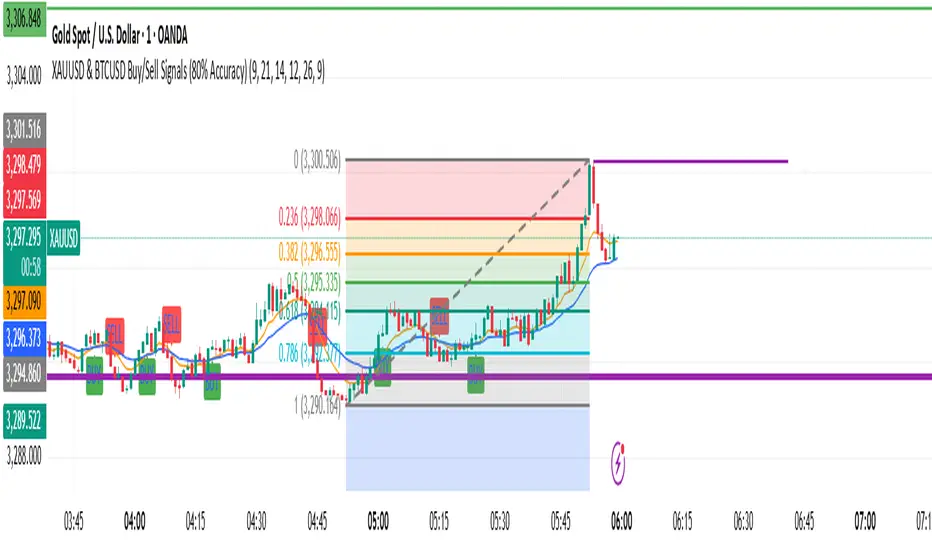
XAUUSD & BTCUSD Buy/Sell Signals (80% Accuracy)this script gives approx 80% real and correct indicators depending on market
Midnight OpenMidnight Opening Price because there wasn't a single indicator that was specifically marking this.

Wx2 Treasure Box – Institutional Entry🧩 Indicator Overview: Wx2 Treasure Box – Institutional Entry
Designed to detect Institutional Bars (IBs) and visualize high-probability entry zones, this script helps traders align with potential smart-money activity.
Institutional Bars are defined as Entry of Smart Money
⚙️ How It Works
20-period and 200-period Simple Moving Averages are plotted to show short‑ and long‑term trend direction.
On identification of an IB:
A label “IB” is placed above the bar.
A rectangular box is drawn around its high–low range, extending several bars to the right to mark the trade zone
Trade Signals & Setup Guidelines
Buy Entry:
Trigger: Price breaks above the box.
Stop Loss (SL): Set just below the box bottom.
Sell Entry:
Trigger: Price piercing below the box.
SL: Placed above the box top.
Risk-to-Reward Ratio (RRR):
Target RRR of 1:2 is recommended
Best Execution Zone:
Treasure Box is the best with 20SMA+200 SMA+Price in it.
📽️ Video Link
You’ve linked a YouTube video for explanation:
Watch Here


EMA 8 & 21 crossover change EMA 8 & 21 crossover change Indicator This custom TradingView indicator highlights trend shifts by changing candle colors when the 8 EMA crosses the 21 EMA. Bullish crossovers turn candles different color, while bearish crossovers turns different as well—making it easy to visually identify emerging trends and momentum shifts in real time.

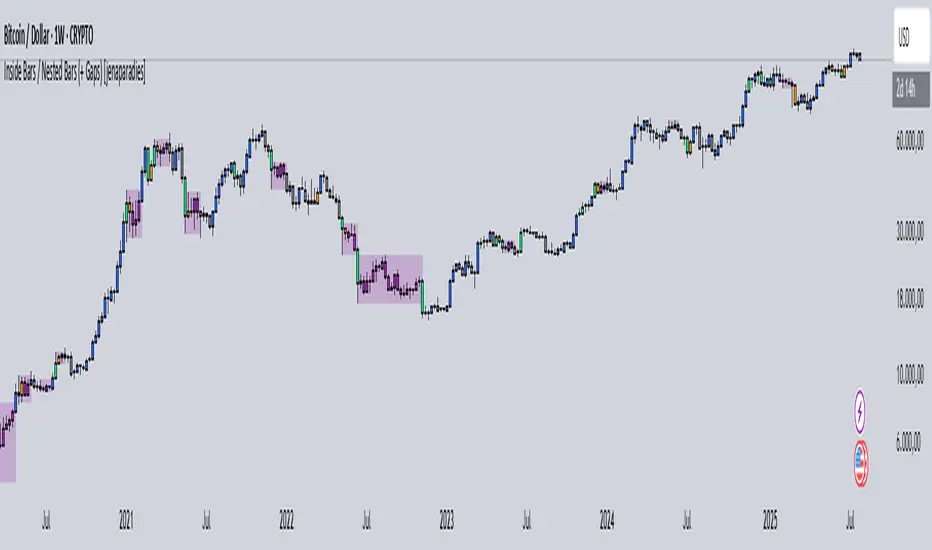
Inside Bars / Nested Bars (+ Gaps) [jenaparadies]📌 Features
Highlight inside bars
Highlight bars that remain within the range of a mother bar (called nested bars )
Highlight the mother bar (optional)
Highlight consecutive nested bars using a visual box (optional)
Enable no-gap candle logic (optional, see below)
Show no-gap candles on the chart (optional)
Fully customizable colors and appearance
📌 Method
An inside bar is any candle whose high is lower than or equal to the previous candle's high, and whose low is higher than or equal to the previous candle's low. In other words, the entire price action of the inside bar remains within the range of the previous candle without exceeding it. The preceding candle is referred to as the mother bar .
Occasionally, the candle following the inside bar may break above or below the inside bar's range, while still remaining fully within the high and low of the mother bar. These candles are referred to as nested bars and are highlighted in a different color.
Optionally, sequences of consecutive nested bars can be enclosed within a box to emphasize consolidation zones.
📌 No-Gap Candles (Optional)
This feature adjusts each candle’s opening price so that it matches the closing price of the previous candle. It is particularly useful for assets that frequently experience large gaps between candles.
By extending each candle's effective range to include the previous candle's close, the indicator maintains structural consistency over timeframes, especially when the open price deviates significantly from the prior close. Inside bars are then identified relative to the extended range of the mother bar.
Optionally, the adjusted no-gap candles can be visualized directly on the chart for better clarity.
🎁 Bonus
Activating the "Show No-Gap Candles" option transforms any line chart into a gap-free bar chart ‒ ideal for visualizing economic data such as inflation rates.
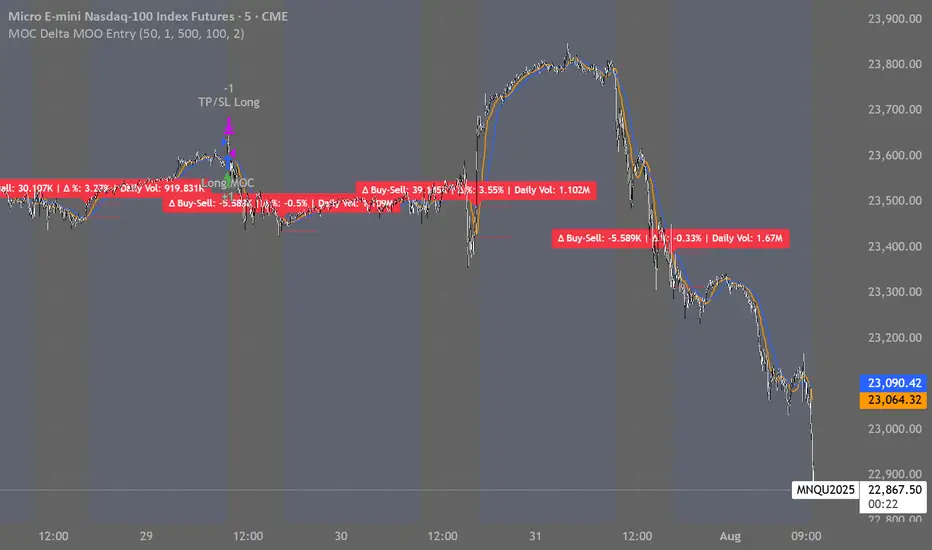
MOC Delta MOO Entry
This model is a momentum-based futures strategy that uses the buy/sell delta during the MOC window (3:50–3:59 EST) to determine market sentiment. If the MOC delta exceeds a customizable percentage of total daily volume, a trade is triggered at the next day’s 9:30 open, but only if the price opens above or below the 15 and 30 SMAs (for long or short entries, respectively). All trades are exited at 3:50 PM EST on the same day.
BTC 1m Chop Top/Bottom Reversal (Stable Entries)Strategy Description: BTC 5m Chop Top/Bottom Reversal (Stable Entries)
This strategy is engineered to capture precise reversal points during Bitcoin’s choppy or sideways price action on the 5-minute timeframe. It identifies short-term tops and bottoms using a confluence of volatility bands, momentum indicators, and price structure, optimized for high-probability scalping and intraday reversals.
Core Logic:
Volatility Filter: Uses an EMA with ATR bands to define overextended price zones.
Momentum Divergence: Confirms reversals using RSI and MACD histogram shifts.
Price Action Filter: Requires candle confirmation in the direction of the trade.
Locked Signal Logic: Prevents repaints and disappearing trades by confirming signals only once per bar.
Trade Parameters:
Short Entry: Above upper band + overbought RSI + weakening MACD + bearish candle
Long Entry: Below lower band + oversold RSI + strengthening MACD + bullish candle
Take Profit: ±0.75%
Stop Loss: ±0.4%
This setup is tuned for traders using tight risk control and leverage, where execution precision and minimal drawdown tolerance are critical.

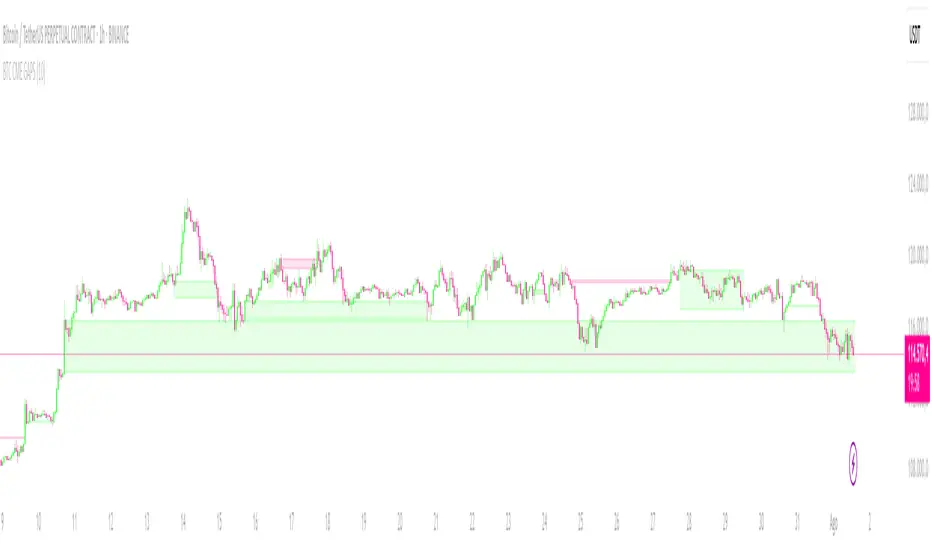
CRYPTO CME GAPS- Can be used in any crypto symbol of any exchange, (not necessarily the CME exchange)
- Displays the CME gaps with the colors green or red depending on the sentiment of the gap
- Extends the gaps displayed until they are filled.
- In the end of the code there are the boolean values 'filled_bull' and 'filled_bear' that can be used to create a strategy script.