Multi-Tool Nasdaq US100 IndikatorA combination of several tools such as moving averages (EMA 50, 100, 200), Fibonacci retracements, pivot points, RSI (Relative Strength Index), order blocks, fair value gaps, supply and demand zones, and a simple volume profile.
The indicator is designed to enable high profitability by combining various established technical analysis approaches into one tool, facilitating decision-making regarding entry and exit points.
The script can be integrated and used directly in TradingView by creating a new indicator script and pasting the code there.
Candlestick analysis

Highlight Candle with Half Volume on CloseIt checks volume of the current candle and compares with previous candle,
if volume is low then it highlights the candle. Lines are configurable.

🐿️ Squirrel of Wall Street This indicator is provided for educational and informational purposes only. It does not constitute a buy or sell recommendation. The user is solely responsible for any trading decisions. Always do your own research and use appropriate risk management.
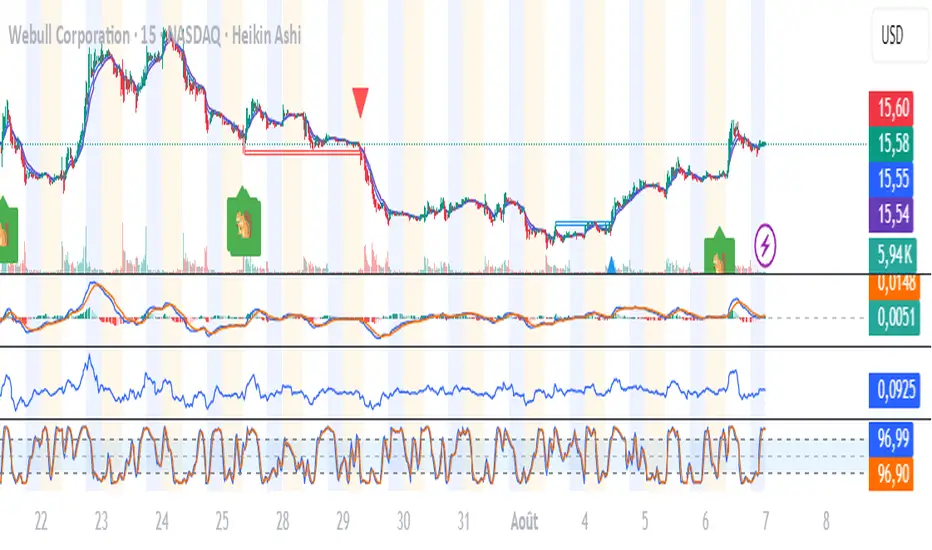
SquirrelofwallstreetAlien technologia
possible strategic entrie
English:
This content is provided for informational purposes only. We disclaim any responsibility for how it may be used. Please consult a qualified professional for any specific advice.


ORB Scalp setup by Unenbat With Signal**ORB Scalp Setup by Unenbat with Signal**
This indicator visualizes a custom Opening Range Breakout (ORB) strategy using a 6-minute range split across the end of one hour and the start of the next. It identifies two key trade setups using 1-hour candles:
* **Reverse Signals:** Triggered when the second 1H candle breaks the previous high/low but closes back inside, signaling a reversal.
* **Continuation Signals:** Triggered when the second 1H candle breaks and closes beyond the previous candle’s range, confirming trend continuation.
SL/TP zones are plotted accordingly, with optional fill coloring. No trades are displayed during "inside bars" or "manipulation" candles.

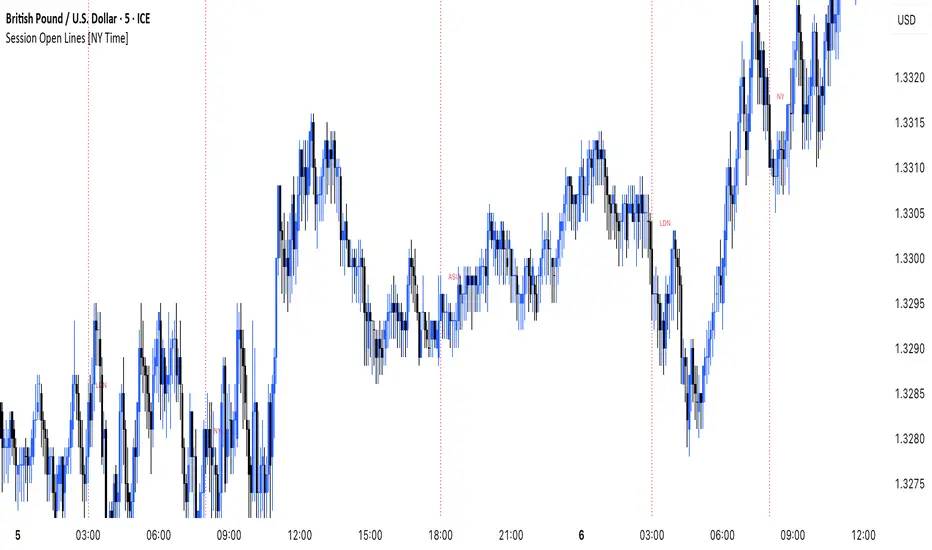
MANI SESSIONSOANDA:GBPUSD This indicator marks the opening times of the three main trading sessions — Asia, London, and New York — using vertical red dotted lines on the chart.
Each session is labeled with a minimal tag (“ASIA”, “LDN”, “NY”) displayed directly on the line for clean and unobtrusive reference.
All session times are based on the New York time zone and adjust automatically for each new day.
This tool helps intraday traders quickly identify session shifts, plan entries around high-volume hours, and stay locked into session-based strategy.
OANDA:GBPUSD
KAP RSI 14 & 2 (fixe)What does this indicator do?
It calculates two different RSIs:
The classic RSI with a 14-period (RSI 14) — measures the strength of price moves over 14 bars.
A faster RSI with a 2-period (RSI 2) — very sensitive, useful to spot short-term extreme conditions.
It displays these two RSI values in a fixed table at the top right corner of the chart, so the dashboard stays visible even when you scroll or zoom.
Each RSI value is colored:
Red when the RSI is at extreme levels (RSI 14 above 75 or below 30, RSI 2 above 95 or below 5), signaling overbought or oversold conditions.
Green when RSI is in a normal range.
Why is it useful?
It lets you quickly see the market’s condition with two RSI timeframes without searching the chart.
You monitor both medium-term trend strength (RSI 14) and short-term extreme signals (RSI 2).
The fixed dashboard makes it easy to keep an eye on these values at all times.
Customization options
You can choose which corner of the screen to place the dashboard (top-left, top-right, bottom-left, bottom-right).
The background is semi-transparent so it doesn’t cover the chart details.


Order Blocks & FVG con Mitigación CRISVASPERIdentifica Bloques de ordenes y FVG, pero muestra el porcentaje de mitigaciones
Green Light Confluence - Control-AIt scans the top 15 U.S. stocks in real time — including names like NASDAQ:AAPL , NASDAQ:AMZN , NASDAQ:NVDA , NASDAQ:GOOGL , NASDAQ:TSLA , and NASDAQ:MSFT — and identifies whether the majority are trending above or below their 200 EMA on the 1-minute chart.


Enhanced Signal Bridge V1For the trading Careers members only base script for any pair on any time frame ( please double check as still a new script)

ORB M15 EarThRiseRAcest indicator trasează automat liniile de high și low pentru candela de 15 minute de la London Open, cu posibilitatea de a schimba culoarea și grosimea liniilor din setări. Ideal pentru strategii de tip opening range breakout. Compatibil cu orice instrument și funcționează pe timeframe de 15 minute.


Holy Grail Signal op EMA + ADXHolygrail + adx indicator with buy signals so you can buy at the yellow arrow

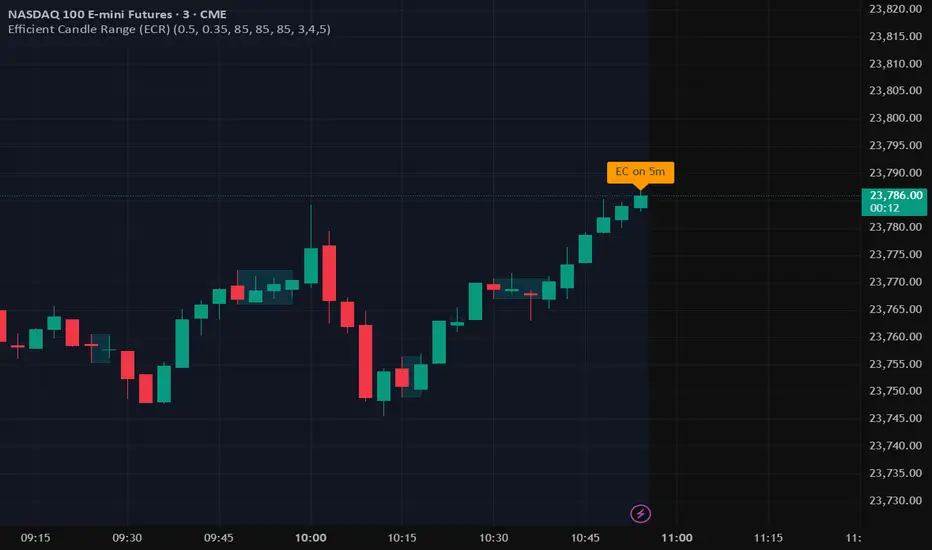
Efficient Candle Range (ECR)Efficient Candle Range (ECR)
A custom-built concept designed to detect zones of efficient price movement, often signaling the start, pause, or end of an implied move.
What is the Efficient Candle Range?
The Efficient Candle Range (ECR) is a unique tool that identifies price zones based on efficient candles—candles with relatively small bodies and balanced wicks. These candles reflect balanced or orderly price action, and when grouped into a range, they can reveal areas of temporary equilibrium in the market.
Rather than focusing on single candles, ECR builds a range that dynamically adjusts as new efficient candles form. This gives traders an objective way to track potential areas of absorption, distribution, or transition.
Why use ECR?
Efficient candles often occur:
At the beginning of a new move, after a liquidity sweep or shift in sentiment
At the end of a strong move, as momentum fades
Within consolidation zones, where price trades in a balanced, indecisive state
While ECRs can appear in any market condition, their interpretation depends on context:
In a range, an ECR might just reflect sideways balance.
But after a sweep or breakout, it could signal a potential shift in direction or continuation.
A close outside the ECR often marks the end of that balance and the start of a new impulse.
How it works
The script detects efficient candles based on body-to-range ratio and wick symmetry.
Consecutive ECs are grouped into a live ECR box.
The box dynamically extends as long as price stays inside the high-low range.
Once a candle closes outside, the ECR is considered invalid (fades visually, but remains visible for reference).
Each active range is labeled "ECR" within the box for easy tracking.
Customizable in settings
Max body percentage of range
Max wick imbalance
Box and label color/transparency
Suggested usage
Let the ECR define your observation zone.
Instead of reacting immediately to an efficient candle, wait for a confirmed breakout from the ECR to validate the next move.
Whether you trade breakouts, reversals, or continuation setups, ECR provides an objective way to visualize price balance and understand when the market is likely to expand.
Designed for individual traders looking to build structure around efficient price movement — no specific methodology required.
Bollinger Band Touch with EMA Filter (Inverted, Alerts)Bollinger Band Touch with EMA Filter above or below the 100 nd 200 emas
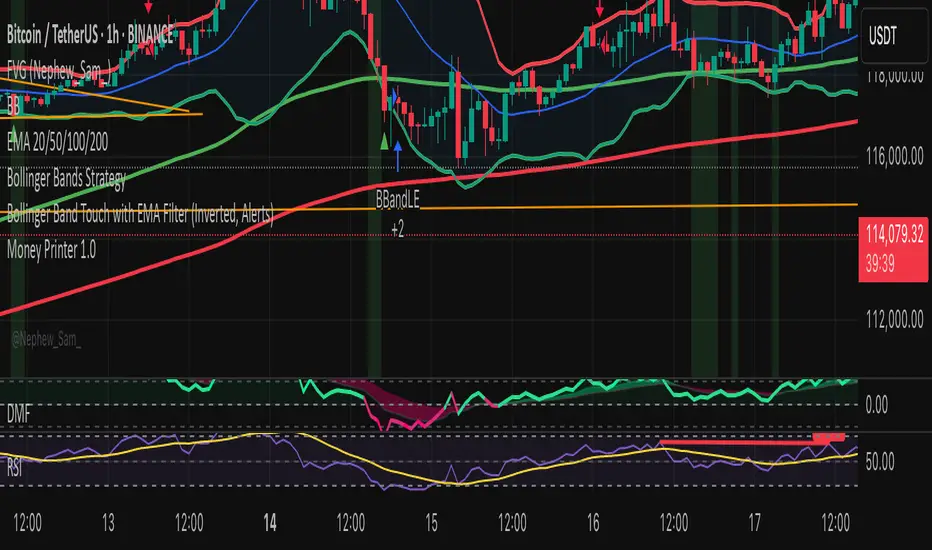
Bollinger Band Touch with EMA Filterbollomger band strategy above and below the 100 and above the 200

First 5-Minute Candle Wicks (17:30 UTC+4) - All Days By HaykFirst 5-Minute Candle Wicks high and low
this enables the user to see the first candle highs nd lows so it can take actions with fvg and find directions

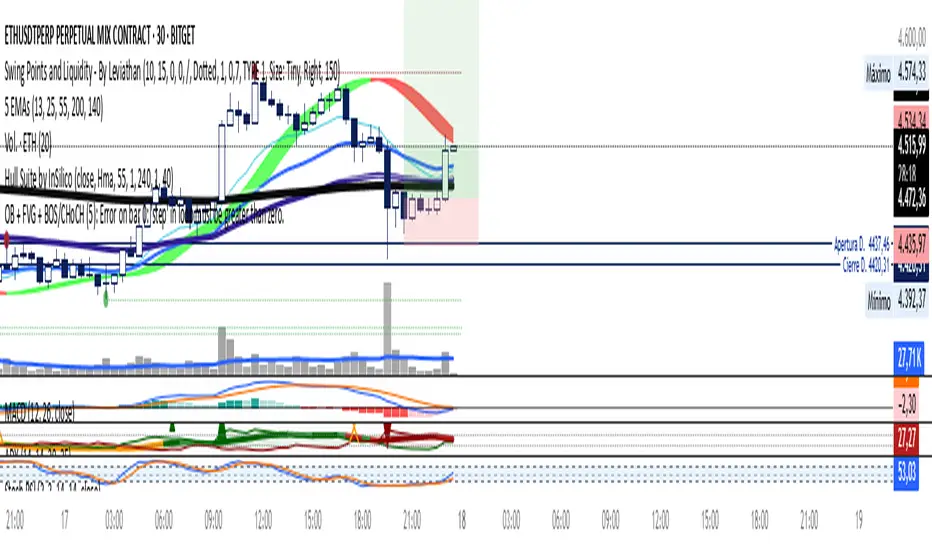
Kumo no Nami Trend Strength Identifier T2[T69]🧠 Overview
Kumo no Nami is a custom trend strength indicator that combines Ichimoku cloud dynamics (Kumo) with wave momentum (Nami) to identify trend direction, reversals, squeezes, and breakouts using Z-Score analysis. It adapts to different modes (Ichimoku, MA, EMA) for a flexible interpretation of price structure tension vs. movement strength.
🔍 Core Logic
Kumo Width (Cloud Pressure): Measures the normalized spread (Z-Score) between two dynamic price levels (e.g., Senkou A-B or Base-Tenkan).
Nami Strength (Wave Energy): Measures how far current price dislocates from a recent range using Z-Score of the difference between close and Donchian/MA.
Z-Score Normalization: Ensures both metrics are statistically comparable, regardless of volatility regime.
Squeeze Detection: Identifies compression before potential volatility expansion.
Breakout/False Break: Detects whether movement is legitimate or noise.
Final Top/Bottom: Highlights a strong burst post-squeeze, often signaling exhaustion or trend climax.
⚙️ Features
🌀 Multiple Kumo Modes:
Kijun-Tenkan
Senkou A - B
SMA Fast - Slow
EMA Fast - Slow
🟨 Z-Score Based Squeeze Monitoring
🟥 Final Burst Alerts
🟩 Trend Continuation or Fake-out Detection
🎨 Dynamic Background Coloring for visual signal clarity
🔧 Configuration
📊 Inputs
Kumo Mode (kt, sab, sfs, efs) – Choose method to compute Kumo (Cloud) width.
Kumo Lookback – Lookback period for cloud Z-Score analysis.
Nami Lookback – Lookback period for wave dislocation measurement.
Squeeze Threshold – How low Z-Kumo must fall to signal potential squeeze.
Burst Thresholds:
Burst Kumo → Z-Kumo must rise above this to be considered bursting.
Burst Nami → Nami Strength threshold for final trend climax.
Ichimoku Config – Tenkan, Kijun, Senkou B, and displacement.
MA Config – For Fast/Slow variants, SMA/EMA lengths.
🧪 How It Works
Compute the Kumo Width depending on selected mode.
E.g., |Tenkan - Kijun| or |Senkou A - Senkou B|
Normalize this width with its Z-Score to get Z-Kumo Width.
Compute Nami Strength:
Z-Score of how far close deviates from a Donchian channel or moving average.
Evaluate signal logic based on the two:
📈 Behavior & Signals
Trend Range (Sideways Consolidation)
=>Z-Kumo < 0 and |Nami Strength| > 2
False Break (No meaningful price movement)
=>Z-Kumo < 1 and |Nami Strength| < 1
Squeeze Watch (Potential breakout loading)
=>Z-Kumo < Squeeze Threshold
Final Burst / Climax
=>Z-Kumo > 2.5 and |Nami Strength| > 3
Bullish Breakout
=>Z-Kumo > 1 and Nami Strength > 2 and not false break
Bearish Breakout
=>Z-Kumo > 1 and Nami Strength < -2 and not false break
Reversal Detection
Crossovers of Nami Strength across 0 (bull/bear) while not in squeeze
🧠 Advanced Concepts Used
Z-Score:
=>(value - mean) / standard deviation for detecting statistically significant moves.
Squeeze Principle:
=>Low volatility → potential buildup → expansion.
Price Dislocation (Wave Strength):
=>Measures how far current price is from its mean range.
=>Cloud Tension (Kumo Z-Score):
=>Reflects pressure or neutrality in the price structure.
Trend Confirmation:
=>Only if both metrics agree and no false break conditions are met.

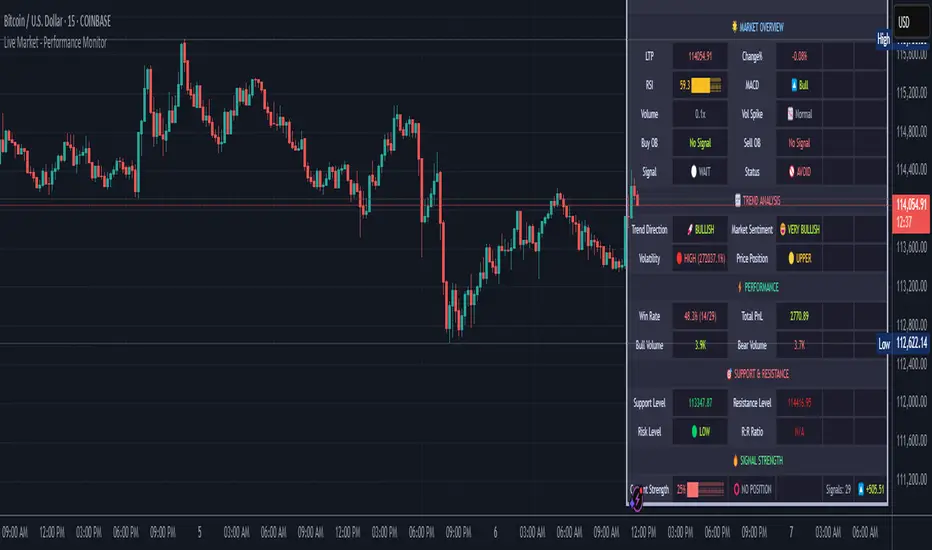
Live Market - Performance MonitorLive Market - Performance Monitor – Study Material & Usage Guide
Overview:
The Live Market - Performance Monitor is a multi-layered TradingView indicator that assists traders in identifying high-probability setups by combining key technical elements: order block detection, dynamic trendline analysis, volume and volatility filtering, signal validation, and ATR-based target projection. This guide provides the essential logic, formulas, and practical steps to help users apply the system effectively.
________________________________________
Key Functional Features and Formulas
________________________________________
1. Order Block Detection
The indicator identifies price zones where strong institutional buying or selling has likely occurred, based on candle sequences.
• User Input: Number of consecutive candles to define relevance (e.g., 3–7 bars)
• Validation Formula:
• Price Move % = |Close(n) - Close(1)| / Close(n) × 100
• Bullish Order Block: A bearish candle followed by consecutive bullish candles
• Bearish Order Block: A bullish candle followed by consecutive bearish candles
Only valid zones that meet a minimum price move threshold are retained and plotted.
________________________________________
2. Trendline Logic
Trendlines are dynamically plotted using price pivots.
• Pivot Calculation: Highs and lows over a lookback period (e.g., 10 bars)
• Trendline Slope:
• Slope = (Pivot_new - Pivot_old) / (Time_new - Time_old)
• Trendline Projection:
• Projected Price = StartPrice + Slope × (CurrentTime - StartTime)
These lines act as dynamic support/resistance zones and are used to confirm breakout trades.
________________________________________
3. Volume and ATR Filters
Signals are filtered using real-time volume and volatility analysis to eliminate low-quality setups.
• Average Volume:
• AvgVol = SMA(Volume, 20)
• Volume Spike Condition:
• Volume > AvgVol × VolumeThreshold
• ATR (Volatility Filter) – Calculated using 14-bar period:
• (High - Low) > ATR × ATRMultiplier
When both filters are passed, the market is considered active and valid for trade.
________________________________________
4. Signal Generation Logic
• Bullish Signal: Triggered when:
o Price breaks above a resistance zone or bullish order block
o Volume and ATR filters confirm activity
o Trend alignment: EMA9 > EMA21 > EMA50
• Bearish Signal: Triggered under opposite conditions:
o Price breaks below a support zone or bearish order block
o Trend alignment: EMA9 < EMA21 < EMA50
Labels such as "BUY" or "SELL" appear on the chart at the trigger candle.
________________________________________
5. Target and Stop Loss Projection
The script dynamically calculates TP (take profit) and SL (stop loss) levels based on the ATR.
• For Long Trades:
• TP = High + (ATR × 2)
• SL = Low - (ATR × 1)
• For Short Trades:
• TP = Low - (ATR × 2)
• SL = High + (ATR × 1)
These levels are plotted on the chart and adjust as price evolves.
________________________________________
6. Performance Tracking
The script automatically tracks wins and losses for each signal based on TP/SL outcomes.
• Win Rate Formula:
• Win Rate (%) = (Number of Wins / Total Signals) × 100
This is useful for evaluating the system over time and adjusting risk or position sizing.
________________________________________
Practical Usage Steps
1. Apply the Indicator
o Add to your chart via Pine Editor or Indicators menu.
o Configure all input parameters including OB periods, pivot lookback, volume threshold, and ATR multiplier.
2. Signal Monitoring
o Wait for a "BUY" or "SELL" label to appear on the chart.
o Confirm alignment using:
EMA trend stacking (e.g., EMA9 > EMA21 > EMA50)
RSI/MACD momentum
Volume and ATR filters
3. Trade Execution
o Enter the trade on the candle following the signal.
o Use the plotted TP/SL lines to manage the trade.
o Monitor price action; exit if trend shifts or targets are achieved.
4. Review Performance
o Use the win rate and PnL counters to monitor your success.
o Analyze losing trades for trend or filter failures and optimize settings accordingly.
________________________________________
Alerts
The script includes alert support for:
• Signal Triggers: BUY or SELL label detection
• Take Profit / Stop Loss Hits: Automatically notifies when TP or SL is reached
These can be configured for push, email, or webhook delivery via TradingView alert settings.
________________________________________
Disclaimer from aiTrendview
This tool and the content provided by aiTrendview.com are for educational and research purposes only. They do not constitute investment advice, trading recommendations, or financial guidance. All forms of trading involve significant risk. Past performance does not guarantee future outcomes. Users are fully responsible for their trading decisions, including risk management, position sizing, and due diligence. It is strongly advised to test all strategies on a demo account before applying them to live capital. Consult a licensed financial advisor if necessary.