Candlestick analysis

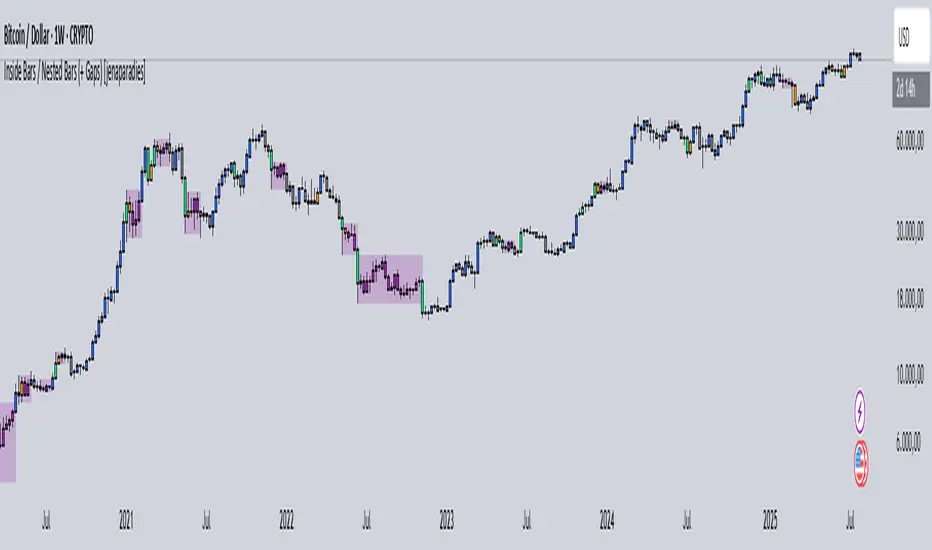
Inside Bars / Nested Bars (+ Gaps) [jenaparadies]📌 Features
Highlight inside bars
Highlight bars that remain within the range of a mother bar (called nested bars )
Highlight the mother bar (optional)
Highlight consecutive nested bars using a visual box (optional)
Enable no-gap candle logic (optional, see below)
Show no-gap candles on the chart (optional)
Fully customizable colors and appearance
📌 Method
An inside bar is any candle whose high is lower than or equal to the previous candle's high, and whose low is higher than or equal to the previous candle's low. In other words, the entire price action of the inside bar remains within the range of the previous candle without exceeding it. The preceding candle is referred to as the mother bar .
Occasionally, the candle following the inside bar may break above or below the inside bar's range, while still remaining fully within the high and low of the mother bar. These candles are referred to as nested bars and are highlighted in a different color.
Optionally, sequences of consecutive nested bars can be enclosed within a box to emphasize consolidation zones.
📌 No-Gap Candles (Optional)
This feature adjusts each candle’s opening price so that it matches the closing price of the previous candle. It is particularly useful for assets that frequently experience large gaps between candles.
By extending each candle's effective range to include the previous candle's close, the indicator maintains structural consistency over timeframes, especially when the open price deviates significantly from the prior close. Inside bars are then identified relative to the extended range of the mother bar.
Optionally, the adjusted no-gap candles can be visualized directly on the chart for better clarity.
🎁 Bonus
Activating the "Show No-Gap Candles" option transforms any line chart into a gap-free bar chart ‒ ideal for visualizing economic data such as inflation rates.
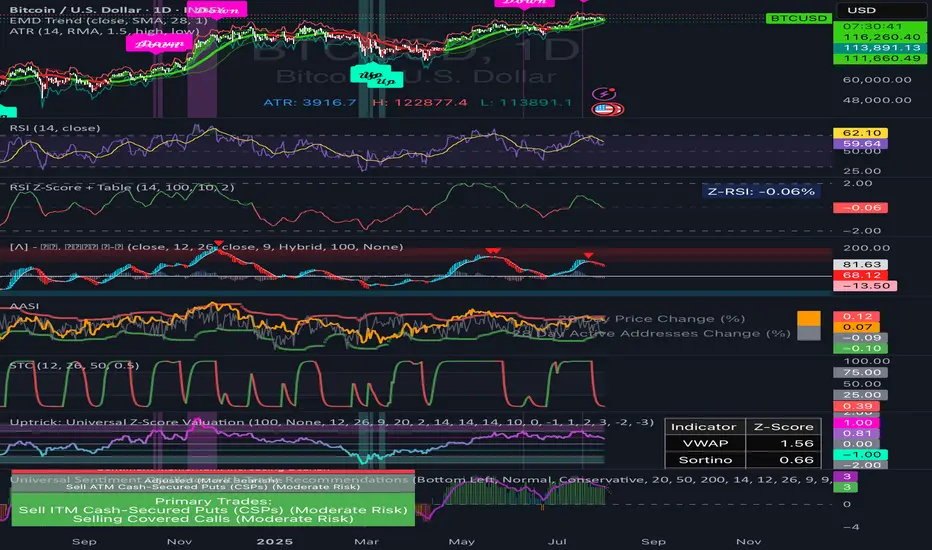
RSI Z‑Score + TableRSI Z-Score + Table
This script calculates the Z-Score of the RSI (Relative Strength Index), which standardizes RSI based on its own recent history.
What It Shows:
RSI Z-Score = (Current RSI - Mean RSI) / Standard Deviation
This tells you how extreme the current RSI is compared to its historical values.
A table displays:
Current RSI
Rolling Mean
RSI Z-Score
How to Use:
Z-Score > +2 = Statistically overbought
Z-Score < -2 = Statistically oversold
Use it to time reversals or overextension in RSI behavior.
🔒 Based on rolling lookback window — fully customizable.
Author:
Tags: #RSI #ZScore #Momentum #StatisticalEdge #MeanReversion #Crypto

ICT OTE Market MakerICT OTE Market Maker
Implementing ICT and automatically identifies OTE zones to minimize drawdowns.
Kairi Trend Oscillator [T3][T69]📌 Overview
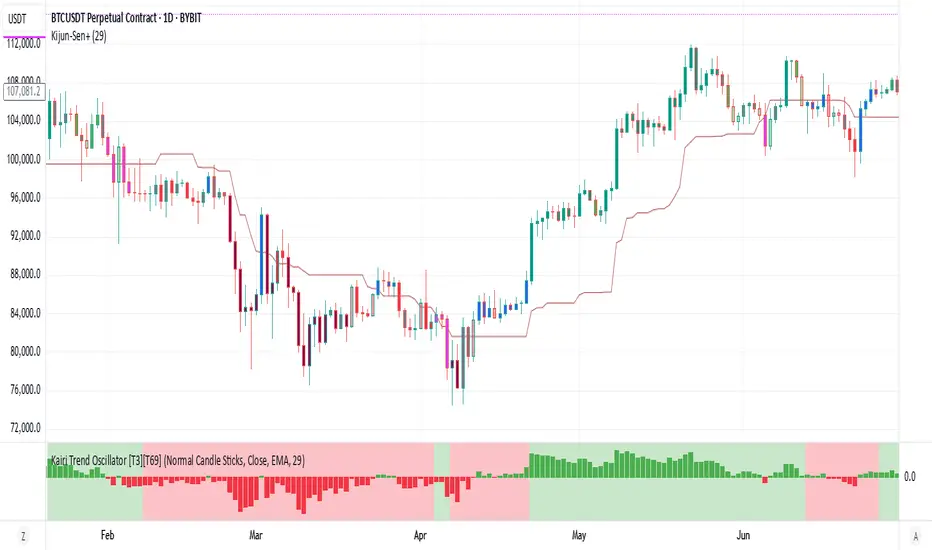
The Kairi Trend Oscillator is a Japanese-inspired hybrid oscillator combining Heikin-Ashi trend clarity with the Kairi (乖離率) indicator — a measure of price deviation from a moving average. This dual-layer system gives you both trend direction and trend strength/health, designed to highlight trend maturity and avoid overextended entries.
✨ Features
Heikin-Ashi or normal candlestick input modes
Multiple moving average options: SMA, EMA, DEMA, VWMA, and Kijun
Visual color-coded trend zones: overbought, oversold, healthy, weak, and reversal conditions
Full Kairi column plot with dynamic coloring
Adaptive logic for trend detection (linear regression or Heikin-Ashi structure)
Built-in reversal detection based on divergence between Kairi and trend direction
⚙️ How to Use
Choose Candle Type: Select Heiken Ashi or Normal Candlesticks via the Candle Mode dropdown.
Select Source: Choose open, high, low, or close as the input for Kairi computation.
Set MA Type & Length: Configure the moving average mode and its length under Moving Average Settings.
Interpret the Plot:
Green/Red bars: Show Kairi oscillator values above/below 0
Background color: Shows current trend (green = uptrend, red = downtrend)
Candle color overlays:
🟩 Teal = Overextended Bulls
🟥 Maroon = Overextended Bears
✅ Green = Healthy Uptrend
🔻 Red = Healthy Downtrend
🟨 Light tones = Weak trends
🔄 Blue/Fuchsia = Possible reversal detected
🔧 Configuration
Inputs:
Candle Mode: Heiken Ashi or Normal Candle Sticks
Source: Open, High, Low, Close
MA Mode: SMA, EMA, DEMA, VWMA, or Kijun
MA Length: Default is 29
🧪 Advanced Tips
Use Heikin-Ashi mode for better trend smoothing.
Kairi divergence (e.g., bullish Kairi in a downtrend) may signal upcoming reversal — watch for blue or fuchsia bars.
Combine with momentum indicators (e.g. RSI or MACD) for confluence-based setups.
For mean reversion strategies, fade extreme Kairi readings (> ±5%).
⚠️ Limitations
Not suited for ranging markets without trend.
Kairi extremes may remain elevated in strong trends — avoid early counter-trend entries.
Reversal logic is not a confirmation signal; use with caution.
📌 Disclaimer
This script is educational and illustrative. Always backtest thoroughly before using in live markets.
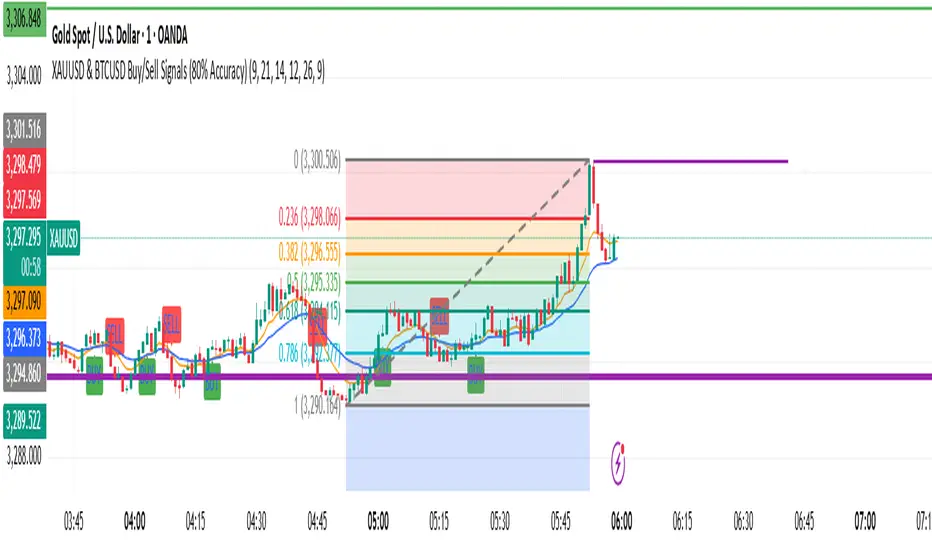
XAUUSD & BTCUSD Buy/Sell Signals (80% Accuracy)this script gives approx 80% real and correct indicators depending on market
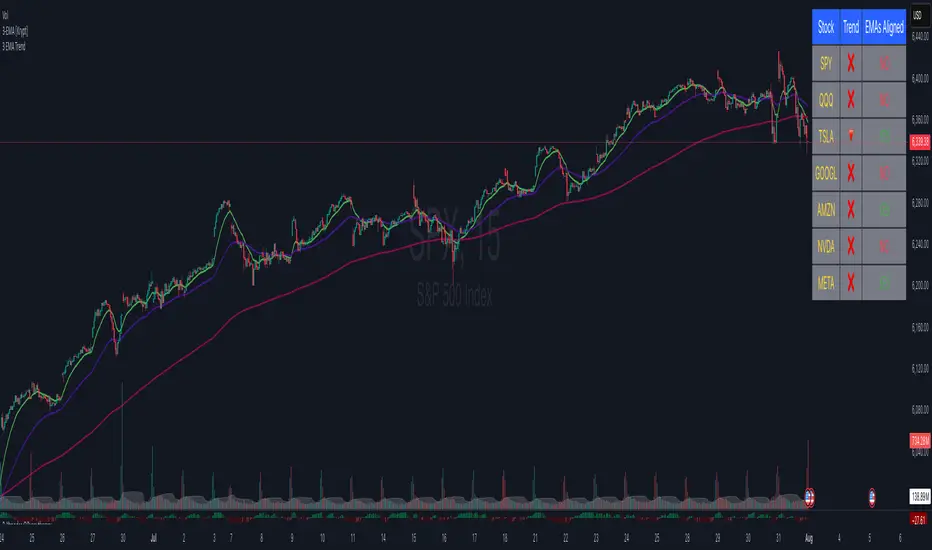
3 EMA cross overThis Pine Script displays the 3 EMA trend status for a list of popular stocks in a dynamic table. It calculates and monitors 13 EMA, 48 EMA, and 200 EMA for each ticker to detect bullish or bearish alignment.
Best Use:
Use this script to quickly scan market trends across multiple stocks and identify potential trade opportunities based on EMA alignment.
EMA 8 & 21 crossover change EMA 8 & 21 crossover change Indicator This custom TradingView indicator highlights trend shifts by changing candle colors when the 8 EMA crosses the 21 EMA. Bullish crossovers turn candles different color, while bearish crossovers turns different as well—making it easy to visually identify emerging trends and momentum shifts in real time.

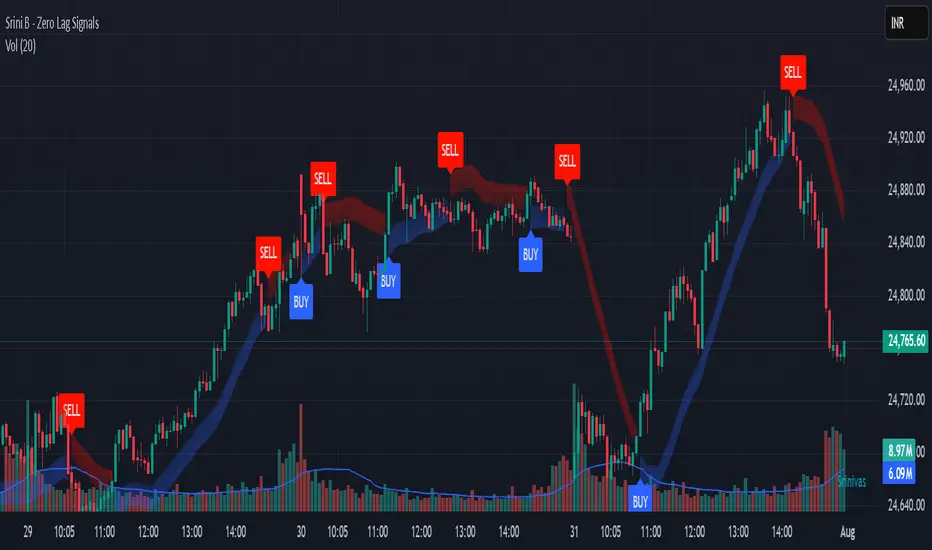
Srini B - Zero Lag Trend SignalsFinal version with minor changes. This indicator displays buy & sell alerts as per settings defined and comes out really well. Just my own personal indicator for own use.
Manual 1H Trend BackgroundThis TradingView Pine Script v6 indicator allows you to manually set the trend direction (based on your analysis of the 1-hour timeframe), and it will change the background color of your chart based on that input:
"Buy" → chart background turns green
"Sell" → chart background turns red
"Neutral" → no background color (transparent)

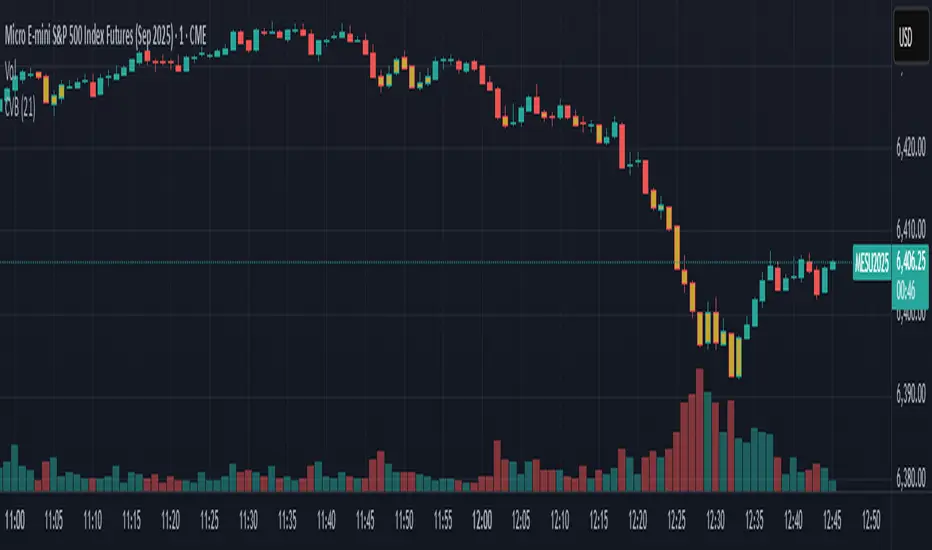
Coefficient of Variance BarsThe script calculates the Coefficient of Variance (CV), which is the standard deviation (a measure of volatility) divided by the average price over a set period. In simple terms, it tells you how volatile the market is in relation to its current price level.
• Highlighting Volatility Increase: By default, the script colors the bars when this relative volatility makes a new high. This suggests that the market is "waking up" and that a significant price move could be starting.
• Highlighting Low Volatility (Inverse Mode): When you uncheck the box in the settings, it highlights periods where volatility is not making a new high. This is useful for spotting quiet, consolidating markets.
________________________________________
How to Use It in Trading
This indicator is a complementary tool and should be used with other forms of analysis, like price action or trend indicators.
1. Spotting Potential Breakouts
The most common use is to anticipate breakouts. When the price is moving in a tight range (consolidation) and you suddenly see a highlighted bar, it signals a surge in volatility. This is often the catalyst that pushes the price out of the range.
• Strategy: Look for a period of price consolidation. When a bar is colored, indicating a volatility spike, look for a confirmation of a breakout (e.g., a candle closing above resistance or below support) and consider entering a trade in that direction.
2. Identifying Ranging Markets
By switching to the inverse mode, you can easily see when the market is quiet and range-bound.
• Strategy: When the bars are consistently highlighted in inverse mode, it confirms a ranging market. This is the ideal environment for strategies that capitalize on sideways movement, such as using oscillators (like RSI or Stochastics) to trade between support and resistance levels.
3. Gauging Trend Strength and Exhaustion
In a strong, ongoing trend, you'll likely see intermittent volatility spikes confirming the momentum. However, a sudden, massive spike in volatility after a very long trend might signal a "climax," potentially indicating the trend is exhausted and a reversal could be near.
MTF Clean Panelsit is bigger model of a earlier model then i have made earlier it helps you see multiple timeframes together and includes more daily timeframe and have also been introduced a new 4 hours candle structure

Momentum Commitment Delta (MCD)What it is
M C D fuses five micro-structure clues into one 0-to-1 score that says, “how hard are traders actually leaning on this move?”
1. Body-Delta Momentum – average net candle body direction.
2. Volume Commitment – up-volume ÷ down-volume over the same window.
3. Wick Compression – shrinking upper/lower wicks = clean conviction.
4. Candle Sequencing – rewards orderly, staircase-style body growth.
5. Pin Ratio – where the close pins inside each candle’s range.
The five factors are multiplied, then auto-normalized so extremes always land near 0 / 1 on any symbol or timeframe.
I recommend tweaking the settings to fit your edge, the pre-loaded settings may not be suitable for most traders. The MCD works on all timeframes as well :)
⸻
How to read basic signals
• Fresh cross above 0.70 → often the birth of a real breakout.
• Cluster of > 0.70 bars → “commitment lock,” pull-backs usually shallow.
• Price makes new high while M C D doesn’t → beware...
• Cross back below 0.30 after a run → momentum is out of fuel.
⸻
Because M C D is multiplicative, it’s hard to hit the extremes—so when the bars light lime green, the print is usually telling the truth.
I personally use the MCD to identify the peak of a high-conviction range, NOT a breakout. If a bar prints over 0.70 (green) and then a range forms off of the bar which exceeded 0.70, the breakout has a high chance to be explosive, regardless of what MCD reads at the breakout inflection point.
Play around with it, im sure there are plenty of other patterns.
Disclaimer: The Momentum Commitment Delta (MCD) indicator is provided strictly for educational and informational purposes. It does not constitute financial or investment advice, nor is it a recommendation to buy or sell any security. Trading involves substantial risk, and you should always perform your own due diligence and consult a qualified financial professional before making any trading decisions. Past performance is not indicative of future results.
RSI Z‑Score + TableRSI Z-Score + Table
This script calculates the Z-Score of the RSI (Relative Strength Index), which standardizes RSI based on its own recent history.
What It Shows:
RSI Z-Score = (Current RSI - Mean RSI) / Standard Deviation
This tells you how extreme the current RSI is compared to its historical values.
A table displays:
Current RSI
Rolling Mean
RSI Z-Score
How to Use:
Z-Score > +2 = Statistically overbought
Z-Score < -2 = Statistically oversold
Use it to time reversals or overextension in RSI behavior.
🔒 Based on rolling lookback window — fully customizable.
Author:
Tags: #RSI #ZScore #Momentum #StatisticalEdge #MeanReversion #Crypto
Intra Bullish Strategy - Profit Ping v4.0ProfitPing 4.0 is a high-precision intraday swing trading strategy designed for global equity markets, including the US, South Africa, and Australia. The system identifies high-probability BUY and EXIT signals using a confluence of technical indicators and real-time volume dynamics.
🧠 Key Features:
Dual EMA Crossover (7 & 14) for short-term trend confirmation
Volume Spike Detection based on 20-period moving average
RSI Momentum Filter (ideal zone: 55–65) to avoid overbought entries
MACD Histogram & Signal Line Sync for trend momentum validation
Candlestick Pattern Filtering (e.g. bullish engulfing, flags, breakout candles)
Multi-Timeframe Confirmation (optional) for intraday trend alignment
Dynamic Risk-to-Reward Logic built into alert framework
Webhook-compatible JSON alerts for automation to Google Sheets, Power BI, and IBKR
🛠️ Alert System:
BUY alert triggers when all bullish conditions align
EXIT alert triggers only if a previous BUY exists for that ticker
Trade status is updated live in Google Sheets and integrated with Power BI dashboards
Orphaned EXITs (no matched BUY) are tracked separately for accuracy review
🔄 Ideal For:
Traders seeking 1:2 to 1:5 risk/reward setups
Automation-focused workflows (via TradingView → Google Sheets → Power BI)
Swing traders wanting clean visual logs, automated P&L tracking, and optional IBKR execution
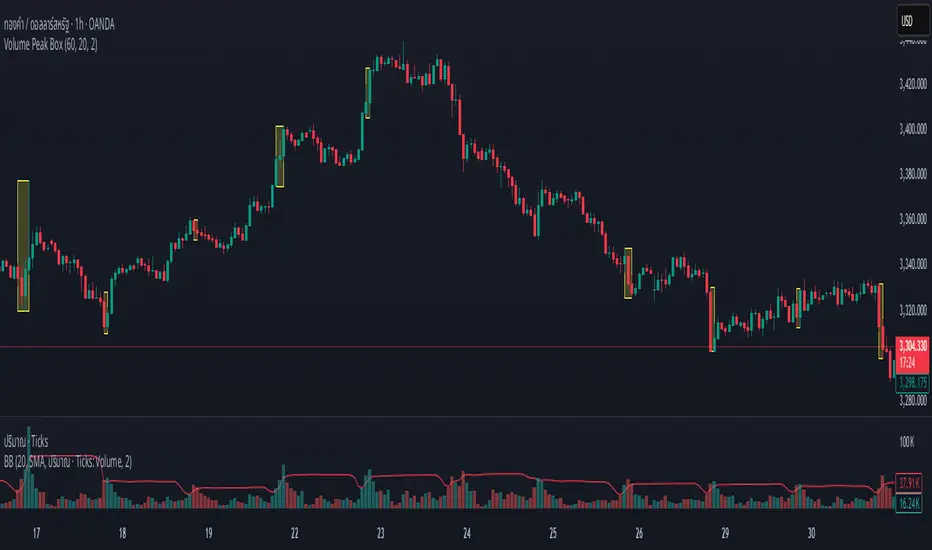
Volume Peak BoxTH Description
Volume Peak Box
อินดิเคเตอร์นี้ใช้ตรวจจับช่วงที่มี Volume สูงผิดปกติ โดยใช้ Bollinger Band กับข้อมูล Volume ที่ดึงจาก Timeframe ที่ล็อกไว้ (เช่น 1 ชั่วโมง) และจะแสดงผลในรูปแบบ กล่องครอบช่วงราคาสูง–ต่ำ ของช่วง Volume Peak นั้น
🔧 วิธีทำงาน:
คำนวณ Bollinger Band จาก Volume ของ Timeframe ที่กำหนด
ถ้า Volume สูงกว่า Upper Band → ถือว่าเป็น Volume Peak
วาดกล่องครอบ High–Low ของแท่งที่อยู่ในช่วง Volume Peak
กล่องจะแสดงบนทุก Timeframe แต่ใช้ข้อมูลจาก Timeframe ที่ล็อกไว้เท่านั้น
🧠 เหมาะสำหรับการดู:
โซน Breakout
การเคลื่อนไหวของสถาบัน
ความไม่สมดุลของอุปสงค์/อุปทาน
เหมาะมากหากใช้ร่วมกับการอ่านพฤติกรรมราคาใน Timeframe ย่อย เพื่อดูปฏิกิริยาราคาต่อแรง Volume จาก Timeframe ใหญ่
________________
ENG Description
Volume Peak Box
This indicator detects volume spikes based on Bollinger Bands applied to volume from a locked timeframe (e.g. 1H), and draws a box around the price range during those peak periods.
🔧 How it works:
Calculates Bollinger Bands on volume from the selected timeframe.
If volume exceeds the upper band, it is marked as a volume peak.
When a volume peak starts and ends, the indicator draws a box covering the high–low price range during that period.
These boxes remain visible on all timeframes, but always reflect data from the locked timeframe.
🧠 Great for identifying:
Breakout zones
Institutional activity
Supply/demand imbalances
Tip: Use with lower timeframe price action to see how the market reacts near volume peaks from higher timeframes.
ATR Plots + OverlayATR Plots + Overlay
This tool calculates and displays Average True Range (ATR)-based levels on your chart for any selected timeframe, giving traders a quick visual reference for expected price movement relative to the most recent bar’s open price. It plots guide levels above and below that open and shows how much of the typical ATR-based range has already been covered—all in one interactive table and on-chart overlay.
What It Does
ATR Calculation:
Uses true range data over a user-defined period (default 14), smoothed via RMA, SMA, EMA, or WMA, on the selected timeframe (e.g., 1h, 4h, daily) to calculate the ATR value.
Projected Levels:
Plots four reference levels relative to the open price of the most recent bar on the chosen timeframe:
+100% ATR: Open + ATR
+50% ATR: Open + 50% of ATR
−50% ATR: Open − 50% of ATR
−100% ATR: Open − ATR
Coverage %:
Tracks high and low prices for the current session on the selected timeframe and calculates what percentage of the ATR has already been covered:
Coverage % = (High − Low) ÷ ATR × 100
Interactive Table:
Shows the ATR value and current coverage percentage in a customizable table overlay. Position, color scheme, borders, transparency, and an optional empty top row are all adjustable via settings.
Customization Options
Table Settings:
Position the table (top/bottom × left/right).
Customize background color, text color, border color, and thickness.
Optionally add an empty top row for spacing.
Line Settings:
Choose color, line style (solid/dotted/dashed), and width.
Lines automatically update with each new bar on the selected timeframe, anchored to that bar’s open price.
General Inputs:
ATR length (number of bars).
Smoothing method (RMA, SMA, EMA, WMA).
Timeframe selection for ATR calculations (e.g., 15m, 1h, Daily).
How to Use It for Trading
Measure Volatility: Quickly gauge the expected price movement based on ATR for any timeframe.
Identify Overextension: Use the coverage % to see how much of the expected ATR range is already consumed.
Plan Entries & Exits: Align trade targets and stops with ATR levels for more objective planning.
Visual Reference: Horizontal guide lines and table update automatically as new bars form, keeping information clear and actionable.
Ideal For
Intraday traders using ATR levels to frame trades.
Swing traders wanting ATR-based reference points for larger timeframes.
Anyone seeking a volatility-based framework for planning stops, targets, or identifying overextended conditions.

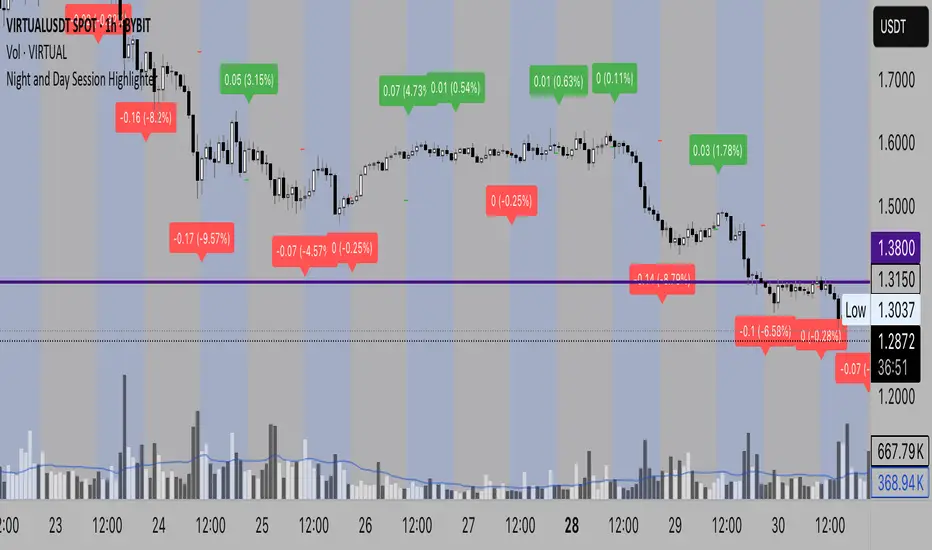
Night Session Highlight with Timezone (Valehson)Highlights this time range from 21:00 to 09:00 with a gray background with 90% transparency.
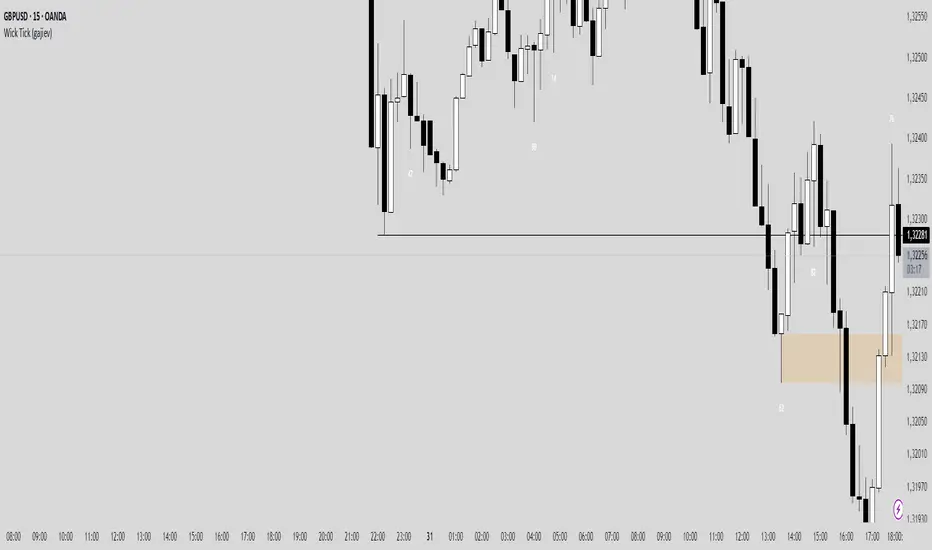
Wick TickMy indicator shows the tick size of the candle wick. In the settings, you can specify how many ticks to display information on the screen.
EMA Trend Confirmation with Alerts此脚本是基于EMA 200周期 50周期 20周期加以合并并进行改进的一个脚本指标,主要作用是用于观察趋势走向,其中有上升下降和震荡趋势,经过多数测试,此指标适用于短线交易,推荐周期为20或15,大周期和长线交易详见RSI+EMA结合指标
This script is an improved script indicator based on the EMA 200 period, 50 period, and 20 period. Its main function is to observe the trend direction, including up, down, and oscillating trends. After many tests, this indicator is suitable for short-term trading, and the recommended period is 20 or 15. For large-cycle and long-term trading, please refer to the RSI+EMA combination indicator.

ALPHA 999This indicator is designed to provide traders with clear and reliable signals by combining essential technical tools into one simplified framework. Whether you’re trading crypto, stocks, or forex, this tool helps identify potential entry and exit points using . It is well-suited for both intraday and swing traders, offering customizable inputs, multi-timeframe compatibility, and real-time alerts. The indicator displays intuitive visual cues directly on the chart, making it easy to interpret market conditions and respond quickly. Ideal for traders who prefer clean charts with actionable signals, this tool enhances decision-making without overwhelming complexity. While powerful on its own, it can be paired with other indicators for greater confirmation and accuracy. Please note: this indicator is for educational purposes only and should be used with proper risk management and backtesting before applying to live trades.
ALPHA 999This script is a custom-built indicator designed to enhance your trading strategy by providing . It is optimized for and suitable for both intraday and swing traders.
