Wx2 Treasure Box – Enter like Institutional Wx2 Treasure Box – Enter like Institutional
✅ Green Treasure Box- Institutional Entry Logic
The core entry signal is based on institutional price action—detecting strong bullish or bearish momentum using custom volume and candle structure logic, revealing when smart money steps into the market.
✅ Orange Treasure Box – Missed Move Entry
Missed the main entry (Green Treasure Box- Institutional Entry Logic)?
Don't worry—this strategy intelligently marks late entry opportunities using the Orange Treasure Box, allowing you to catch high-probability trades even after the initial impulse.
• Designed for retracement-based entries
• Still offers favorable RRR (Risk-Reward Ratio)
• Ideal for traders who miss the first trigger
Note: If you miss the main move, you can enter via the Orange Treasure Box after the market confirms continuation.
🔍 Core Logic
• Identifies Institutional Entry with Institutional Bars (IBs) based on wide-body candles with high momentum
• Detects ideal entry zones where Triggers a Green / Orange Treasure Box for high-probability entries
🎯 Entry Rules
• Buy / Long entry
Plan : Above the Treasure Box (green / orange Box) and bullish candle appears
• Sell /Short entry
Plan : Below the Treasure Box (green / orange Box) and bearish candle appears
• Enter1: (2Lot Size)
Entry with 2 lots: Above Treasure Box (Green / Orange)
• Risk-to-Reward Ratio (RRR):
Target RRR of 1:2 is recommended
Stop Entries are placed using stop orders slightly above / below the Treasure Box
🎯 Add-On Entry on First Pullback
(Optional for Beginners / Compulsory for experienced)
After the first entry, the strategy allows one intelligent add-on position on the first valid pullback, defined by a color change candle followed by a continuation of the trend.
• Detects pullbacks dynamically
• Add-on only triggers once per original entry
• Improves position sizing with trend continuation
💰 Exit Strategy
o TP1 : 1:2
Exit 50% of position (1.5Lot)
Trail SL to entry
o TP2 : 1:3
50% of Remaining Quantity (0.75Lot)
Remaining 25% is trailed
Trailing Stop Loss (SL) using:
8 SMA trailing OR
Bar-by-Bar logic
(whichever is tighter, ensuring maximum profit protection without sacrificing momentum.)
✅ Use Cases
⚙ Best For:
• Scalpers and intraday traders
• Traders who follow Smart Money Concepts (SMC)
• Anyone looking to automate structured trade management
• Works well on crypto, stocks, indices, Forex.
• Works well on any time frame
Candlestick analysis

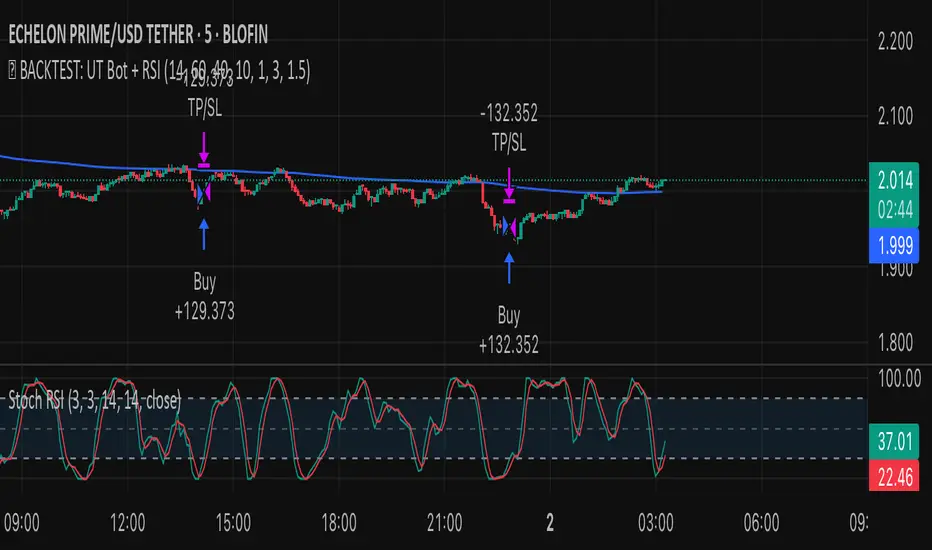
✅ BACKTEST: UT Bot + RSIRSI levels widened (60/40) — more signals.
Removed ATR volatility filter (to let trades fire).
Added inputs for TP and SL using ATR — fully dynamic.
Cleaned up conditions to ensure alignment with market structure.
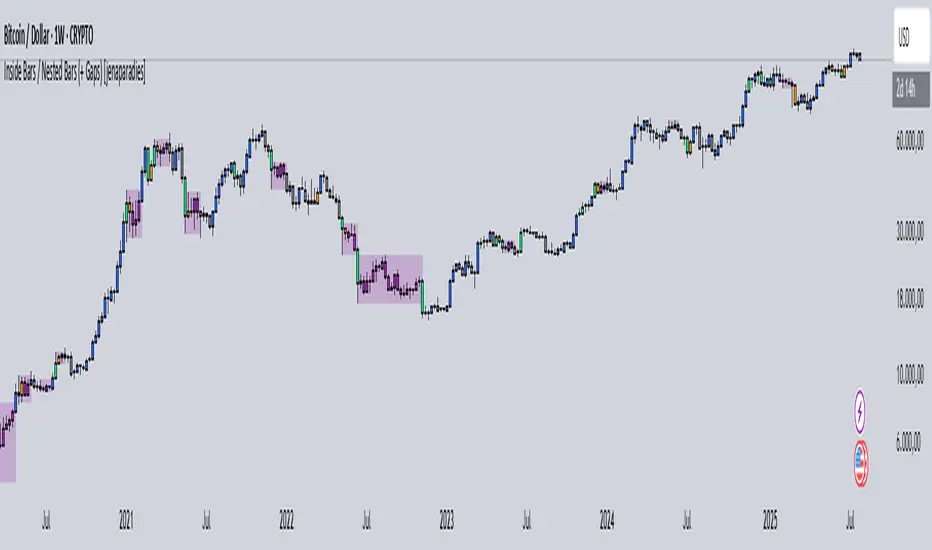
Inside Bars / Nested Bars (+ Gaps) [jenaparadies]📌 Features
Highlight inside bars
Highlight bars that remain within the range of a mother bar (called nested bars )
Highlight the mother bar (optional)
Highlight consecutive nested bars using a visual box (optional)
Enable no-gap candle logic (optional, see below)
Show no-gap candles on the chart (optional)
Fully customizable colors and appearance
📌 Method
An inside bar is any candle whose high is lower than or equal to the previous candle's high, and whose low is higher than or equal to the previous candle's low. In other words, the entire price action of the inside bar remains within the range of the previous candle without exceeding it. The preceding candle is referred to as the mother bar .
Occasionally, the candle following the inside bar may break above or below the inside bar's range, while still remaining fully within the high and low of the mother bar. These candles are referred to as nested bars and are highlighted in a different color.
Optionally, sequences of consecutive nested bars can be enclosed within a box to emphasize consolidation zones.
📌 No-Gap Candles (Optional)
This feature adjusts each candle’s opening price so that it matches the closing price of the previous candle. It is particularly useful for assets that frequently experience large gaps between candles.
By extending each candle's effective range to include the previous candle's close, the indicator maintains structural consistency over timeframes, especially when the open price deviates significantly from the prior close. Inside bars are then identified relative to the extended range of the mother bar.
Optionally, the adjusted no-gap candles can be visualized directly on the chart for better clarity.
🎁 Bonus
Activating the "Show No-Gap Candles" option transforms any line chart into a gap-free bar chart ‒ ideal for visualizing economic data such as inflation rates.
Wx2 Treasure Box – Institutional Entry🧩 Indicator Overview: Wx2 Treasure Box – Institutional Entry
Designed to detect Institutional Bars (IBs) and visualize high-probability entry zones, this script helps traders align with potential smart-money activity.
Institutional Bars are defined as Entry of Smart Money
⚙️ How It Works
20-period and 200-period Simple Moving Averages are plotted to show short‑ and long‑term trend direction.
On identification of an IB:
A label “IB” is placed above the bar.
A rectangular box is drawn around its high–low range, extending several bars to the right to mark the trade zone
Trade Signals & Setup Guidelines
Buy Entry:
Trigger: Price breaks above the box.
Stop Loss (SL): Set just below the box bottom.
Sell Entry:
Trigger: Price piercing below the box.
SL: Placed above the box top.
Risk-to-Reward Ratio (RRR):
Target RRR of 1:2 is recommended
Best Execution Zone:
Treasure Box is the best with 20SMA+200 SMA+Price in it.
📽️ Video Link
You’ve linked a YouTube video for explanation:
Watch Here

Custom Candle Colors by Day (Full Week)Highlight specific daily candles a different color (Monday - Sunday)

Invencible MACD Strategy Scalping)Invencible MACD Strategy
The Invencible MACD Strategy is a refined scalping system designed to deliver consistent profitability by optimizing the classic MACD indicator with trend and volatility filters. This strategy is built for short-term traders looking for precision entries and favorable risk-to-reward conditions on any asset and lower timeframes such as 1m, 5m, or 15m.
Core Logic
This strategy uses a multi-timeframe (MTF) approach to calculate the MACD, Signal Line, and Histogram. Trades are executed when all of the following conditions are met:
Long Entry:
The MACD crosses above the Signal Line.
The Histogram is rising with a defined impulse threshold.
Price is above the 200 EMA, confirming an uptrend.
Volatility, measured by ATR, is above a configurable minimum.
Short Entry:
The MACD crosses below the Signal Line.
The Histogram is falling with a defined impulse threshold.
Price is below the 200 EMA, confirming a downtrend.
ATR confirms sufficient volatility.
Risk Management
Take Profit is set higher than Stop Loss to ensure that the average winning trade is greater than the average losing trade.
Trailing stop is optional and can be disabled to allow full profit capture on strong moves.
Trade size is fixed to 1 contract, suitable for scalping with low exposure.
Customizable Parameters
MACD Fast, Slow, and Signal EMAs
Histogram impulse threshold
Minimum ATR filter
Take Profit and Stop Loss percentage
Trailing Stop activation and size
Timeframe resolution (can be customized or synced with chart)
Visual Aids
MACD and Signal Line are plotted below price.
Histogram bars help visualize momentum strength.
200 EMA is plotted on the main chart to show trend direction.
This strategy was designed to prioritize quality over quantity, avoiding weak signals and improving both the win rate and profit factor. It is especially effective on assets like gold (XAUUSD), indices, cryptocurrencies, and high-liquidity stocks.
Feel free to test and optimize parameters based on your trading instrument and timeframe.
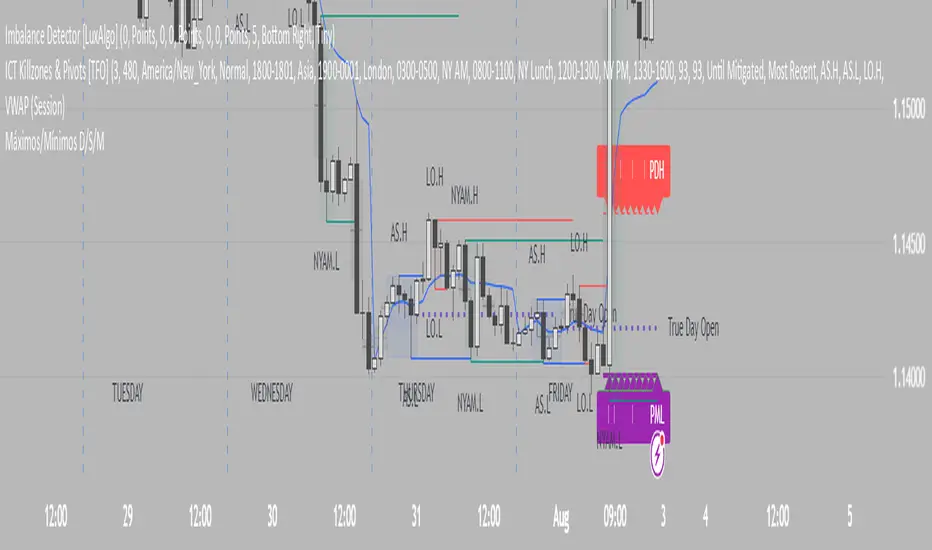
Los 7 Capitales

Lucas Scalia Maximums and minimums of the day, week, and month. Basically, it automatically marks and labels the highs and lows of the previous daily , weekly, and monthly candles. The labels can be added or removed at your discretion, leaving only the dotted lines.

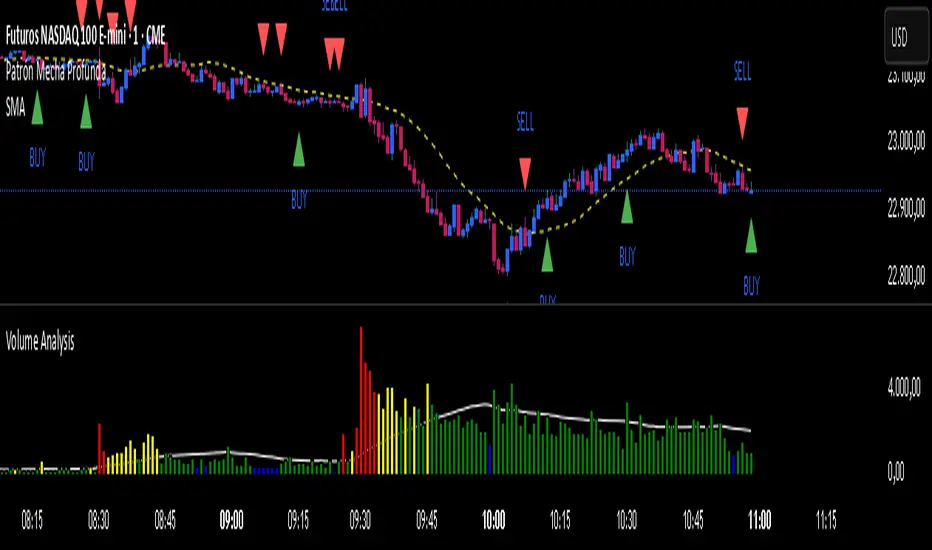
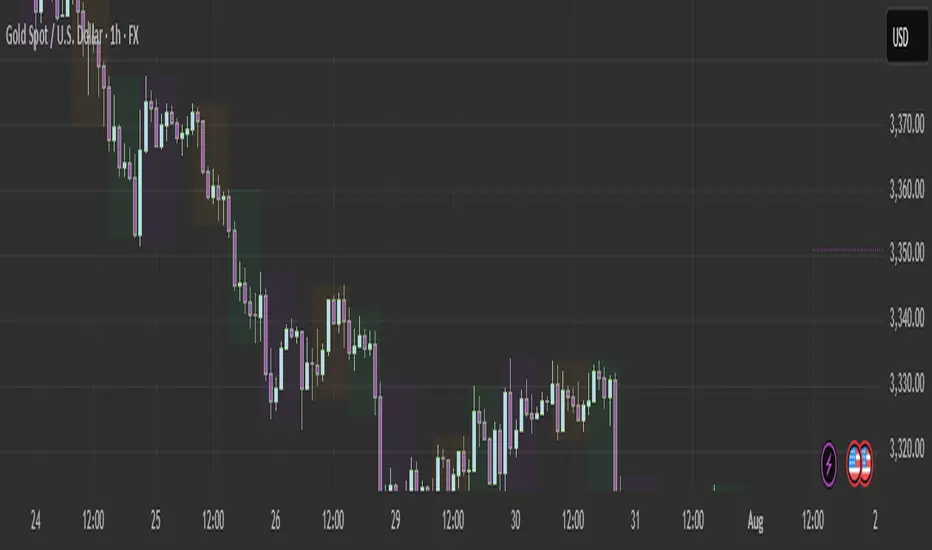
Patrón Mecha Profunda
This pattern must be combined with a 20-period moving average. It is used to know the direction of the price. When the pattern appears and the price is above the 20-period moving average, it is a bullish signal and vice versa.
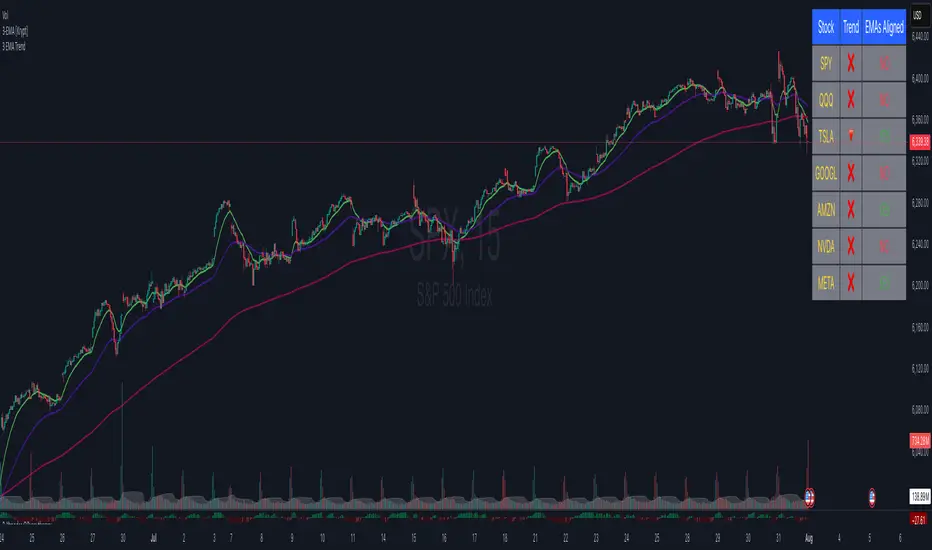
3 EMA cross overThis Pine Script displays the 3 EMA trend status for a list of popular stocks in a dynamic table. It calculates and monitors 13 EMA, 48 EMA, and 200 EMA for each ticker to detect bullish or bearish alignment.
Best Use:
Use this script to quickly scan market trends across multiple stocks and identify potential trade opportunities based on EMA alignment.
MTF Clean Panelsit is bigger model of a earlier model then i have made earlier it helps you see multiple timeframes together and includes more daily timeframe and have also been introduced a new 4 hours candle structure

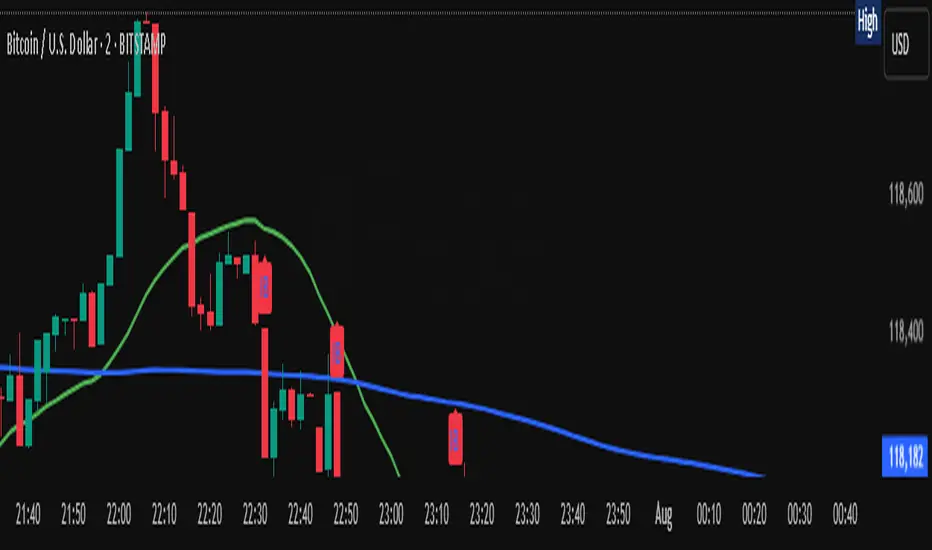
Momentum Commitment Delta (MCD)What it is
M C D fuses five micro-structure clues into one 0-to-1 score that says, “how hard are traders actually leaning on this move?”
1. Body-Delta Momentum – average net candle body direction.
2. Volume Commitment – up-volume ÷ down-volume over the same window.
3. Wick Compression – shrinking upper/lower wicks = clean conviction.
4. Candle Sequencing – rewards orderly, staircase-style body growth.
5. Pin Ratio – where the close pins inside each candle’s range.
The five factors are multiplied, then auto-normalized so extremes always land near 0 / 1 on any symbol or timeframe.
I recommend tweaking the settings to fit your edge, the pre-loaded settings may not be suitable for most traders. The MCD works on all timeframes as well :)
⸻
How to read basic signals
• Fresh cross above 0.70 → often the birth of a real breakout.
• Cluster of > 0.70 bars → “commitment lock,” pull-backs usually shallow.
• Price makes new high while M C D doesn’t → beware...
• Cross back below 0.30 after a run → momentum is out of fuel.
⸻
Because M C D is multiplicative, it’s hard to hit the extremes—so when the bars light lime green, the print is usually telling the truth.
I personally use the MCD to identify the peak of a high-conviction range, NOT a breakout. If a bar prints over 0.70 (green) and then a range forms off of the bar which exceeded 0.70, the breakout has a high chance to be explosive, regardless of what MCD reads at the breakout inflection point.
Play around with it, im sure there are plenty of other patterns.
Disclaimer: The Momentum Commitment Delta (MCD) indicator is provided strictly for educational and informational purposes. It does not constitute financial or investment advice, nor is it a recommendation to buy or sell any security. Trading involves substantial risk, and you should always perform your own due diligence and consult a qualified financial professional before making any trading decisions. Past performance is not indicative of future results.
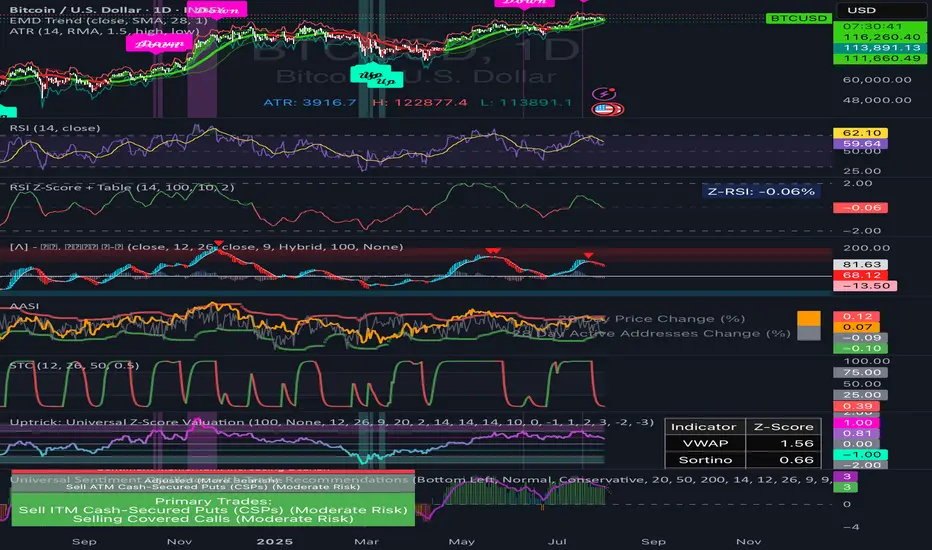
RSI Z‑Score + TableRSI Z-Score + Table
This script calculates the Z-Score of the RSI (Relative Strength Index), which standardizes RSI based on its own recent history.
What It Shows:
RSI Z-Score = (Current RSI - Mean RSI) / Standard Deviation
This tells you how extreme the current RSI is compared to its historical values.
A table displays:
Current RSI
Rolling Mean
RSI Z-Score
How to Use:
Z-Score > +2 = Statistically overbought
Z-Score < -2 = Statistically oversold
Use it to time reversals or overextension in RSI behavior.
🔒 Based on rolling lookback window — fully customizable.
Author:
Tags: #RSI #ZScore #Momentum #StatisticalEdge #MeanReversion #Crypto
Manual 1H Trend BackgroundThis TradingView Pine Script v6 indicator allows you to manually set the trend direction (based on your analysis of the 1-hour timeframe), and it will change the background color of your chart based on that input:
"Buy" → chart background turns green
"Sell" → chart background turns red
"Neutral" → no background color (transparent)

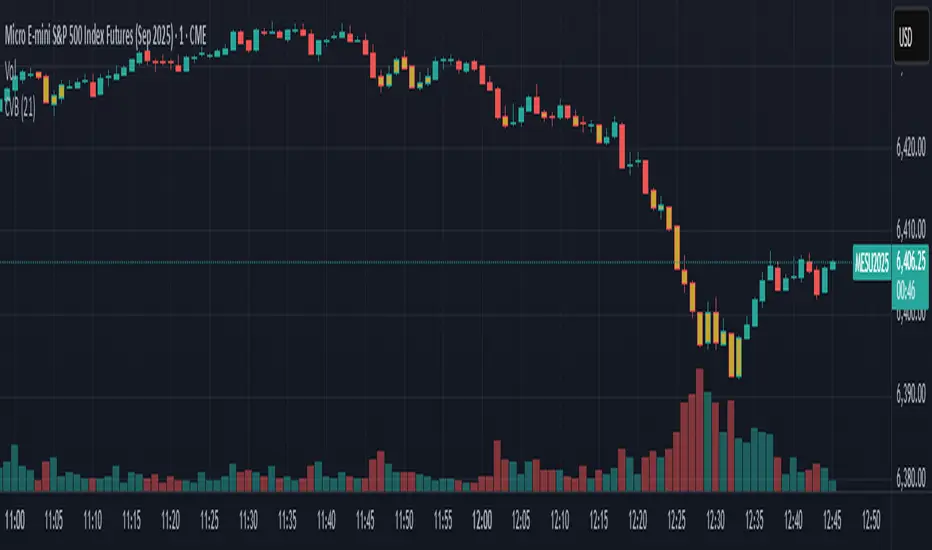
Coefficient of Variance BarsThe script calculates the Coefficient of Variance (CV), which is the standard deviation (a measure of volatility) divided by the average price over a set period. In simple terms, it tells you how volatile the market is in relation to its current price level.
• Highlighting Volatility Increase: By default, the script colors the bars when this relative volatility makes a new high. This suggests that the market is "waking up" and that a significant price move could be starting.
• Highlighting Low Volatility (Inverse Mode): When you uncheck the box in the settings, it highlights periods where volatility is not making a new high. This is useful for spotting quiet, consolidating markets.
________________________________________
How to Use It in Trading
This indicator is a complementary tool and should be used with other forms of analysis, like price action or trend indicators.
1. Spotting Potential Breakouts
The most common use is to anticipate breakouts. When the price is moving in a tight range (consolidation) and you suddenly see a highlighted bar, it signals a surge in volatility. This is often the catalyst that pushes the price out of the range.
• Strategy: Look for a period of price consolidation. When a bar is colored, indicating a volatility spike, look for a confirmation of a breakout (e.g., a candle closing above resistance or below support) and consider entering a trade in that direction.
2. Identifying Ranging Markets
By switching to the inverse mode, you can easily see when the market is quiet and range-bound.
• Strategy: When the bars are consistently highlighted in inverse mode, it confirms a ranging market. This is the ideal environment for strategies that capitalize on sideways movement, such as using oscillators (like RSI or Stochastics) to trade between support and resistance levels.
3. Gauging Trend Strength and Exhaustion
In a strong, ongoing trend, you'll likely see intermittent volatility spikes confirming the momentum. However, a sudden, massive spike in volatility after a very long trend might signal a "climax," potentially indicating the trend is exhausted and a reversal could be near.
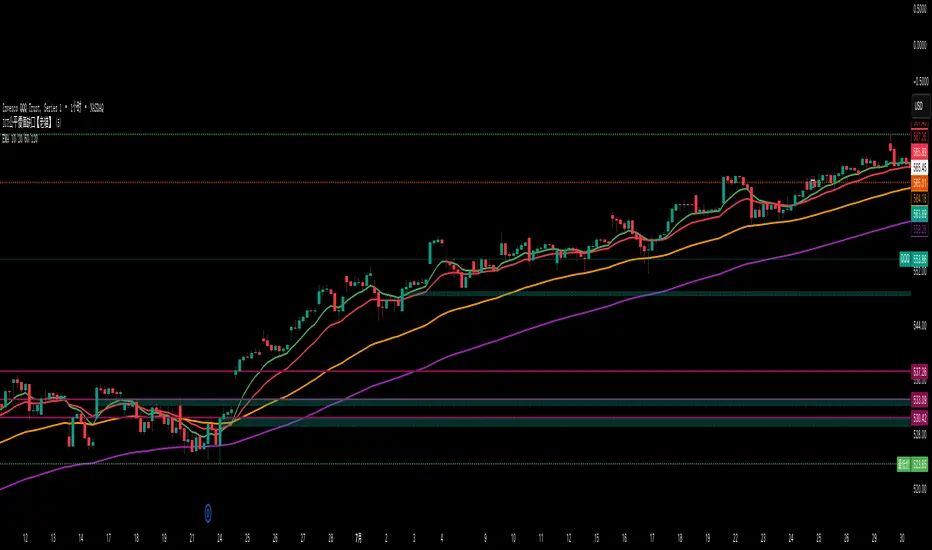
EMA 10/20/60/120// This script plots four Exponential Moving Averages (10, 20, 60, 120)
// for trend-following analysis. Crossovers and the order of the EMAs can
// help identify the strength and direction of the trend.
ASK Indicator by AshpreetThe ASK Indicator is a custom-built breakout and trend continuation system designed for swing traders seeking high-probability entries with strong risk-reward ratios. Built using a combination of moving averages, momentum filters, volume confirmation, and price structure, this indicator helps identify stocks poised for explosive moves.
It uses three key moving averages: the 44-period SMA (medium trend), 20-period DEMA (short-term strength, custom-coded), and 50-period WEMA (institutional trendline). Trades are only triggered when the price is above 50 WEMA, and the 20 DEMA is above the 44 SMA.
Momentum is confirmed using RSI(14) within a healthy zone of 40–60, ensuring the stock is not overbought or oversold. To focus on breakout candidates, the stock must be trading within 10% of its 52-week high, and the weekly candle range must be under 10%, signaling compression before expansion.
A valid ASK Signal occurs when these conditions are met along with a breakout above the previous day’s high and volume exceeding 1.5× the 20-day average. Once triggered, the indicator auto-plots the stop-loss (1× ATR) and two profit targets: 1:2 (TP1) and 1:4 (TP2).
Additionally, the system detects a narrow range setup, where the last 3 daily candles are inside the previous 3-day range — a powerful consolidation signal. Alerts for both ASK entries and narrow ranges are included.
This system is ideal for positional and short-term swing traders who want to combine structure, momentum, and volume in one powerful tool.

ombs- PONY Breakout Alert
🧠 תקציר הסקריפט: **PONY Breakout Alert 📈
🔍 **מטרה**:
לזהות **פריצה מעלה של רמת 14.15** תוך כדי **מחזור מסחר גבוה מהממוצע**, כדי לאתר **הזדמנות מסחר שורית**.
---
⚙️ רכיבי הסקריפט:
* 📌 **רמת כניסה**:
`entryLevel = 14.15`
* 📊 **תנאי כניסה**:
* סגירת מחיר **מעל 14.15**
* נפח מסחר **גבוה ב־20% מהממוצע ל־20 הימים האחרונים**
* 🔔 **התראה ויזואלית**:
* סמל ירוק "Entry" מופיע מתחת לנר על הגרף
* קווים קבועים לרמות יעד וסטופלוס
* 🎯 **יעדי רווח**:
* Target 1 – 15.15
* Target 2 – 16.00
* Target 3 – 17.00
* 🛑 **סטופלוס**:
* שמרני: 13.20
* אגרסיבי: 12.80
* 🔔 **התראה אוטומטית** (`alertcondition`):
תשלח הודעה:
*"PONY פרצה מעל 14.15 עם מחזור גבוה – שקול כניסה לעסקה."*
---
📝 מתאים עבור:
* סוחרי ניתוח טכני 🧮
* מי שמחפש כניסה מבוססת על פריצה + נפח 📊
* שימוש על גרף יומי בלבד 📅
---
🧠 Script Summary: PONY Breakout Alert 📈
🔍 Objective:
Detect a breakout above the 14.15 level accompanied by high trading volume, in order to identify a bullish trading opportunity.
⚙️ Script Components:
📌 Entry Level:
entryLevel = 14.15
📊 Entry Conditions:
Price closes above 14.15
Volume is 20% higher than the 20-day average
🔔 Visual Alert:
A green "Entry" label appears below the bar on the chart
Static horizontal lines mark targets and stop-loss levels
🎯 Profit Targets:
Target 1 – 15.15
Target 2 – 16.00
Target 3 – 17.00
🛑 Stop Loss:
Conservative: 13.20
Aggressive: 12.80
🔔 Automated Alert (alertcondition):
Sends a message:
"PONY has broken above 14.15 with high volume – consider a long position."
📝 Ideal For:
Technical traders 🧮
Those seeking breakouts confirmed by volume 📊
Daily chart setups only 📅

ICT OTE Market MakerICT OTE Market Maker
Implementing ICT and automatically identifies OTE zones to minimize drawdowns.
Wx2 Treasure Box Buy- Above the Box and Protect Below the Box
Sell- Below the Box Protect Above the Box
Go for Trigger Order
RRR: 1:2
Best Location is near 200SMA
Time Frame 2Min, 3Min, 5Min, & 15Min
Watch My Video
youtu.be
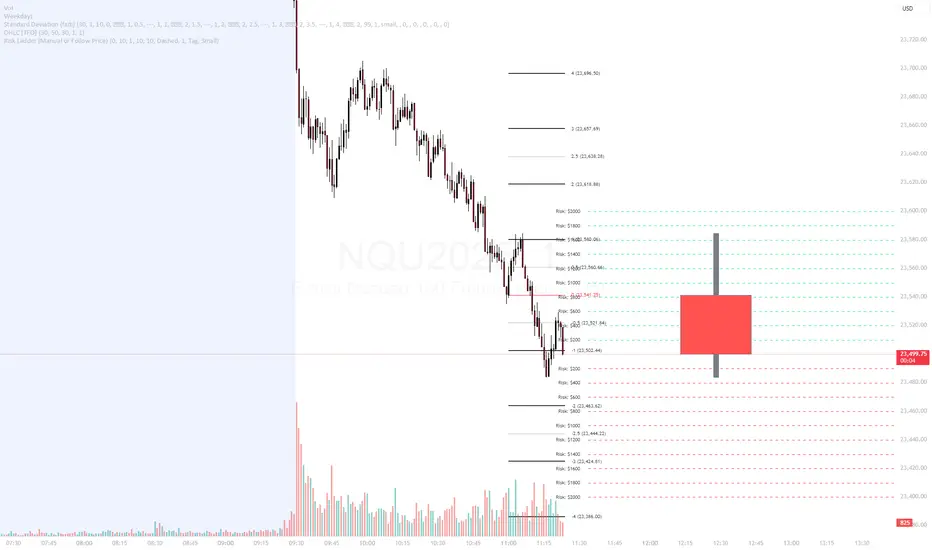
Risk Ladder📝 Description:
The Risk Ladder plots visual risk levels above and below a selected price, helping traders instantly assess risk exposure per contract across key price intervals.
This tool offers two modes:
✅ Live Mode – Automatically anchors to the current market price
✅ Manual Mode – Anchor the ladder to your custom trade entry price (e.g., after placing a position)
Each level displays the cumulative risk in dollars, calculated based on:
Contract size
Tick value for the symbol (auto-detected for ES, NQ, CL, etc.)
Distance from entry price
🎨 Fully Customizable:
Interval between levels (e.g. every 10 points)
Number of levels above/below
Line color, width, and style
Label size, shape (tag or box), color, and offset
Toggle between live or manual entry modes
💡 Use Cases:
Visualize risk tiers before or after entering a position
Define profit-taking and stop-loss zones based on risk multiples
Clean overlay to complement your price action, VWAP, or R:R strategy
🔁 How to Use:
Select whether to use manual entry or follow live price
Adjust your risk interval and contract size
Watch the ladder instantly reflect total risk every level
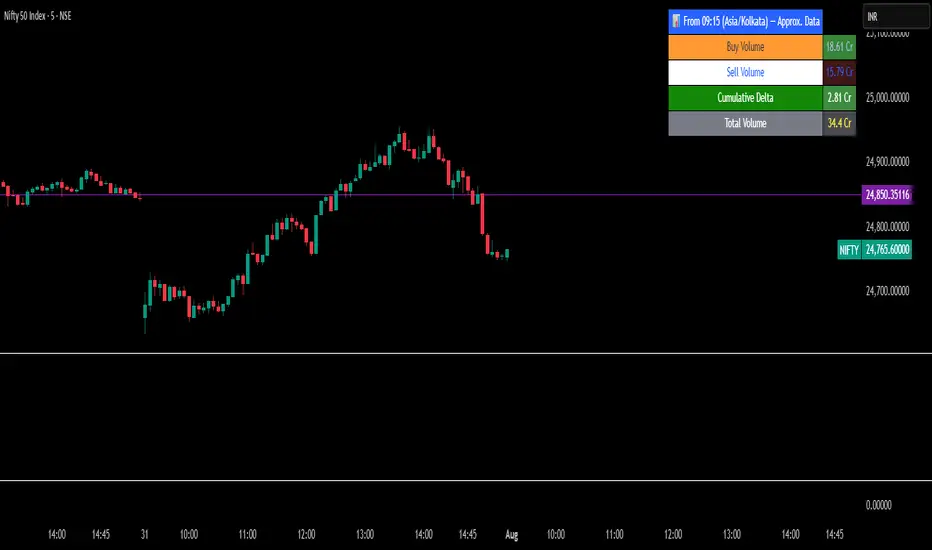
Intraday Volume Pulse GSK-VIZAG-AP-INDIA📊 Intraday Volume Pulse — by GSK-VIZAG-AP-INDIA
Overview:
This indicator displays a simple and effective intraday volume summary in table format, starting from a user-defined session time. It provides an approximate breakdown of buy volume, sell volume, cumulative delta, and total volume — all updated in real-time.
🧠 Key Features
✅ Session Start Control
Choose the session start hour and minute (default is 09:15 for NSE).
🌐 Timezone Selector
View volume data in your preferred timezone: IST, GMT, EST, CST, etc.
📈 Buy/Sell Volume Estimation Logic
Buy Volume: When candle closes above open
Sell Volume: When candle closes below open
Equal: Volume split equally if Open == Close
🔄 Daily Auto-Reset
All volume metrics reset at the start of a new trading day.
🎨 Color-Coded Volume Insights
Buy Volume: Green shade if positive
Sell Volume: Red shade if positive
Cumulative Delta: Dynamic red/green based on net pressure
Total Volume: Neutral gray with emphasis text
🧾 Readable Number Formatting
Volumes are displayed in "K", "L", and "Cr" units for easier readability.
📌 Table Positioning
Choose from top/bottom corners to best fit your layout.
⚠️ Note
All data shown is approximate and based on candle structure — it does not reflect actual order book or tick-level data. This is a visual estimation tool to guide real-time intraday decisions.
✍️ Signature
GSK-VIZAG-AP-INDIA
Creator of practical TradingView tools focused on volume dynamics and trader psychology.