Intraday Bullish Scanner - Profit Ping📊 Intraday Bullish Scanner – Profit Ping Only
This custom-built TradingView script identifies high-probability intraday BUY signals on the 15-minute chart, confirmed by volume, momentum, and price action. It uses:
✅ EMA 7/14 crossovers
✅ Bullish candlestick patterns (Engulfing, Piercing, etc.)
✅ Volume spikes above 20-MA
✅ RSI between 55–65
✅ MACD histogram flip from red to green
✅ Cross-confirmation with the 30-minute trend
Once in a trade, it activates a dynamic trailing stop (starting at 2%, tightening to 1% as profit and volume increase). SELL signals are confirmed only with:
❌ MACD turning red
❌ Bearish RSI movement or drop below 50
❌ EMA 7 crossing below EMA 14
❌ A bearish candlestick (Engulfing or Piercing)
❌ Volume spike on a red candle
💰 When all SELL conditions align, a yellow triangle appears. BUYs are marked with a white triangle. Alerts can be connected directly to Python/webhook systems for full automation with IBKR.
Candlestick analysis

Railway Track Pattern - Nifty 50//@version=5
indicator("Railway Track Pattern - Nifty 50", overlay=true)
// Settings
bodyThreshold = input.float(0.8, title="Minimum Body Overlap (%)", minval=0.5, maxval=1.0)
// Candle Body Sizes
bodySize1 = math.abs(close - open )
bodySize2 = math.abs(close - open)
// Candle Directions
isBullishRail = close < open and close > open // Red followed by Green
isBearishRail = close > open and close < open // Green followed by Red
// Overlap Check (at least 80% body overlap)
overlapLow = math.max(open , close )
overlapHigh = math.min(open , close )
overlapLow2 = math.max(open, close)
overlapHigh2 = math.min(open, close)
bodyOverlap = math.min(overlapHigh, overlapHigh2) - math.max(overlapLow, overlapLow2)
minBodySize = math.min(bodySize1, bodySize2)
overlapRatio = bodyOverlap / minBodySize
railwayBullish = isBullishRail and overlapRatio >= bodyThreshold
railwayBearish = isBearishRail and overlapRatio >= bodyThreshold
// Plotting
plotshape(railwayBullish, title="Bullish Railway", style=shape.labelup, location=location.belowbar, color=color.green, text="🚆 Buy")
plotshape(railwayBearish, title="Bearish Railway", style=shape.labeldown, location=location.abovebar, color=color.red, text="🚆 Sell")

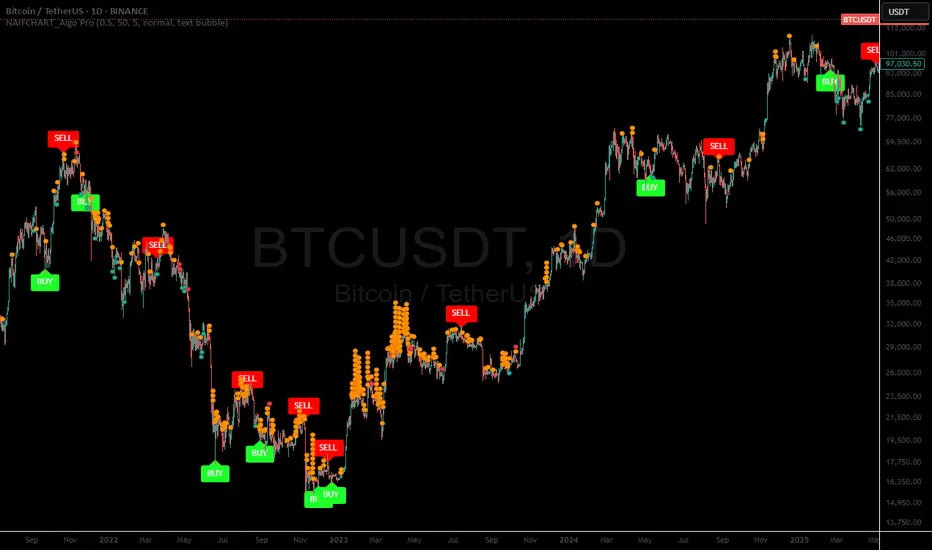
NAIFCHART_Algo Pro# NAIFCHART Algo Pro: Advanced Candlestick Pattern Analysis Tool
## Overview
The NAIFCHART Algo Pro indicator represents an innovative approach to candlestick pattern analysis, combining traditional engulfing patterns with advanced technical filters. This indicator was developed and shared by the trading community at t.me focusing on high-probability reversal signals through multi-layered confirmation.
## Core Algorithm Components
**Candle Stability Index**: Measures the ratio between candle body and total range (including wicks). Higher values indicate more decisive price action with stronger conviction. Default setting of 0.5 ensures only stable, well-formed candles generate signals, filtering out indecisive market conditions.
**RSI Momentum Filter**: Utilizes 14-period RSI with customizable threshold (default 50) to confirm overbought/oversold conditions. Buy signals require RSI below the threshold, while sell signals need RSI above the inverse threshold, ensuring momentum alignment with pattern direction.
**Candle Delta Analysis**: Examines price movement over a specified period (default 5 candles) to confirm directional bias. This filter ensures patterns occur after meaningful price moves in the opposite direction, increasing reversal probability.
**Engulfing Pattern Recognition**: Identifies classic bullish and bearish engulfing formations where the current candle completely engulfs the previous candle's body, indicating potential momentum shift.
## Signal Generation Logic
**Buy Signal Criteria**:
- Bullish engulfing pattern formation
- Candle stability above threshold level
- RSI below specified threshold (oversold condition)
- Price decrease over the delta length period
- Confirmed bar state (prevents repainting)
**Sell Signal Criteria**:
- Bearish engulfing pattern formation
- Candle stability above threshold level
- RSI above inverse threshold (overbought condition)
- Price increase over the delta length period
- Confirmed bar state (prevents repainting)
## Advanced Features
**Signal Filtering**: Optional "Disable Repeating Signals" feature prevents signal clusters by blocking consecutive identical signals. This enhances chart clarity and reduces noise in trending markets where multiple patterns might form in sequence.
**Visual Customization**: Multiple label styles including text bubbles, triangles, and arrows with full color customization. Label sizes range from tiny to huge, allowing adaptation to different chart configurations and personal preferences.
**Alert Integration**: Built-in alert system notifies traders immediately when buy or sell conditions are met, enabling real-time trade execution without constant chart monitoring.
## Implementation Strategy
**Timeframe Optimization**: The indicator performs effectively across multiple timeframes, with higher timeframes (1-hour and above) providing more reliable signals due to reduced market noise. Shorter timeframes require more conservative position sizing due to increased false signal probability.
**Parameter Tuning**:
- Increase Candle Stability Index for more selective signals in volatile markets
- Adjust RSI threshold based on market conditions (lower for trending markets, higher for ranging conditions)
- Modify Candle Delta Length for different trend confirmation periods
**Risk Management**: Combine signals with proper stop loss placement below/above the engulfing pattern's extreme points. Consider position sizing based on pattern strength and overall market context.
## Market Application
**Reversal Trading**: Primary application focuses on identifying high-probability reversal points after extended moves. The multi-filter approach significantly reduces false signals compared to basic engulfing pattern strategies.
**Trend Confirmation**: In trending markets, signals align with pullback completion, providing optimal entry points for trend continuation strategies. The RSI and delta filters help identify temporary retracements rather than trend changes.
**Range Trading**: Within sideways markets, signals often occur near range boundaries, providing effective support and resistance bounce opportunities with clearly defined risk parameters.
## Performance Optimization
**Market Selection**: The indicator performs best on liquid instruments with clear candlestick formations. Avoid extremely volatile or thin markets where patterns may be less reliable.
**Session Timing**: Consider trading sessions when focusing on specific markets. Major session overlaps often provide clearer patterns due to increased participation and volume.
**Confirmation Techniques**: While the indicator provides internal filtering, additional confirmation through volume analysis, key support/resistance levels, or broader market context enhances signal reliability.
## Community Resources
Access ongoing strategy discussions and optimization techniques through the source community at t.me where traders share practical applications and parameter adjustments for different market conditions.
The collaborative environment provides valuable insights into optimal settings for various trading styles and market environments, along with real-time feedback on signal quality and performance.
## Conclusion
NAIFCHART Algo Pro offers a sophisticated approach to candlestick pattern trading through intelligent filtering and confirmation mechanisms. The indicator's strength lies in combining traditional pattern recognition with modern technical analysis filters, creating a robust framework for identifying high-probability reversal opportunities.
Success with this tool requires understanding each component's role in signal generation and adapting parameters to match current market conditions and personal trading style. The community-driven development ensures practical relevance and ongoing refinement based on real trading experiences.
Practice with demo accounts to develop familiarity with signal timing and optimal parameter settings before live implementation. The indicator's systematic approach provides clear entry signals while maintaining flexibility for different risk management and position sizing strategies.

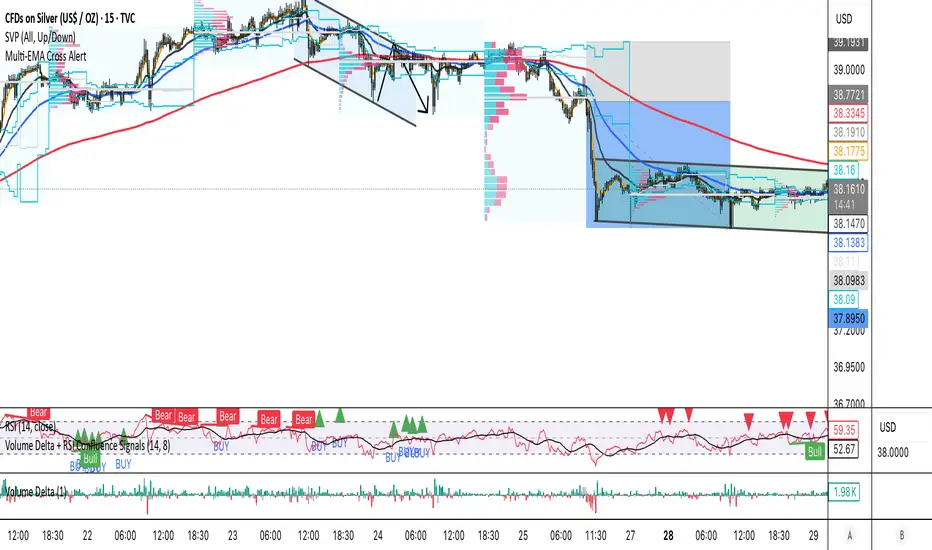
Volume Delta + RSI Confluence SignalsEfficient buy and sell signal scans for real trades using volume delta, rsi rejection and some more.
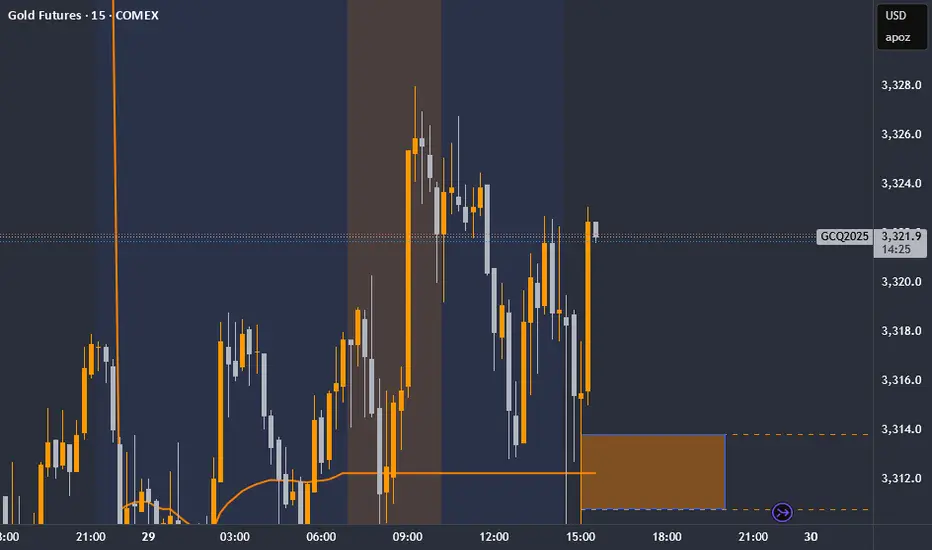
MJBFX-Strategy (Futures Optimized)The MJBFX-Strategy is a complete market mapping tool designed to give traders a clear view of liquidity, session dynamics, and premium/discount levels. It loads automatically on any chart, fully optimized for futures and forex trading.
🔑 Key Features
Asian Session Range
Highlights the previous Asian session with a shaded box
Fixed until London open for precise reference
VWAP from Asian Session
Plots the VWAP of the previous Asian session
Dynamic fair value benchmark for intraday trading
Liquidity Sweeps (Optimized)
Detects sweeps of the Asian session high/low
Shown only on 30m, 1h, and 4h charts to reduce noise
Clean, minimal labels for clarity
Automatic Fibonacci Zone
Draws a shaded retracement zone (38.2%–61.8%) of the Asian range
Transparent fill makes it easy to read price action
Killzones
Highlights London (07:00–10:00) and New York (13:00–16:00) killzones
Semi-opaque shading to keep charts clean
Auto Trade Box (Risk/Reward)
On sweep confirmation, plots a 2R target box
Auto stop loss and take profit levels based on futures tick size
🎯 Why Use It?
The MJBFX-Strategy removes the need for manual drawing.It automatically maps:
Session highs and lows
Liquidity sweeps
VWAP and fib retracement zones
Key killzones
Perfect for session-based intraday trading in both futures and forex.
⚡ No manual settings required.Just load it onto your chart for an instant institutional view of the market.
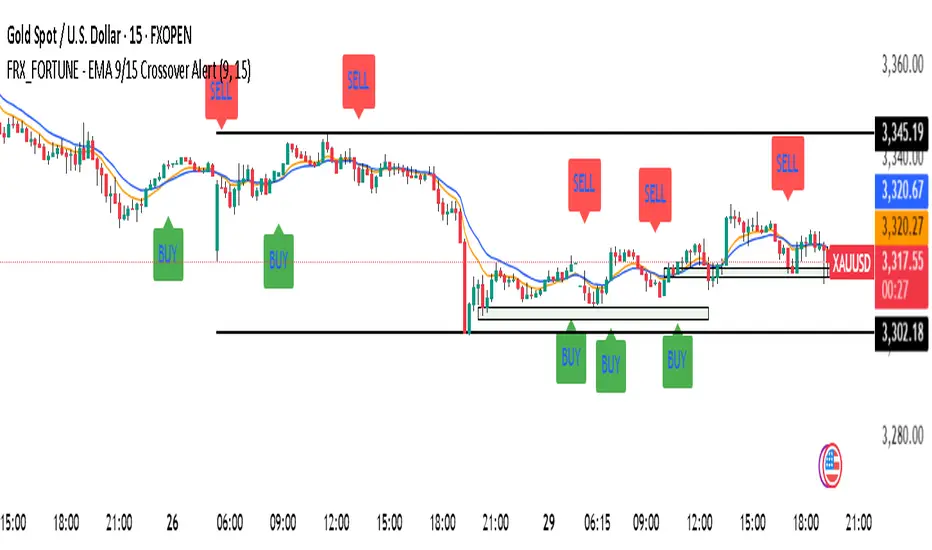
FRX_FORTUNE - EMA 9/15 Crossover Alert//@version=5
indicator("FRX_FORTUNE - EMA 9/15 Crossover Alert", overlay=true)
// === INPUTS ===
fastEmaLength = input.int(9, title="Fast EMA (9)")
slowEmaLength = input.int(15, title="Slow EMA (15)")
showArrows = input.bool(true, title="Show Buy/Sell Arrows")
enableAlerts = input.bool(true, title="Enable Alerts")
// === CALCULATIONS ===
fastEma = ta.ema(close, fastEmaLength)
slowEma = ta.ema(close, slowEmaLength)
bullishCross = ta.crossover(fastEma, slowEma)
bearishCross = ta.crossunder(fastEma, slowEma)
// === PLOT EMA ===
plot(fastEma, title="EMA 9", color=color.orange)
plot(slowEma, title="EMA 15", color=color.blue)
// === DRAW ARROWS ===
plotshape(bullishCross and showArrows, location=location.belowbar, color=color.green, style=shape.labelup, text="BUY", size=size.small)
plotshape(bearishCross and showArrows, location=location.abovebar, color=color.red, style=shape.labeldown, text="SELL", size=size.small)
// === ALERTS ===
alertcondition(bullishCross, title="Buy Alert", message="BUY: EMA 9 crossed above EMA 15")
alertcondition(bearishCross, title="Sell Alert", message="SELL: EMA 9 crossed below EMA 15")
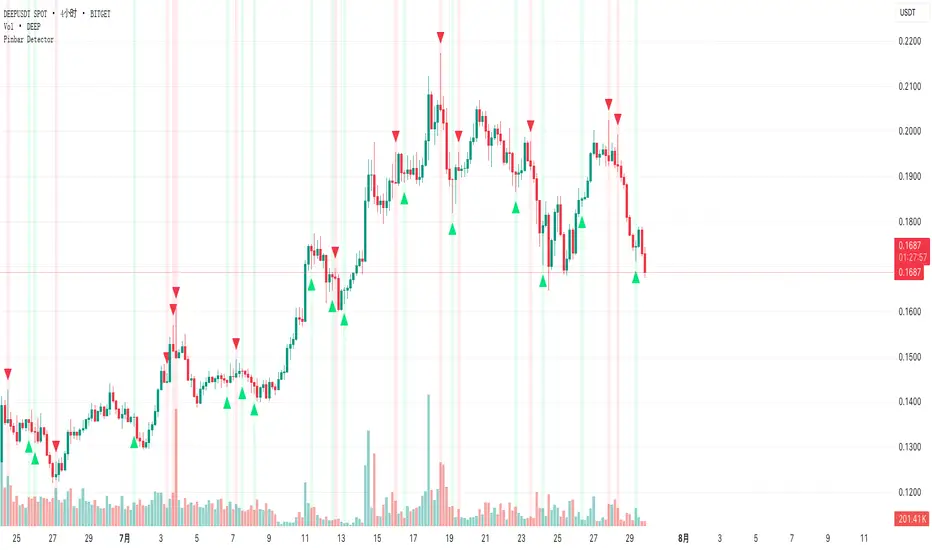
Pinbar DetectorPinbar Detector is original from Naked Candlestick Trading Method
Pinbar Definition: A candlestick where the dominant shadow exceeds 2/3 of the entire candle length
Key Features:
Bearish Pinbar: Red downward triangle when upper shadow exceeds 2/3 of total candle length
Bullish Pinbar: Green upward triangle when lower shadow exceeds 2/3 of total candle length
Background highlighting for easy identification
Alert conditions for both bullish and bearish pinbars
Original candlestick display preserved
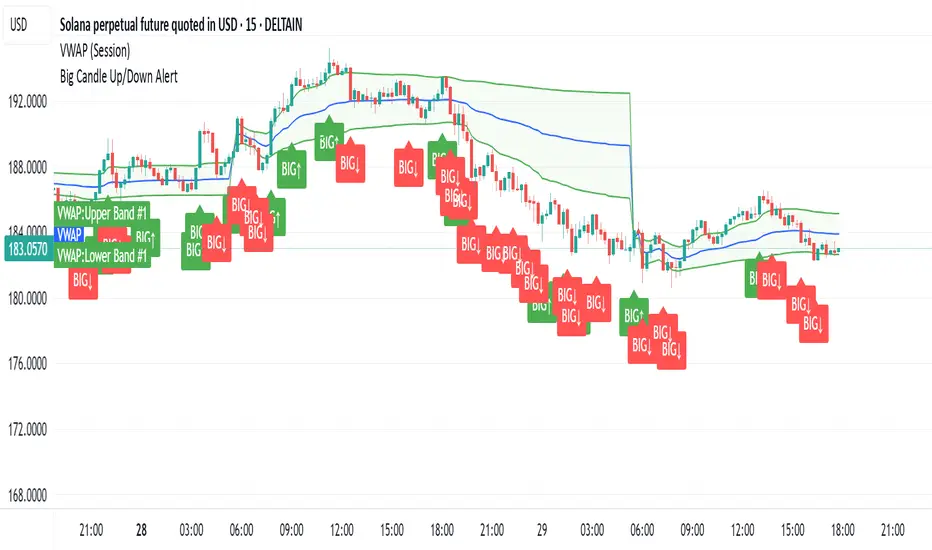
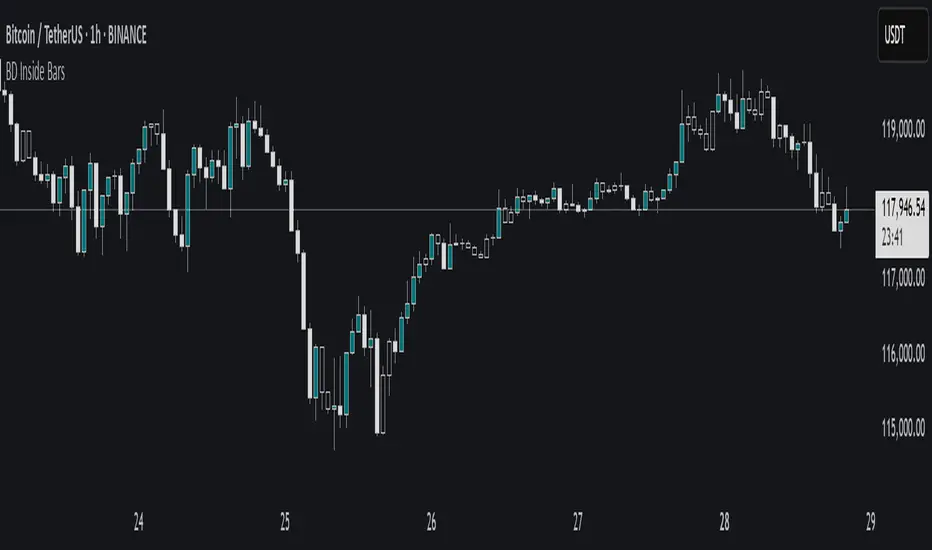
Big CandleBig Candles, most of the times, indicate actions by market makers . Also the candle high and low can be thought of as liquidity zones.
Weekly % Change Screener (5% Sell Threshold)This is a weekly screener for a 5% change in the stock value. If it increases by 5%, we sell and if it decreases by 5% we buy the stock. Good for stable high value stocks. Buy before testing.

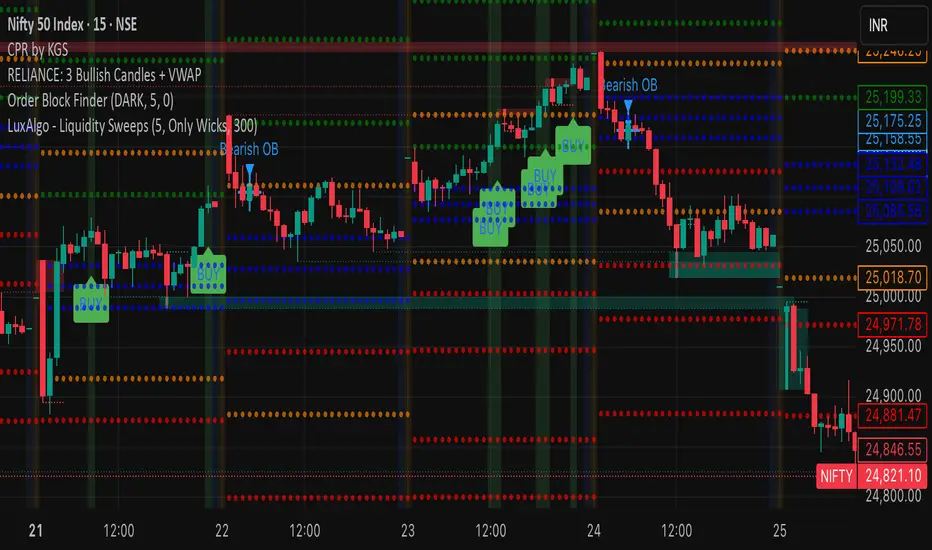
RELIANCE: 3 Bullish Candles + VWAPIts a script to track 3 consecutive candles of any stock. This helps understand the trends and makes up for buy signals. Please test before buying.
MJBFX VWAP WITH SIGNALSThe MJBFX VWAP Channel is a custom-built volume-weighted average price indicator designed around the MJBFX trading methodology.
This tool tracks multiple rolling VWAPs anchored to a user-defined timeframe (default: 1H), then calculates percentile levels (Max, Upper, Median, Lower, Min) to create a dynamic channel. These levels act as key support and resistance zones that adapt to market conditions.
🔶 Features:
Adjustable anchor period and VWAP count (up to 500 VWAPs)
Percentile-based VWAP levels (Max, Upper, Median, Lower, Min)
Customisable colours, widths, and line styles
Optional gradient channel fills
Anchor period highlights for session awareness
MJBFX Branded Signals:
🟠 Buy – Triggered when price crosses above the lower VWAP (MJBFX Orange)
⚪ Sell – Triggered when price crosses below the upper VWAP (MJBFX Grey)
Built-in alert conditions for automated trade notifications
🔶 How to Use:
The VWAP channel provides a dynamic structure for intraday trading.
Buy opportunities often occur when price sweeps below the lower band and reclaims it.
Sell opportunities often occur when price sweeps above the upper band and rejects.
Use in confluence with market structure, session timing, and your trading plan (e.g., MJB-FX Asian Sweep strategy).
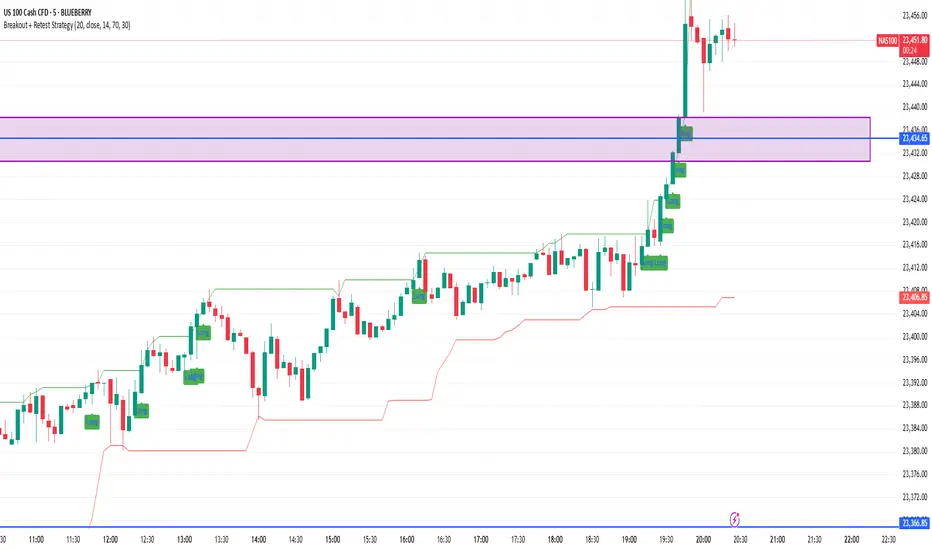
Breakout + Retest StrategyThe Breakout + Retest Strategy is a proven price action approach used by professional traders to catch high-probability market moves after key levels are broken. This strategy aims to enter the market after confirmation — reducing false breakouts and improving entry accuracy.
🔍 Strategy Logic:
Identify a Key Support or Resistance Level
These could be recent swing highs/lows, consolidation zones, or session highs.
Wait for a Clean Breakout
Price must decisively break above resistance or below support with strong momentum.
Watch for the Retest
After the breakout, wait for the price to pull back to the broken level (now flipped support/resistance).
Enter on Retest Confirmation
Look for signs like rejection wicks, bullish/bearish engulfing candles, or strong volume on the retest.
Set Risk-Managed Stops and Targets
Stop loss goes below (for long) or above (for short) the retested level.
Target is usually set at a 1:2 or higher risk-to-reward ratio, or based on structure.
✅ Why It Works:
Filters out fake breakouts
Uses market structure and liquidity traps to your advantage
Combines both momentum and confirmation
⚙️ Best Timeframes:
15-minute to 1-hour for intraday setups
4-hour and daily for swing trades
📊 Ideal for:
Futures (NQ, ES, Gold)
Forex pairs
Crypto
Stocks near key earnings or breakout zones
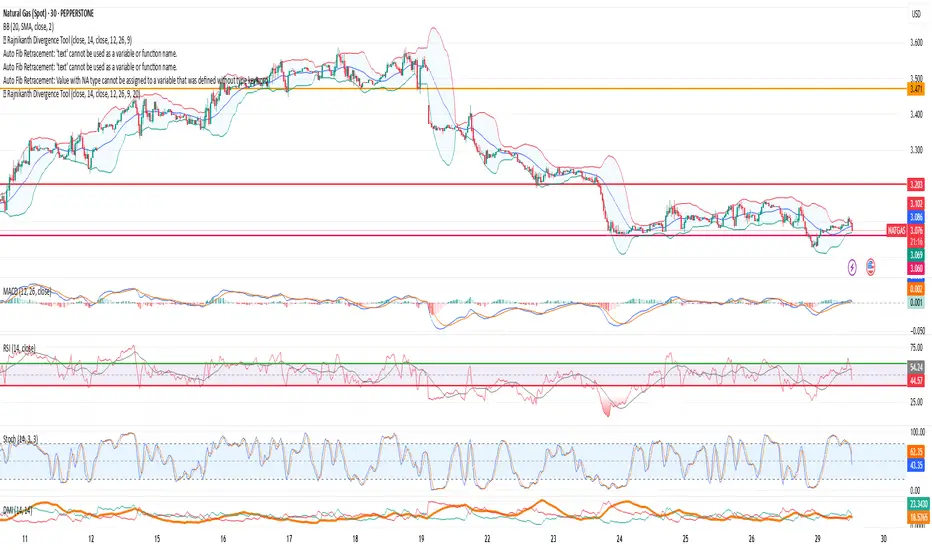
🕴 Rajnikanth Divergence Tool//@version=5
indicator("🕴 Rajnikanth Divergence Tool", overlay=true)
// === INPUTS ===
useRSI = input.bool(true, "Enable RSI Divergence")
useMACD = input.bool(true, "Enable MACD Divergence")
showLabels = input.bool(true, "Show Divergence Labels")
showHLines = input.bool(true, "Show Horizontal Lines")
showConnLines = input.bool(true, "Show Connecting Lines")
rsiSource = input.source(close, "RSI Source")
rsiLength = input.int(14, "RSI Length")
macdSrc = input.source(close, "MACD Source")
macdFast = input.int(12, "MACD Fast Length")
macdSlow = input.int(26, "MACD Slow Length")
macdSig = input.int(9, "MACD Signal Smoothing")
volFilter = input.bool(true, "Use Volume Filter")
volLen = input.int(20, "Volume MA Length")
// === CALCULATIONS ===
rsi = ta.rsi(rsiSource, rsiLength)
= ta.macd(macdSrc, macdFast, macdSlow, macdSig)
macdHist = macdLine - signalLine
volMA = ta.sma(volume, volLen)
volOk = not volFilter or volume > volMA
// === TRACKING VARIABLES (Fixed typing)
var float lastLowPrice = na
var float lastLowRSI = na
var float lastLowMACD = na
var int lastLowBar = na
var float lastHighPrice = na
var float lastHighRSI = na
var float lastHighMACD = na
var int lastHighBar = na
// === DIVERGENCE FLAGS ===
bullDivRSI = false
bearDivRSI = false
revBullDivRSI = false
revBearDivRSI = false
bullDivMACD = false
bearDivMACD = false
revBullDivMACD = false
revBearDivMACD = false
// === FUNCTION TO DRAW DIVERGENCES ===
plotDivergence(cond, labelText, location, color_, price, fromBar) =>
if cond and volOk
if showLabels
label.new(bar_index, price, labelText, style=label.style_label_left, textcolor=color.white, size=size.small, color=color_)
if showHLines
line.new(bar_index, price, bar_index + 5, price, color=color_, width=1)
if showConnLines and not na(fromBar)
line.new(fromBar, price, bar_index, price, color=color_, width=1)
// === DETECT BOTTOMS ===
if ta.lowestbars(low, 3) == 1
if useRSI and not na(lastLowRSI)
bullDivRSI := (low < lastLowPrice) and (rsi > lastLowRSI)
revBullDivRSI := (low > lastLowPrice) and (rsi < lastLowRSI)
if useMACD and not na(lastLowMACD)
bullDivMACD := (low < lastLowPrice) and (macdHist > lastLowMACD)
revBullDivMACD := (low > lastLowPrice) and (macdHist < lastLowMACD)
lastLowPrice := low
lastLowRSI := rsi
lastLowMACD := macdHist
lastLowBar := bar_index
// === DETECT TOPS ===
if ta.highestbars(high, 3) == 1
if useRSI and not na(lastHighRSI)
bearDivRSI := (high > lastHighPrice) and (rsi < lastHighRSI)
revBearDivRSI := (high < lastHighPrice) and (rsi > lastHighRSI)
if useMACD and not na(lastHighMACD)
bearDivMACD := (high > lastHighPrice) and (macdHist < lastHighMACD)
revBearDivMACD := (high < lastHighPrice) and (macdHist > lastHighMACD)
lastHighPrice := high
lastHighRSI := rsi
lastHighMACD := macdHist
lastHighBar := bar_index
// === PLOTS ===
plotDivergence(bullDivRSI, "RSI Bull Div", location.belowbar, color.green, low, lastLowBar)
plotDivergence(bearDivRSI, "RSI Bear Div", location.abovebar, color.red, high, lastHighBar)
plotDivergence(revBullDivRSI, "RSI RevBull", location.belowbar, color.lime, low, lastLowBar)
plotDivergence(revBearDivRSI, "RSI RevBear", location.abovebar, color.orange, high, lastHighBar)
plotDivergence(bullDivMACD, "MACD Bull Div", location.belowbar, color.navy, low, lastLowBar)
plotDivergence(bearDivMACD, "MACD Bear Div", location.abovebar, color.maroon, high, lastHighBar)
plotDivergence(revBullDivMACD, "MACD RevBull", location.belowbar, color.blue, low, lastLowBar)
plotDivergence(revBearDivMACD, "MACD RevBear", location.abovebar, color.purple, high, lastHighBar)
// === ALERT CONDITIONS ===
alertcondition(bullDivRSI, "RSI Bullish Divergence", "RSI Bullish Divergence detected")
alertcondition(bearDivRSI, "RSI Bearish Divergence", "RSI Bearish Divergence detected")
alertcondition(revBullDivRSI, "RSI Reverse Bullish", "RSI Reverse Bullish Divergence detected")
alertcondition(revBearDivRSI, "RSI Reverse Bearish", "RSI Reverse Bearish Divergence detected")
alertcondition(bullDivMACD, "MACD Bullish Divergence", "MACD Bullish Divergence detected")
alertcondition(bearDivMACD, "MACD Bearish Divergence", "MACD Bearish Divergence detected")
alertcondition(revBullDivMACD, "MACD Reverse Bullish", "MACD Reverse Bullish Divergence detected")
alertcondition(revBearDivMACD, "MACD Reverse Bearish", "MACD Reverse Bearish Divergence detected")
Engulfing DashboardThis is an indicator that detects candles based on the **Engulfing system** I’ve studied — from **wick to wick**.
It determines whether it’s a Buy or Sell based on the **opening price** and how the candle moves.
Anyone familiar with the Engulfing system will know how to use it.
It’s especially useful for people who use only **one screen** and can’t constantly monitor multiple timeframes.
And don’t forget:
**Trend is your friend.**

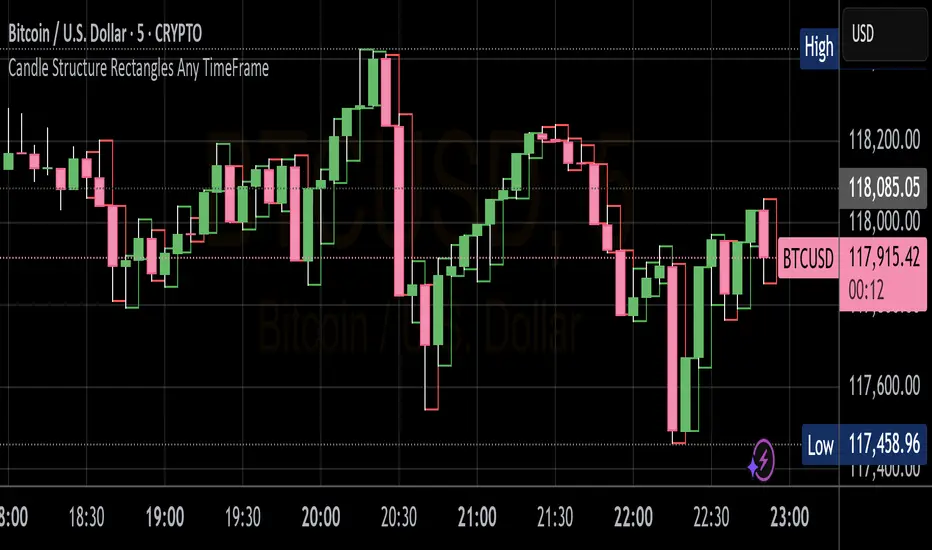
Candle Structure Rectangles Any TimeFrameThis indicator draws the rectangles around the candle wick based on the timeframe selected on the chart.
This will help analyze the candle structure with respect to previous candle and series of candles
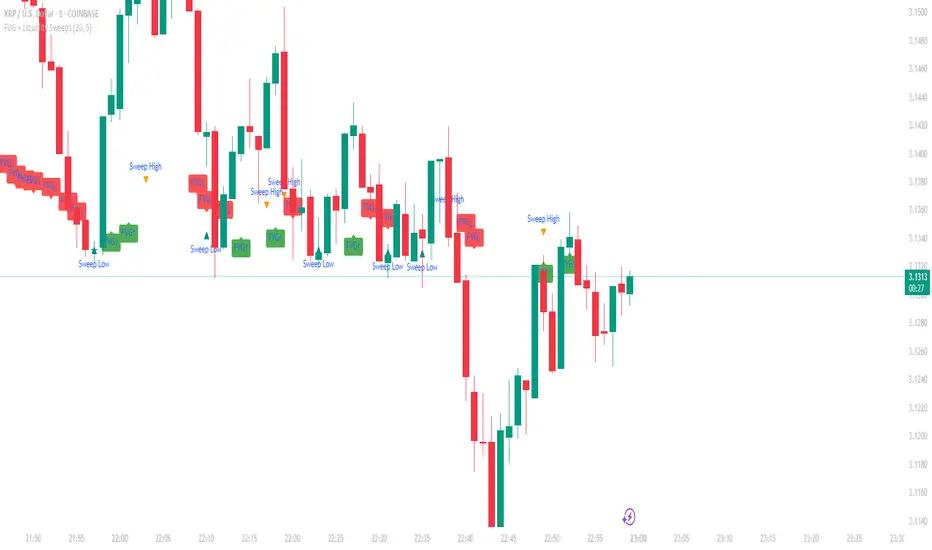
FVG + Liquidity Sweepsthis is a test and i don't know if it is gonna actually work but let me know if it does.
Sessions (Blvck 5min Orb Range)Blvck 5min Orb + session indicator. Lays out the main sessions times with a background colour

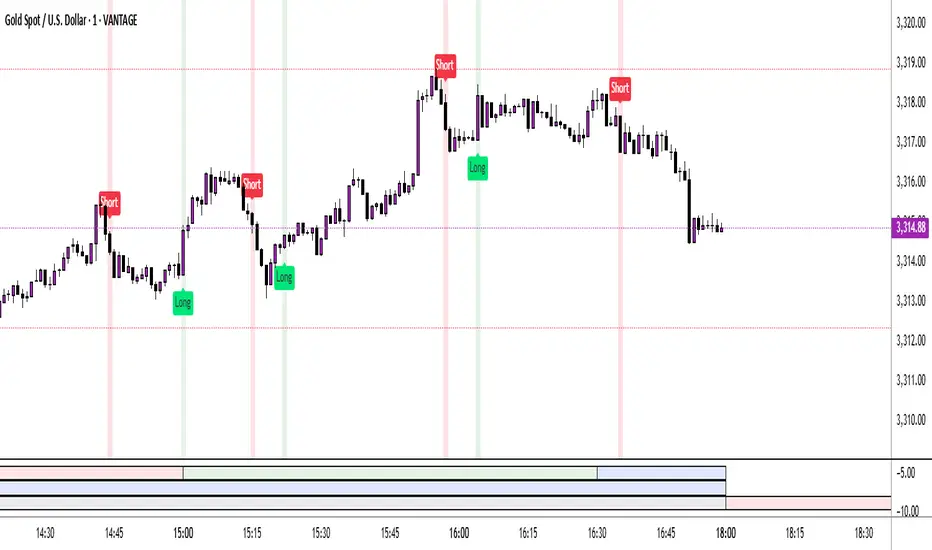
Twin Range Filter – Buy/Sell SignalsThe Twin Range Filter is a trend-following indicator that combines two adaptive volatility filters to identify potential market reversals and trend continuations. It uses two configurable smoothing periods (fast and slow) to calculate a dynamic range around price, filtering out market noise and highlighting meaningful shifts in direction.
This indicator plots BUY and SELL signals based on price action in relation to the range filter, as well as internal trend conditions.
✅ How It Works:
Long Signal (BUY) is triggered when:
Price is above the filtered range (showing strength), and
Short-term upward momentum is confirmed.
Short Signal (SELL) is triggered when:
Price is below the filtered range (showing weakness), and
Short-term downward momentum is confirmed.
The signals are highlighted using green "Long" and red "Short" labels on the chart.
Background colors reinforce the current directional bias.
🔔 Alerts:
Long Signal – A new BUY condition has been detected.
Short Signal – A new SELL condition has been detected.
📌 Use Cases:
Entry timing for swing or intraday trades
Trend confirmation filter
Signal generator in automated strategies (when paired with a strategy script)
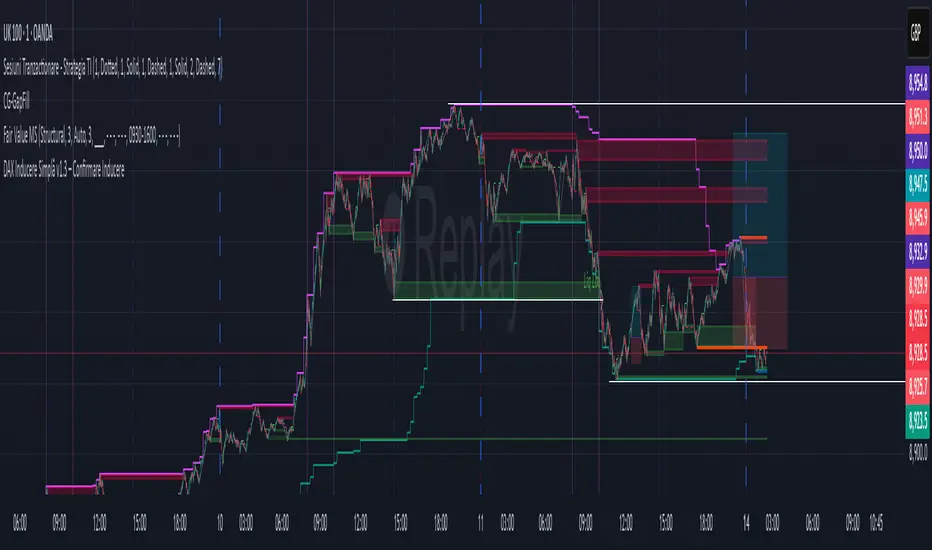
DAX Inducere Simplă v1.3 – Confirmare InducereDAX Inducere Simplă v1.3 – Confirmare Inducere ,signals before fvg mss and displacement
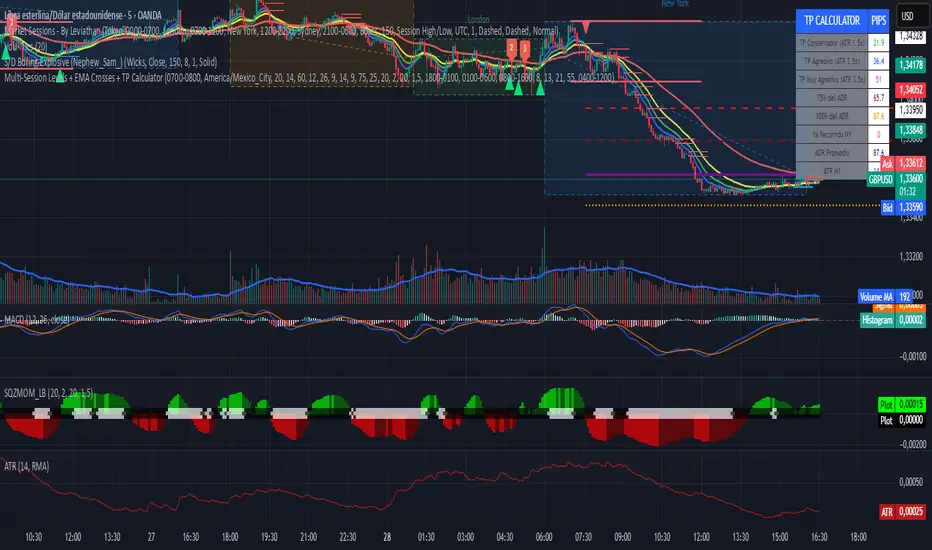
Multi-Session Levels + EMA Crosses + TP Calculator (GBP/USD)# Multi-Session Levels + EMA Crosses + TP Calculator
## 📋 Description
**Advanced trading indicator combining multi-session analysis, EMA cross validation, and automated Take Profit calculations for Forex markets.**
This comprehensive tool integrates session-based level analysis with validated EMA crossovers and intelligent TP calculations, designed specifically for serious traders who need precise entry signals with calculated exit strategies.
## 🎯 Key Features
### 📊 **Multi-Session Analysis**
- **Asian Session (6PM-1AM Mexico)**: Generates key support/resistance levels
- **London Session (1AM-6AM Mexico)**: Analyzes manipulation patterns
- **New York Session (8AM-4PM Mexico)**: Dynamic levels with trend confirmation
- **AMD Setup Detection**: Combines all sessions for high-probability setups
### 📈 **Advanced EMA System**
- **4 EMAs**: 8, 13, 21, and 55 periods with visual display
- **Validated Crossovers**: EMA 8 vs EMA 13 with multiple confirmations
- **Smart Filtering**: Only shows signals during optimal trading hours (6AM-12PM Mexico)
### ✅ **Triple Validation System**
- **MACD Confirmation**: Histogram strength + signal line position + momentum direction
- **RSI Filter**: Overbought/oversold levels with moving average confirmation
- **Squeeze Momentum**: Bollinger Bands vs Keltner Channels compression detection
### 💰 **Intelligent TP Calculator**
- **ADR-Based Targets**: Uses Average Daily Range for realistic profit expectations
- **ATR Multipliers**: Conservative (1.5x), Aggressive (2.5x), Very Aggressive (3.5x)
- **Session-Aware**: Considers already-traveled distance in NY session
- **Real-Time Table**: Live pip calculations for all TP levels
- **Visual Levels**: Automatic TP lines drawn on chart with color coding
### 🚨 **Smart Alert System**
- **Validated Signals Only**: Alerts trigger only when ALL confirmations align
- **TP Integration**: Alerts include suggested take profit levels
- **Non-Validated Tracking**: Shows basic crosses that don't meet full criteria
## 📐 **Technical Calculations**
### **ADR (Average Daily Range)**
- 20-period average of daily high-low ranges
- Converted to pips for easy interpretation
- Used for percentage-based TP targets (50%, 75%, 100% of ADR)
### **ATR (Average True Range)**
- 14-period ATR from H1 timeframe (configurable)
- Accounts for gaps and volatility
- Base for multiplier-based TP levels
### **Session Tracking**
- Real-time monitoring of NY session range
- Calculates remaining potential movement
- Optimizes TP placement based on session progress
## 🎨 **Visual Elements**
### **Chart Levels**
- **Orange Lines**: Asian and London session levels
- **White/Green/Red Lines**: NY session levels (color changes with trend direction)
- **TP Lines**: Color-coded take profit levels with different styles
### **EMA Display**
- **Blue**: EMA 8 (fastest)
- **Green**: EMA 13 (signal line)
- **Yellow**: EMA 21 (trend filter)
- **Red**: EMA 55 (major trend)
### **Signal Shapes**
- **Bright Triangles**: Fully validated signals
- **Faded Triangles**: Non-validated basic crosses
- **Size Variation**: Signal strength indication
## 📊 **Information Table**
Real-time display showing:
- **TP Levels**: All calculated take profit targets in pips
- **Session Data**: NY range already traveled vs average
- **Volatility Metrics**: Current ATR and ADR values
- **Clean Design**: Easy-to-read format with color coding
## ⚙️ **Customization Options**
### **Session Times**
- Fully configurable session times
- Mexico City timezone support
- Enable/disable individual session analysis
### **Validation Controls**
- Toggle MACD, RSI, Squeeze validation independently
- Adjust RSI overbought/oversold levels
- Customize MACD and Squeeze parameters
### **Display Options**
- Show/hide EMAs, crosses, TP levels, table
- Customize TP calculation periods (ADR, ATR)
- Choose ATR timeframe for calculations
## 🎯 **Ideal For**
- **Forex Day Traders**: Especially USD pairs during NY session
- **Session-Based Strategies**: Traders who respect market sessions
- **Risk Management Focus**: Those who need calculated exit strategies
- **Multi-Timeframe Analysis**: Traders using H1-H4 charts
## 📈 **Best Practices**
1. **Use during high-volume sessions** (London-NY overlap)
2. **Wait for full validation** before entering trades
3. **Consider session context** when setting TPs
4. **Combine with proper risk management** (1-2% per trade)
5. **Backtest thoroughly** before live trading
## ⚠️ **Important Notes**
- **Signals work best** during trending market conditions
- **AMD setups** provide highest probability entries
- **TP levels are suggestions** - adjust based on market context
- **Always use stop losses** (not included in this indicator)
- **Designed for Forex markets** - may need adjustment for other instruments
---
*This indicator combines proven technical analysis concepts with modern session-based trading approaches, providing both entry timing and exit planning in one comprehensive tool.*
Advanced Swing Breakout + RSI + EMA + Smart Volume SpikeThis indicator is designed to identify high-probability swing trade setups using a confluence of:
Swing High/Low Breakouts
RSI Trend Strength
EMA Directional Bias
Smart Volume Spike Confirmation
It combines key price action levels with volume and momentum filters to generate clean, actionable breakout alerts. It’s perfect for both intraday and swing traders looking to trade breakouts with confirmation from multiple technical layers.
⚙️ How It Works:
✅ Swing Detection:
Plots Swing Highs and Swing Lows based on the past N candles.
Highlights breakouts above highs or breakdowns below lows.
💪 RSI Filter:
Confirms whether the breakout is supported by RSI momentum.
Bullish breakout requires RSI > 50 and price above EMA.
Bearish breakdown requires RSI < 50 and price below EMA.
📈 EMA Trend Bias:
EMA (default 20-period) shows directional bias.
Used as a filter to confirm trade direction.
🔊 Smart Volume Spike:
Detects significant volume spikes above a moving average threshold.
Color-coded bars show whether volume is bullish, bearish, or neutral.
Ensures breakout is not on weak or average volume.
🚨 Alerts Included:
✅ Break Above Swing High: Only triggers when RSI, EMA, and Volume all confirm the move.
⚠️ Break Below Swing Low: Triggered only when bearish conditions are met.
📊 Visual Output:
Swing Highs: 🔴 Red Dots
Swing Lows: 🟢 Green Dots
EMA Line: 🟠 Orange Line
Volume Spike Bars: Appears in separate pane with dynamic color logic.
🧠 Best Use Cases:
Intraday Scalping (5m–15m timeframes)
Swing Trading (1H–4H)
Breakout Confirmation
Volume-Supported Entry Filtering
