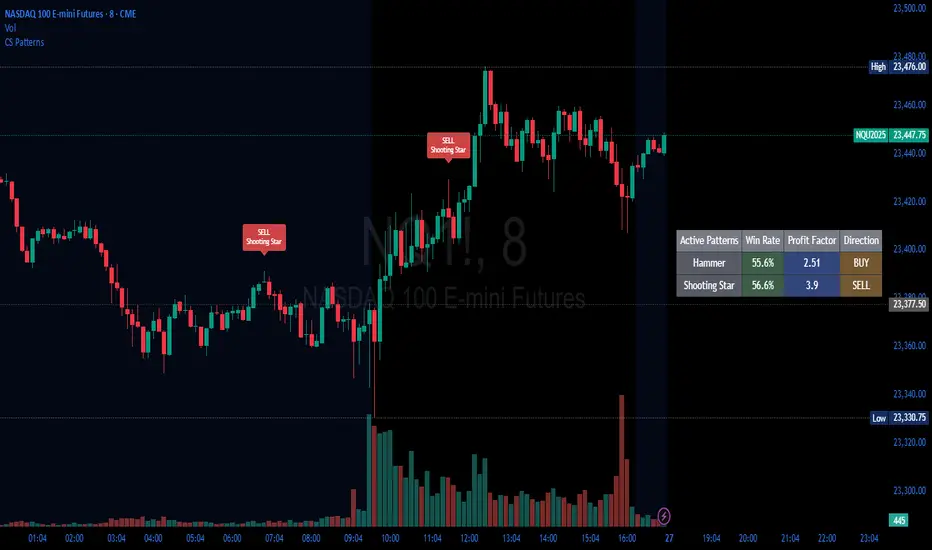
Candlestick Patterns Backtester [Optimized]Candlestick Patterns Backtester
What this is: This indicator is based on a really cool candlestick pattern backtester that I found (I'll update this later when I remember where I got it from or find the actual author). The original had this massive table showing win/loss ratios for a bunch of candlestick patterns, and according to the built-in backtester, it was actually profitable - which was pretty impressive.
The Problem: I played around with the original for a while but honestly wasn't really able to get it to work well at all for actual trading. It was still pretty cool to look at though! The main issues were:
It was just a big static table - hard to do anything useful with it
Couldn't send signals out to other strategies
The code was a monster - like 2,000+ lines of repetitive mess
What I Did: I completely refactored this thing and got it down from 2,000+ lines to just a few hundred lines. Much cleaner now! Here's what it does:
45+ Candlestick Patterns - All the classics are in there
Dynamic Filtering - Set your own requirements (minimum win rate, profit factor, total trades, etc.)
Flexible Logic - Choose AND/OR logic for your filters
Signal Generation - Creates actual buy/sell signals you can use with other strategies
Visual Badges - Shows pattern badges on chart when they meet your criteria
Active Patterns Table - Only shows patterns that are currently profitable based on your settings
Settings You Can Adjust:
Minimum win rate threshold
Minimum profit factor
Minimum number of trades required
Whether to use AND or OR logic for filtering
Colors, badge display, debug options
Reality Check: Trading these patterns really wasn't for me, but it was still a great learning experience. The backtesting results look good on paper, but as always, past performance doesn't guarantee future results. Use this as a research tool and educational resource more than anything else.
Credit: This is based on someone else's original work that I heavily modified and optimized. I'll update this description once I track down the original author to give proper credit where it's due.
This introduction captures your casual, honest tone while explaining the technical improvements you made and setting realistic expectations about the indicator's practical use.
Candlestick analysis
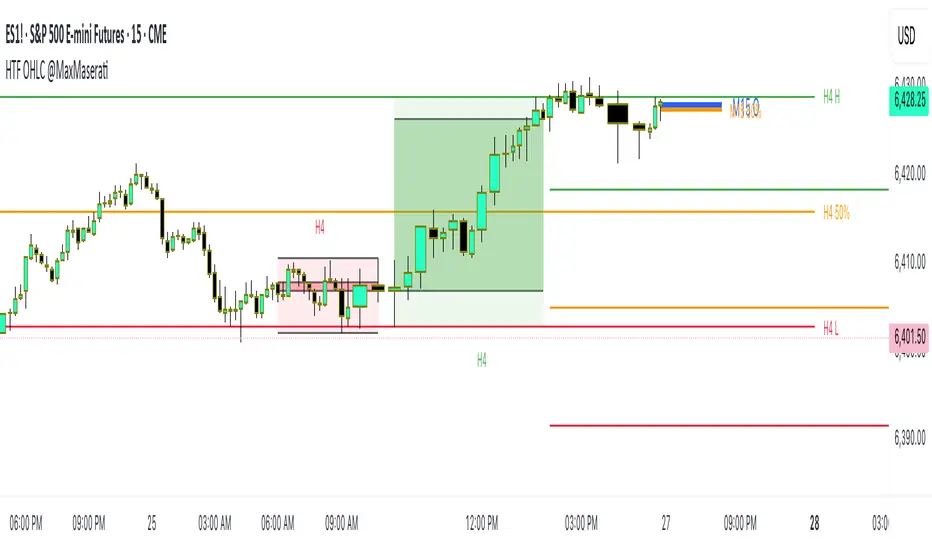
HTF OHLC Candle + 50% @MaxMaseratiHTF OHLC Candle + 50% @MaxMaserati
This advanced multi-timeframe indicator displays higher timeframe OHLC data as visual candle boxes and extended key levels on lower timeframe charts, providing essential context for institutional trading decisions.
Core Functionality:
Multi-Timeframe Box Display:
Main Timeframe Box (Default H4): Shows complete higher timeframe candles as colored boxes with separate body and wick visualization, including bullish (green) and bearish (red) candle representation with customizable transparency levels.
Independent Box 2 (Default M15): Secondary timeframe display with lime/fuchsia color scheme, allowing traders to monitor intermediate timeframes simultaneously with different visual styling.
Independent Box 3 (Default H1): Third independent timeframe with blue/orange color scheme, providing additional context for multi-timeframe analysis and confluence identification.
OHLC Level Analysis:
Each timeframe box includes individual Open, High, Low, and Close level lines with customizable colors and visibility settings. These levels act as key support and resistance zones that institutional traders often respect.
50% Retracement Levels:
Automatic calculation and display of 50% levels between each timeframe's high and low, representing critical equilibrium zones where price often finds support or resistance during retracements.
Extended Line System:
Current Live Timeframe Extended Lines: Real-time extension of the forming candle's Open, High, Low, and 50% levels with customizable line weights and label positioning.
TF2 Extended Lines (Default H4): Previous completed candle's key levels extended forward, showing immediate higher timeframe reference points for current price action.
TF3 Extended Lines (Default Daily): Longer-term reference levels from daily or weekly timeframes, providing macro trend context and major institutional levels.
Key Features:
Smart Timeframe Detection: Only displays boxes for timeframes higher than the current chart timeframe, preventing redundant information and maintaining chart clarity.
Global Box Limit Control: Intelligent cleanup system that maintains optimal performance by limiting total displayed elements while preserving the most recent and relevant timeframe periods.
Comprehensive Customization: Full control over colors, transparency, line weights, label sizes, and visibility for each timeframe component, allowing personalized setups for different trading styles.
Label System: Automatic timeframe identification labels (H4, M15, D1, etc.) positioned on each box for instant timeframe recognition and clear multi-timeframe organization.
Current Candle Options: Optional display of forming/current candles for each timeframe, enabling real-time monitoring of developing price action and potential setup completion.
This indicator is essential for traders utilizing multi-timeframe analysis, institutional trading concepts, and higher timeframe confluence strategies, providing clear visual representation of key levels and candle structures that drive major market movements.
Smart Money Concepts - By TradingNexus – Pro Visual Edition📊 Smart Money Concepts by TradingNexus
This script is designed for clean and visual Smart Money analysis.
This script identifies Smart Money Concepts with a clean and powerful visual layout, focusing on high-probability zones.
It displays:
Order Blocks (OB↑ / OB↓) when there's strong bullish or bearish candle reversal.
Fair Value Gaps (FVG↑ / FVG↓) only after impulsive candles (e.g., breaking previous highs/lows).
Break of Structure (BOS↑ / BOS↓) when a real structural shift happens.
🔥 Strong Zones only when OB + FVG + BOS align — these are ideal institutional entry areas.
CandleSensei – EMA200, Wick & Pattern Alerts)CandleSensei is an advanced Pine Script designed for traders who need real-time alerts on key price action signals and candlestick patterns. It combines EMA200 analysis, volatility (ATR), wick/body detection, and classical candlestick pattern recognition (Engulfing, Pin Bar, Doji, Marubozu) – all in a single tool.
Key Features:
EMA200 HUD – Displays price deviation from EMA200 with directional arrows (▲ / ▼) and percentage values.
Wick Alerts – Alerts for significant wicks:
WICK ALERT: ↓🐂 3.5% (long lower wick – bullish signal).
WICK ALERT: ↑🐻 4.2% (long upper wick – bearish signal).
Big Body Alerts – Detects strong candle bodies exceeding a customizable threshold.
BIG BODY ALERT: ↑ 5.8%
BIG BODY ALERT: ↓ 4.7%
Candlestick Patterns – Automatic alerts for:
Engulfing (🟢🐂 or 🔴🐻).
Pin Bar (🟢🔨 Hammer, 🔴☄️ Shooting Star).
Doji (⚪ Doji 🟢↑ / 🔴↓).
Marubozu (📏 Marubozu 🟢↑ / 🔴↓).
On-Chart HUD – Shows ATR, price vs EMA200, wick size, and full body % in a compact table.
Why use CandleSensei?
Perfect for swing traders (Daily/Weekly analysis) and intraday traders (1H).
Combines trend direction, volatility, and price action patterns in a single dashboard.
Fully customizable thresholds for wick and body alerts.

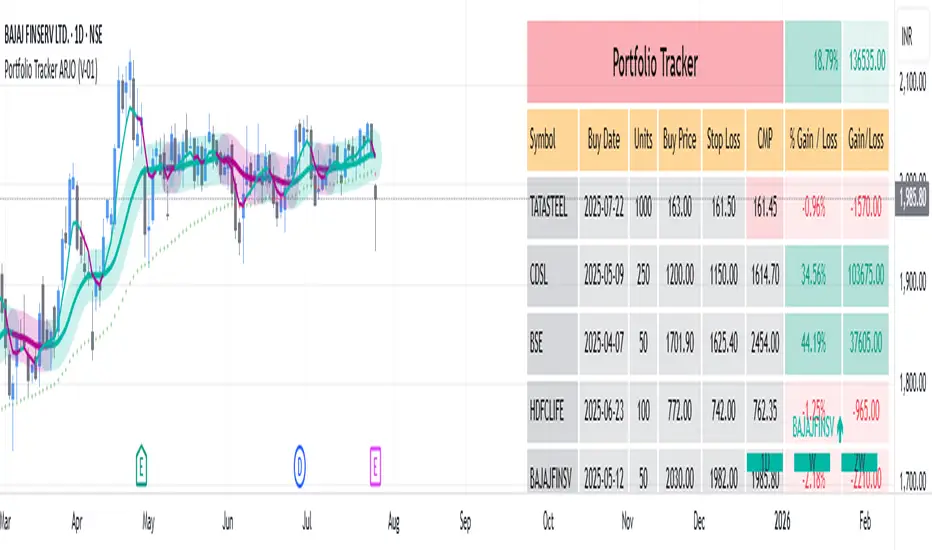
Portfolio Tracker ARJO (V-01)Portfolio Tracker ARJO (V-01)
This indicator is a user-friendly portfolio tracking tool designed for TradingView charts. It overlays a customizable table on your chart to monitor up to 15 stocks or symbols in your portfolio. It calculates real-time metrics like current market price (CMP), gains/losses, and stoploss breaches, helping you stay on top of your investments without switching between multiple charts. The table uses color-coding for quick visual insights: green for profits, red for losses, and highlights breached stoplosses in red for alerts. It also shows portfolio-wide totals for overall performance.
Key Features
Supports up to 15 Symbols: Enter stock tickers (e.g., NSE:RELIANCE or BSE:TCS) with details like buy price, date, units, and stoploss.
Symbol: The stock ticker and description.
Buy Date: When you purchased it.
Units: Number of shares/units held.
Buy Price: Your entry price.
Stop Loss: Your set stoploss level (highlighted in red if breached by CMP).
CMP: Current market price (fetched from the chart's timeframe).
% Gain/Loss: Percentage change from buy price (color-coded: green for positive, red for negative).
Gain/Loss: Total monetary gain/loss based on units.
Optional Timeframe Columns: Toggle to show % change over 1 Week (1W), 1 Month (1M), 3 Months (3M), and 6 Months (6M) for historical performance.
Portfolio Summary: At the top of the table, see total % gain/loss and absolute gain/loss for your entire portfolio.
Visual Customizations: Adjust table position (e.g., Top Right), size, colors for positive/negative values, and intensity cutoff for gradients.
Benchmark Index-Based Header: The title row's background color reflects NIFTY's weekly trend (green if above 10-week SMA, red if below) for market context.
Benchmark Index-Based Header: The title row's background color reflects NIFTY's weekly trend (green if above 10-week SMA, red if below) for market context.
How to Use It: Step-by-Step Guide
Add the Indicator to Your Chart: Search for "Portfolio Tracker ARJO (V-01)" in TradingView's indicator library and add it to any chart (preferably Daily timeframe for accuracy).
Input Your Portfolio Symbols:
Open the indicator settings (gear icon).
In the "Symbol 1" to "Symbol 15" groups, fill in:
Symbol: Enter the ticker (e.g., NSE:INFY).
Year/Month/Day: Select your buy date (e.g., 2024-07-01).
Buy Price: Your purchase price per unit.
Stoploss: Your exit price if things go south.
Units: How many shares you own.
Only fill what you need—leave extras blank. The table auto-adjusts to show only entered symbols.
Customize the Table (Optional):
In "Table settings":
Choose position (e.g., Top Right) and size (% of chart).
Toggle "Show Timeframe Columns" to add 1W/1M/3M/6M performance.
In "Color settings":
Pick colors for positive (green) and negative (red) cells.
Set "Color intensity cutoff (%)" to control how strong the colors get (e.g., 10% means changes above 10% max out the color).
Interpret the Table on Your Chart:
The table appears overlaid—scan rows for each symbol's stats.
Look at colors: Greener = better gains; redder = bigger losses.
Check CMP cell: Red means stoploss breached—consider selling!
Portfolio Gain/Loss at the top gives a quick overall health check.
For Best Results:
Use on a Daily chart to avoid CMP errors (the script will warn if on Weekly/Monthly).
Refresh the chart or wait for a new bar if data doesn't update immediately.
For Indian stocks, prefix with NSE: or BSE: (e.g., BSE:RELIANCE).
This is for tracking only—not trading signals. Combine with your strategy.
If no symbols show, ensure inputs are valid (e.g., buy price > 0, valid date).
Finally, this tool makes it quite easy for beginners to track their portfolios, while also giving advanced traders powerful and customizable insights. I'd love to hear your feedback—happy trading!
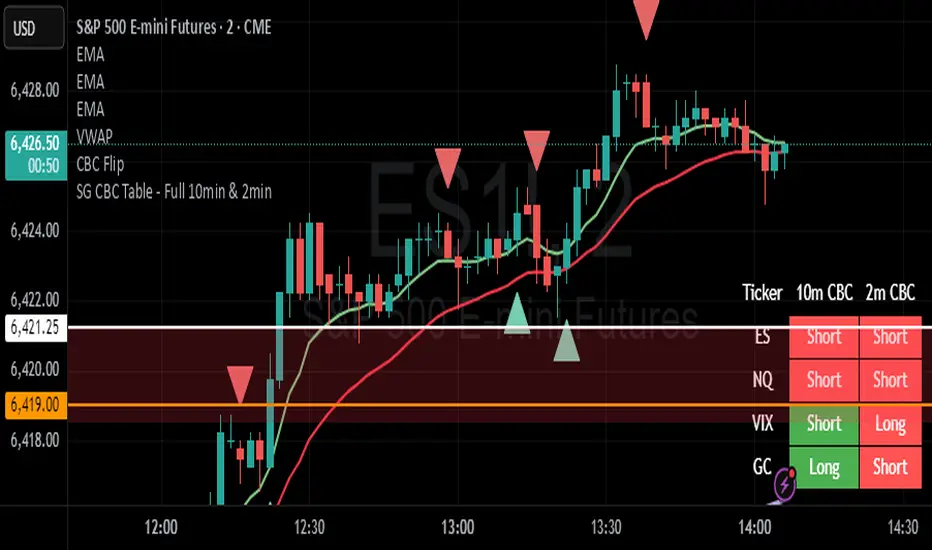
SG CBC Table - Full 10min & 2minBased on SG CBC Table has 10 min and 2 min CBC status and GC. Also customizable table colors of the background can be changed or made transparent. Indicator Updates every 10 minutes on a 10 minute chart and every 2 minutes on a 2 minute chart
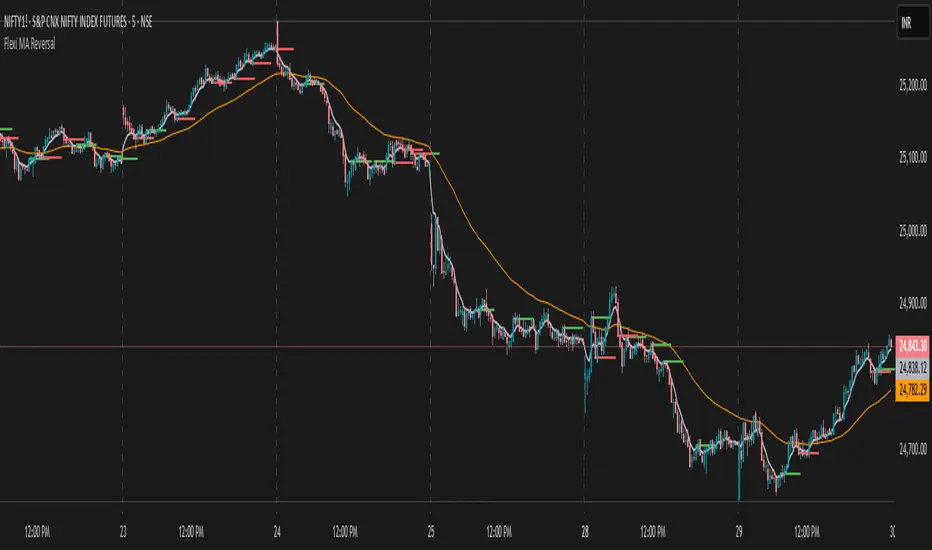
Flexi MA Reversal🔹 FlexiMA Reversal – Customizable MA-Based Reversal Indicator
FlexiMA Reversal is a real-time, moving average-based reversal indicator designed to highlight potential market turning points using signal and alert lines. It provides visual cues for both early alerts and confirmed entry signals on candle close.
🔧 Key Features:
Customizable Moving Average Type: Choose from EMA, SMA, WMA, or VWMA (default is EMA).
Flexible MA Inputs: Configure up to three MAs (commonly used 5, 50, and 200).
Toggle Visibility: Enable or disable each MA line as needed.
Real-Time Alert System:
Thin alert lines appear when a potential reversal is detected.
Thicker signal lines confirm the reversal when price closes beyond the alert level.
Optional Visual Styling:
Choose custom colors for each MA, signal, and alert line.
Alert candles are automatically colored to match the corresponding alert line.
Option to show only signal lines for cleaner charts.
Customizable projection length for both alert and signal lines.
📈 Strategy Logic:
This indicator is designed to detect reversal opportunities based on the relationship between price and a selected short-term moving average.
Bullish Setup:
Price closes below the selected MA (e.g., EMA 5).
A bullish alert line is drawn at the high.
If a subsequent candle closes above the alert line and the MA, a bullish signal line is plotted.
Bearish Setup:
Price closes above the selected MA.
A bearish alert line is drawn at the low.
If a subsequent candle closes below the alert line and the MA, a bearish signal line is plotted.
This approach attempts to capture quick market shifts where short-term momentum reverses direction near key MA levels.
🎯 How to Use:
Although originally developed using the 5 EMA strategy, through testing it was found that using 6, 7, or 8 EMA offers even better signal quality.
To add broader trend context, 50 MA and 200 MA lines are included and can be toggled on/off based on your strategy preference.
🔍 Trend Filtering & Re-Entry Tips:
Due to the nature of shorter moving averages, reversal signals may appear frequently. For better trend alignment:
Use the 50 MA as a trend filter:
❌ Ignore bearish signals when price is above 50 MA
❌ Ignore bullish signals when price is below 50 MA
Alternatively, filtered-out signals can be used for re-entry within the trend:
For example, if you receive a bearish alert and signal above the 50 MA, and the next candle closes back above the bearish alert line, this may be interpreted as a bullish re-entry opportunity into the prevailing uptrend.
🛠️ Styling Tips:
You can disable alert candle coloring in the Style tab of the indicator settings.
Use the "Show Only Signal Lines" checkbox to keep the chart minimalistic while still tracking confirmed entries.
Current Hourly Open Line with Sweep DetectionThis indicator marks out the high and low of the current hourly open candle.
Stats show, if the current hourly candle takes the high or low of the previous 1H candle there is a chance price returns to the hourly open depending on the time the sweep on the high or low occurred.
There is a high chance >75% price returns to hourly open of current candle if the sweep happens in the first 20 minutes.
There is a medium chance 50% price returns to hourly open of current candle if the sweep happens in the 20-40 minute range of the current candle.
There is a low 25% chance if sweep happens from :40-:59 minutes of the hour.
We use this to spot manipulation on the hourly timeframe, we only want to target hourly open if it happens in the first 20 minutes. We then want to trade in opposite direction of the first move of the hourly, w/ context of course.
The indicator / line will change colors based on the time the first sweep occurred. You can change them to how you want. For default, blue is just the hourly open with no sweep yet.
Green means go, and the sweep happens within the first 20 minutes, Yellow is medium chance, and Red is small chance.
Squeeze Pro Momentum BAR color - KLTDescription:
The Squeeze Pro Momentum indicator is a powerful tool designed to detect volatility compression ("squeeze" zones) and visualize momentum shifts using a refined color-based system. This script blends the well-known concepts of Bollinger Bands and Keltner Channels with an optimized momentum engine that uses dynamic color gradients to reflect trend strength, direction, and volatility.
It’s built for traders who want early warning of potential breakouts and clearer insight into underlying market momentum.
🔍 How It Works:
📉 Squeeze Detection:
This indicator identifies "squeeze" conditions by comparing Bollinger Bands and Keltner Channels:
When Bollinger Bands are inside Keltner Channels → Squeeze is ON
When Bollinger Bands expand outside Keltner Channels → Squeeze is OFF
You’ll see squeeze zones classified as:
Wide
Normal
Narrow
Each represents varying levels of compression and breakout potential.
⚡ Momentum Engine:
Momentum is calculated using linear regression of the price's deviation from a dynamic average of highs, lows, and closes. This gives a more accurate representation of directional pressure in the market.
🧠 Smart Candle Coloring (Optimized):
The momentum color logic is inspired by machine learning principles (no hardcoded thresholds):
EMA smoothing and rate of change (ROC) are used to detect momentum acceleration.
ATR-based filters help remove noise and false signals.
Colors are dynamically assigned based on both direction and trend strength.
🧪 How to Use It:
Look for Squeeze Conditions — especially narrow squeezes, which tend to precede high-momentum breakouts.
Confirm with Momentum Color — strong colors often indicate trend continuation; fading colors may signal exhaustion.
Combine with Price Action — use this tool with support/resistance or patterns for higher probability setups.
Recommended For:
Trend Traders
Breakout Traders
Volatility Strategy Users
Anyone who wants visual clarity on trend strength
📌 Tip: This indicator works great when layered with volume and price action patterns. It is fully non-repainting and supports overlay on price charts.

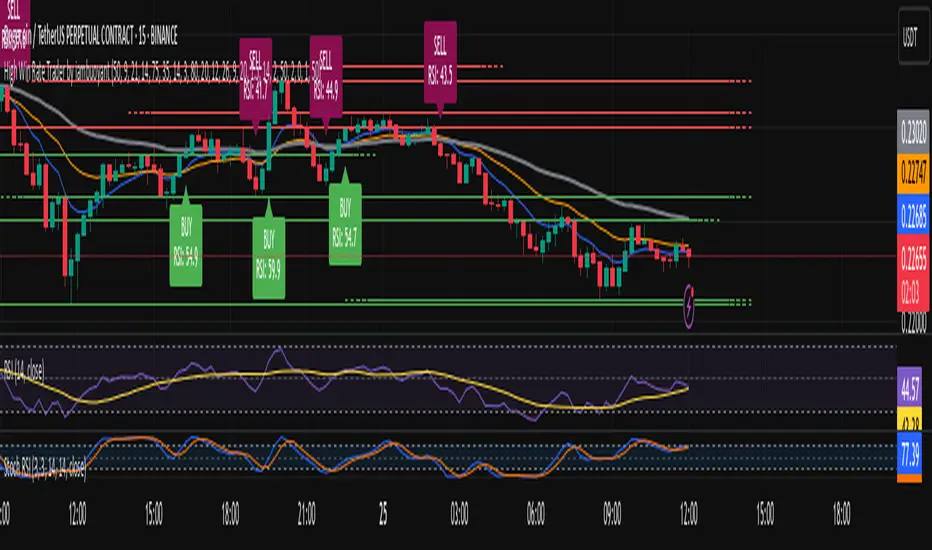
High Win Rate Trader by iambuoyant# High Win Rate Trader by iambuoyant - Complete Guide
## Introduction
The "High Win Rate Trader by iambuoyant" is a comprehensive Pine Script indicator designed to identify high-probability trading opportunities across various market conditions. Built with a multi-faceted approach, it integrates several key technical analysis concepts to provide robust buy and sell signals, aiming to maximize potential returns while managing risk. This indicator is particularly useful for traders looking for confirmed entries based on a confluence of factors rather than relying on a single signal.
## Core Philosophy
This indicator operates on the principle that **multiple confirming factors create higher probability trades**. Instead of relying on a single indicator, it combines trend analysis, momentum oscillators, volume confirmation, market structure, and mathematical levels to identify optimal entry points. The more confluence factors that align, the stronger the trading signal.
## Strategies and Confluence Factors
### 1. Trend Analysis
**Purpose**: Establishes the overall market direction to ensure trades align with momentum.
**Components**:
- **Fast EMA (Default: 9)**: Short-term trend detection
- **Slow EMA (Default: 21)**: Medium-term trend confirmation
- **Trend EMA (Default: 50)**: Long-term trend establishment
**How it works**:
- **Bullish Trend**: Fast EMA > Slow EMA > Trend EMA
- **Bearish Trend**: Fast EMA < Slow EMA < Trend EMA
- Signals are filtered to only trigger in the direction of the established trend
**Default Settings**:
- Fast EMA Period: 9
- Slow EMA Period: 21
- Trend EMA Period: 50
### 2. Oscillator Confirmation
**Purpose**: Identifies overbought/oversold conditions and momentum shifts.
#### RSI (Relative Strength Index)
- **Period (Default: 14)**: Standard RSI calculation period
- **Overbought Level (Default: 70)**: RSI level considered overbought
- **Oversold Level (Default: 30)**: RSI level considered oversold
**How it works**:
- **Bullish**: RSI < 40 and turning upward (oversold recovery)
- **Bearish**: RSI > 60 and turning downward (overbought rejection)
#### Stochastic Oscillator
- **K Period (Default: 14)**: Stochastic %K calculation period
- **D Period (Default: 3)**: Stochastic %D smoothing period
- **Overbought Level (Default: 80)**: Stochastic overbought threshold
- **Oversold Level (Default: 20)**: Stochastic oversold threshold
**How it works**:
- **Bullish**: %K < 30 and (%K turning up OR %K > %D)
- **Bearish**: %K > 70 and (%K turning down OR %K < %D)
### 3. MACD (Moving Average Convergence Divergence)
**Purpose**: Confirms momentum shifts and trend changes.
**Components**:
- **Fast Period (Default: 12)**: Fast EMA for MACD calculation
- **Slow Period (Default: 26)**: Slow EMA for MACD calculation
- **Signal Period (Default: 9)**: Signal line smoothing period
**How it works**:
- **Bullish**: MACD line > Signal line OR (MACD rising AND histogram increasing)
- **Bearish**: MACD line < Signal line OR (MACD falling AND histogram decreasing)
### 4. Volume Analysis
**Purpose**: Confirms price moves with volume conviction.
**Components**:
- **Volume MA Period (Default: 20)**: Period for volume moving average
- **Volume Multiplier (Default: 1.5)**: Volume threshold multiplier
**How it works**:
- **Bullish**: Current volume > (Volume MA × 1.5)
- **Bearish**: Current volume > (Volume MA × 1.5)
### 5. Market Structure and Volatility
#### Support and Resistance Levels
- **Pivot Length (Default: 10)**: Period for pivot high/low detection
- **Dynamic Levels**: Automatically identifies recent swing highs and lows
- **Proximity Check**: Ensures trades aren't initiated too close to S/R levels
#### ATR (Average True Range)
- **ATR Period (Default: 14)**: Volatility measurement period
- **ATR Multiplier (Default: 2.0)**: Stop loss distance multiplier
- **Volatility Filter (Default: 50.0%)**: Maximum allowed volatility percentage
**How it works**:
- Calculates market volatility using ATR
- Prevents trades in excessively volatile conditions
- Helps determine dynamic stop loss levels
### 6. Fibonacci Retracements
**Purpose**: Identifies key mathematical support/resistance levels.
**Components**:
- **Lookback Period (Default: 50)**: Period for swing high/low calculation
- **Tolerance (Default: 2.0%)**: Price proximity tolerance to Fib levels
**Key Levels**: 23.6%, 38.2%, 50%, 61.8%, 78.6%
**How it works**:
- **Bullish**: Price near 38.2%, 50%, or 61.8% retracement levels in uptrend
- **Bearish**: Price near 38.2%, 50%, or 61.8% retracement levels in downtrend
### 7. Risk Management
#### Risk:Reward Ratio
- **Minimum RR Ratio (Default: 1.0)**: Minimum acceptable risk:reward ratio
- **Dynamic Calculation**: Based on support/resistance levels and ATR
#### Dynamic Stop Loss
- **ATR-based**: Stop loss = Entry ± (ATR × 1.5)
- **S/R-based**: Uses nearby support/resistance levels when available
### 8. Signal Confirmation
**Confirmation Bars (Default: 0)**:
- **0**: Immediate signals (recommended for testing)
- **1+**: Delayed confirmation for reduced false signals
## How to Use the Indicator
### Step 1: Initial Setup
1. **Add to Chart**: Apply the "High Win Rate Trader by iambuoyant" indicator to your desired chart in TradingView
2. **Verify Display**: Ensure you can see the indicator plots and debug pane below the main chart
### Step 2: Understanding the Signals
#### Visual Elements:
- **Green Triangles (Buy)**: Appear below price bars for long entry signals
- **Red Triangles (Sell)**: Appear above price bars for short entry signals
- **Labels**: Show "BUY" or "SELL" with current RSI value
- **EMA Lines**: Blue (Fast), Orange (Slow), Gray (Trend) - visible when enabled
#### Signal Types:
- **Flash Signals**: Immediate signals when conditions are first met
- **Confirmed Signals**: Signals that have passed confirmation criteria
### Step 3: Debugging and Optimization
#### Access Debug Features:
1. Click the gear icon next to the indicator name
2. Navigate to "Signal Components (Debugging)" section
3. All confluence factors start **disabled** by default
#### Initial Testing Process:
1. **Start Simple**: Keep all "Enable X Condition" toggles **OFF**
2. **Enable Basic**: Turn on "Enable RSI Condition" first
3. **Observe Signals**: Check if buy/sell signals appear
4. **Gradual Addition**: Enable one condition at a time
5. **Monitor Debug Plots**: Watch the colored crosses in the lower pane
#### Debug Plot Interpretation:
- **Green Crosses (Value 1)**: Bullish conditions met
- **Red Crosses (Value 2)**: Bearish conditions met
- **No Cross**: Condition not met
- **"Debug: Final Long/Short Signal"**: Combined signal output
### Step 4: Fine-tuning Parameters
#### If Signals Are Too Rare:
1. **Reduce Thresholds**: Lower RSI overbought/oversold levels
2. **Relax Filters**: Increase volatility filter percentage
3. **Adjust Timeframes**: Modify EMA periods for your trading style
4. **Disable Strict Conditions**: Turn off conditions that are too restrictive
#### If Signals Are Too Frequent:
1. **Increase Thresholds**: Raise RSI levels
2. **Add Filters**: Enable more confluence conditions
3. **Stricter Confirmation**: Increase confirmation bars
4. **Higher RR Ratio**: Increase minimum risk:reward requirement
### Step 5: Display Configuration
#### Display Options:
- **Show Buy/Sell Labels**: Toggle signal labels on/off
- **Show Support/Resistance**: Toggle S/R level lines
- **Show Trend EMAs**: Toggle EMA trend lines
### Step 6: Setting Up Alerts
#### Alert Conditions:
- **"Confirmed Buy Signal"**: Triggers on confirmed long entries
- **"Confirmed Sell Signal"**: Triggers on confirmed short entries
#### Alert Message Format:
- Buy: "BUY - RSI: , Price: "
- Sell: "SELL - RSI: , Price: "
## Recommended Settings by Market Type
### Trending Markets:
- Enable: Trend Alignment, RSI, MACD
- Disable: Volume (optional)
- Confirmation Bars: 1-2
### Ranging Markets:
- Enable: RSI, Stochastic, Support/Resistance
- Disable: Trend Alignment
- Confirmation Bars: 0
### Volatile Markets:
- Enable: Volatility Filter, ATR-based stops
- Reduce: RSI thresholds (60/40 instead of 70/30)
- Increase: Confirmation bars to 2-3
## Troubleshooting
### No Signals Appearing:
1. Check if any "Enable X Condition" is turned ON
2. Verify debug plots show activity
3. Reduce parameter thresholds
4. Check if market conditions match your settings
### Too Many False Signals:
1. Enable more confluence conditions
2. Increase confirmation bars
3. Adjust RSI/Stochastic thresholds
4. Enable volatility filter
### Signals Not Aligning with Price Action:
1. Check trend alignment settings
2. Verify EMA periods match your timeframe
3. Adjust Fibonacci lookback period
4. Review support/resistance proximity settings
## Best Practices
1. **Start Conservative**: Begin with fewer confluence factors and gradually add more
2. **Test Thoroughly**: Use demo accounts to test parameter combinations
3. **Monitor Debug Plots**: Regularly check which conditions are failing
4. **Adapt to Market**: Adjust settings based on current market conditions
5. **Use Multiple Timeframes**: Consider higher timeframe trend direction
6. **Risk Management**: Always use proper position sizing and stop losses
## Default Settings Summary
### Trend Analysis:
- Fast EMA: 9
- Slow EMA: 21
- Trend EMA: 50
### Oscillators:
- RSI Period: 14, Overbought: 70, Oversold: 30
- Stochastic K: 14, D: 3, Overbought: 80, Oversold: 20
### MACD:
- Fast: 12, Slow: 26, Signal: 9
### Volume:
- MA Period: 20, Multiplier: 1.5
### Market Structure:
- ATR Period: 14, Multiplier: 2.0
- Volatility Filter: 50.0%
- Pivot Length: 10
### Fibonacci:
- Lookback: 50, Tolerance: 2.0%
### Signal Quality:
- Confirmation Bars: 0
- Min RR Ratio: 1.0
### Display:
- Show Labels: ON
- Show S/R: ON
- Show Trend: ON
### Debug (All Disabled by Default):
- Enable RSI: OFF
- Enable Stochastic: OFF
- Enable MACD: OFF
- Enable Price Structure: OFF
- Enable Trend Alignment: OFF
- Enable Volume: OFF
- Enable Fibonacci: OFF
- Enable Risk:Reward: OFF
- Enable Volatility: OFF
moving_averages_library_public🔍 Overview
A comprehensive open‑source Pine Script library offering a wide variety of moving average functions, including dynamic int-series support for variable-length MA calculations
Reddit
✨ Features
Dozens of moving averages supported:
SMA, EMA, WMA, TMA
Advanced types: ALMA, VRAMA, EFRAMA, EHMA, THMA, etc.
Each function supports both fixed-length and series-length input
Easily integrated into other indicators and strategies via dynamic length parameters
⚙️ How to Use
Import the library:
import T69/Moving_Averages/1 as ma
Call your desired MA function using source and length:
ma.hma(src, len)
ma.frama(src, len)
For dynamic integration, use an input type and pass to the matching function.
🛠 Example Code
src = input.source(close, "Source")
len = input.int(14, "Length")
type = input.string("HMA", "MA Type", options= )
ma_value = switch type
"EMA" => ma.ema(src,len)
"HMA" => ma.hma(src,len)
"FRAMA" => ma.frama(src,len)
=> na
plot(ma_value, color=color.blue)
⚠️ Limitations
Internal calculation precision may differ slightly from TradingView’s built‑in MA functions
Users must manually map input strings to MA functions
Does not include built‑in GUI dropdowns for selecting type
💡 Tips
Use adaptive MAs like VIDYA, JMA, or KAMA for volatility-aware smoothing
Combine with oscillators or ATR bands to define trend strength or entry zones
Utilize series‑based MA inputs for backtesting variability or optimization
📘 Credits
Author: MightyZinger
Published: June 2022 (Public Library), regularly updated
License: Open‑source. Reuse subject to TradingView House Rules
//====================TECHNICAL STUFFS====================
Library "moving_averages_library_public"
TODO: add library description here
new_def_teyoparams()
get_all_ma_enums()
get_ma_out(p_type, src, len, update_instances)
TODO: add function description here
Parameters:
p_type (series ma_type)
src (float) : TODO: Source of the candle for computation
len (simple int) : TODO: Length of lookback of the candle for computation
update_instances (teyo_parameters)
Returns: TODO: add what function returns
==============================================================================
Moving Average Selector
==============================================================================
teyo_parameters
Fields:
p1 (series float)
p2 (series float)
p3 (series float)
p4 (series float)
p5 (series float)
p6 (series float)
p7 (series float)
p8 (series float)
p9 (series float)
p10 (series float)
p11 (series float)
p12 (series float)
p13 (series float)
p14 (series float)
p15 (series float)
p16 (series float)
p17 (series float)
p18 (series float)
p19 (series float)
p20 (series float)

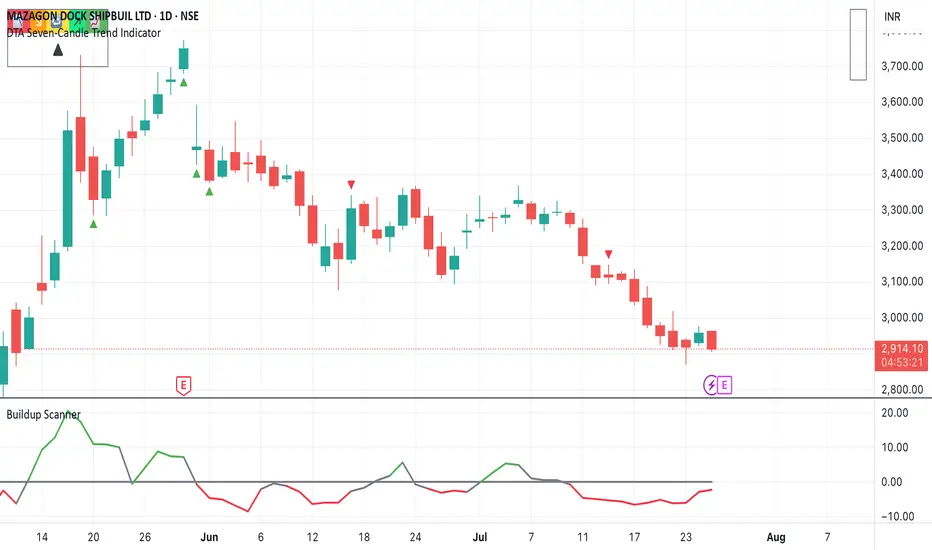
DTA Seven-Candle Trend IndicatorSeven candles Trend Identifier
📊 Output:
* Trend shown in table: "Uptrend", "Downtrend", or "Sideways"
* Strength level:
* "Strong" = 10+ confirmations (HH/HL or LL/LH)
* "Moderate" = 6–9 confirmations
* "Weak" = anything else (Sideways)
* All colors sync with background and label styles
The yellow background color in the script indicates a sideways trend — meaning:
🟨 Yellow Background = Sideways Market
This occurs when:
* The last 7 candles do not form a clear uptrend (higher highs & higher lows)
* And also do not form a clear downtrend (lower highs & lower lows)
🔍 Why It Happens:
* Mixed candle structure
* Price is oscillating in a range
* No dominant directional momentum
* Often seen before breakouts or during consolidation
✅ Example:
Imagine the last 7 candles had highs and lows like this:
Bar High Low
1 100 95
2 98 94
3 101 96
4 100 95
5 99 93
6 102 97
7 100 95
In this case:
* Not consistently making higher highs/lows (so not uptrend)
* Not consistently making lower highs/lows (so not downtrend)
➡️ Therefore, the script marks it as sideways, and the background turns yellow.
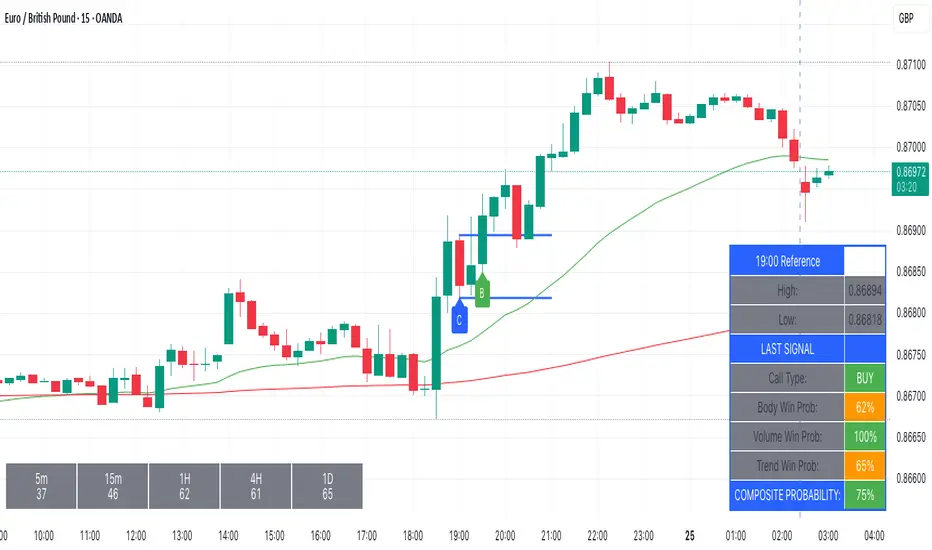
Kairos BarakahTrade with precision during high-probability windows using this advanced Pine Script indicator, designed specifically for Indian Standard Time (IST). The tool identifies key reversal opportunities within a user-defined trading session, combining time-based reference levels, sequence-validated signals, and multi-factor win probability analysis for confident decision-making.
Key Features
1. Time-Based Reference Levels
Automatically sets high/low reference levels at a customizable start time (default: 19:00 IST).
Active trading window with adjustable duration (default: 135 minutes).
Clear visual reference lines for easy tracking.
2. Intelligent Signal Generation
Initial Signals:
Buy (B): Triggered when price closes above the reference high.
Sell (S): Triggered when price closes below the reference low.
Reversal Signals (R):
Valid only after an initial signal, ensuring proper sequence.
Buy Reversal: Price closes above reference high (after a Sell signal).
Sell Reversal: Price closes below reference low (after a Buy signal).
3. Multi-Dimensional Win Probability
Body Strength: Measures candle conviction (body size / total range).
Volume Confirmation: Compares current volume to 20-period average.
Trend Alignment: Uses EMA crosses (9/21) and RSI (14) for momentum.
Composite Score: Weighted blend of all factors, color-coded for quick interpretation:
🟢 >70%: High-confidence signal.
🟠 40-69%: Moderate confidence.
🔴 <40%: Weak signal.
4. Professional Visualization
Clean labels (B/S/R) at signal points.
Real-time reference table showing levels, active signal, and probabilities.
Customizable alerts for all signal types.
Why Use This Indicator?
IST-Optimized: Tailored for Indian market hours.
Rules-Based Reversals: Avoids false signals with strict sequence checks.
Data-Driven Confidence: Win probability metrics reduce guesswork.
Flexible Setup: Adjust time windows and parameters to fit your strategy.
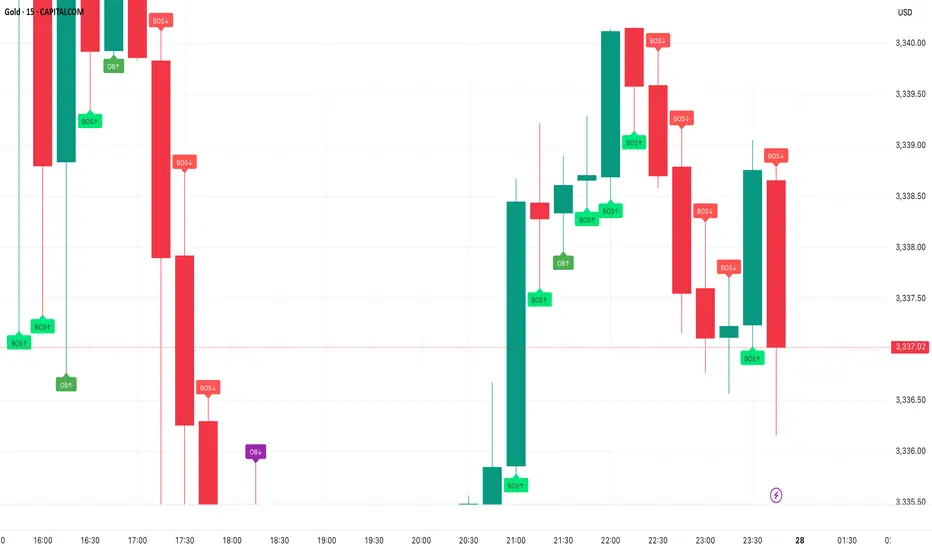
SMC Core Concepts TradingNexus (BOS, CHoCH, FVG, OB) - Stage 1🔍 SMC Core Concepts TradingNexus – Stage 1 (BOS, CHoCH, FVG, OB)
Smart Money Concepts made visual and accessible.
This indicator helps traders identify key institutional structures such as Break of Structure (BOS), Change of Character (CHoCH), Fair Value Gaps (FVG), and Order Blocks (OB) – all automatically detected and visualized on the chart.
✅ Features in Stage 1:
🔹 BOS Detection – Detects bullish and bearish structure breaks based on swing points
🔹 CHoCH Identification – Spots potential change of character after a trend
🔹 Fair Value Gap Zones – Highlights imbalances between candles
🔹 Order Block Zones – Detects key OB zones before strong price moves
🔹 Smart Auto-Cleanup – Automatically removes old boxes to optimize performance
🔹 User Inputs – Configure swing sensitivity and toggle each feature
🧠 Built for Traders Seeking Clarity
This script is ideal for SMC traders who want clear structure-based setups without drawing everything manually. Designed for both scalpers and swing traders who follow institutional logic.
🚀 Stage 2 (Coming Soon):
Liquidity zones (EQH/EQL)
Internal vs. external BOS
Mitigation blocks
Bias detection
Buy/Sell signal system
Smart SL/TP zones
Alerts system
👤 Created by TradingNexus
💬 Open-source & community-driven. Feel free to fork, contribute, or suggest improvements.

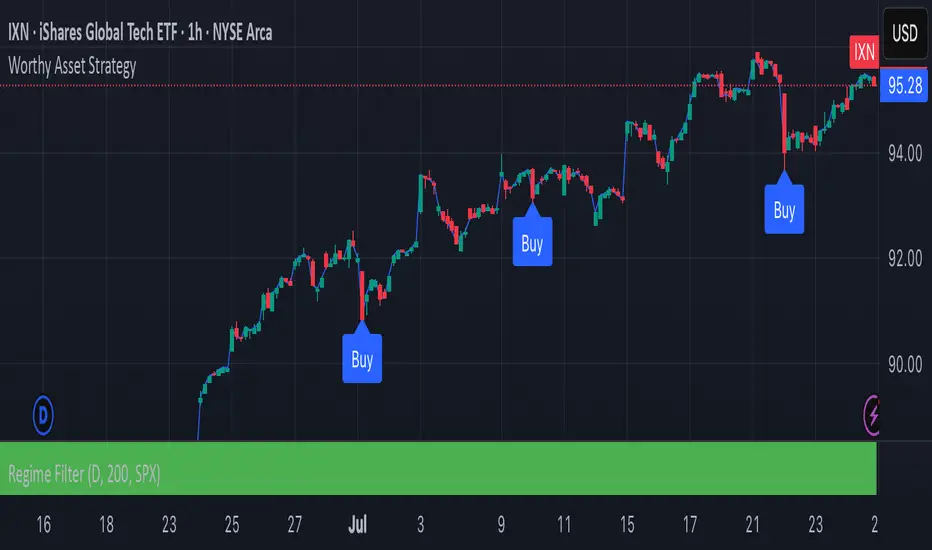
Worthy Asset StrategyThis strategy is designed with a two-part philosophy: a regime filter and a value-based accumulation approach.
🟩 Regime Filter:
If the S&P 500 (SPX) is trading above its 200-period EMA, a green background is shown below the chart, signaling a favorable market regime.
If the SPX is below the 200 EMA, the background turns red, indicating a less favorable environment.
📉 Buy Signals:
Buy signals are generated by red candles that drop a certain percentage from their open — essentially treating these pullbacks as discount opportunities.
The idea is to accumulate more of a selected asset when it becomes temporarily cheaper.
💎 Philosophy & Execution:
I only apply this strategy to assets I’ve personally researched and believe to be fundamentally valuable.
If a Buy signal occurs and the SPX is trading above its 200 EMA (i.e., the background is green), I enter the position.
Once in the trade, I follow this logic:
If the position reaches +1.5% profit, I sell it.
If it doesn’t reach profit and goes into a loss, I simply hold.
I don’t sell at a loss because I believe in the long-term value of the asset.
If the price drops further, I accumulate more — aiming to lower my average cost and eventually exit at a profit once the asset recovers.
This approach is based on the mindset of treating drawdowns as discounts, not danger.
"The more it drops, the more I accumulate — because I see value, not risk."
This is still a work in progress, and I’m actively refining it over time.
⚠️ Note: The sell logic is not yet visible on the chart and will be added in a future update.
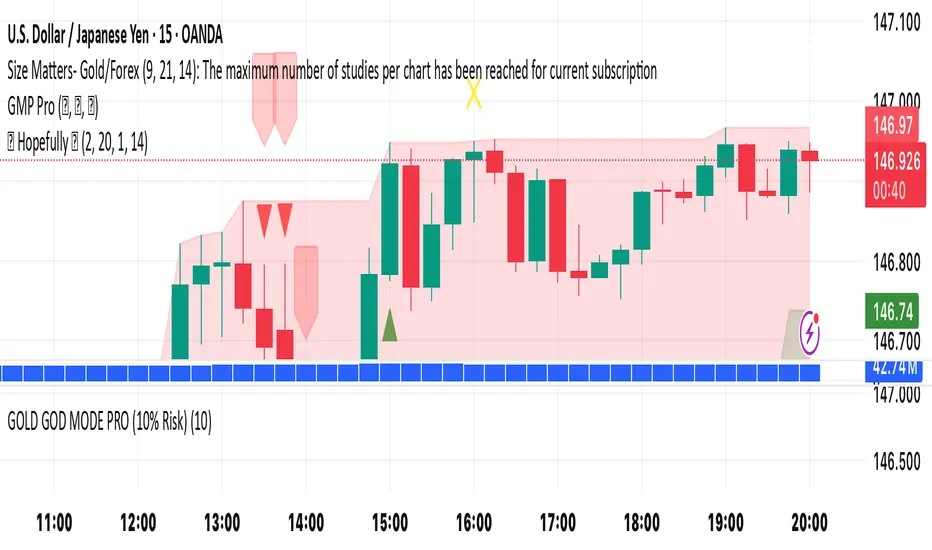
🚀 Hopefully 🤲🏻It’s a simple yet effective indicator. Its power level is high. Its secret lays in its dynamics. Simply “BUY’ when you see green triangle & "SELL" when you see red triangle 🔺. Do your own due diligence and remember to always be disciplined and focused 🧘
Happy trading to you all ☮️
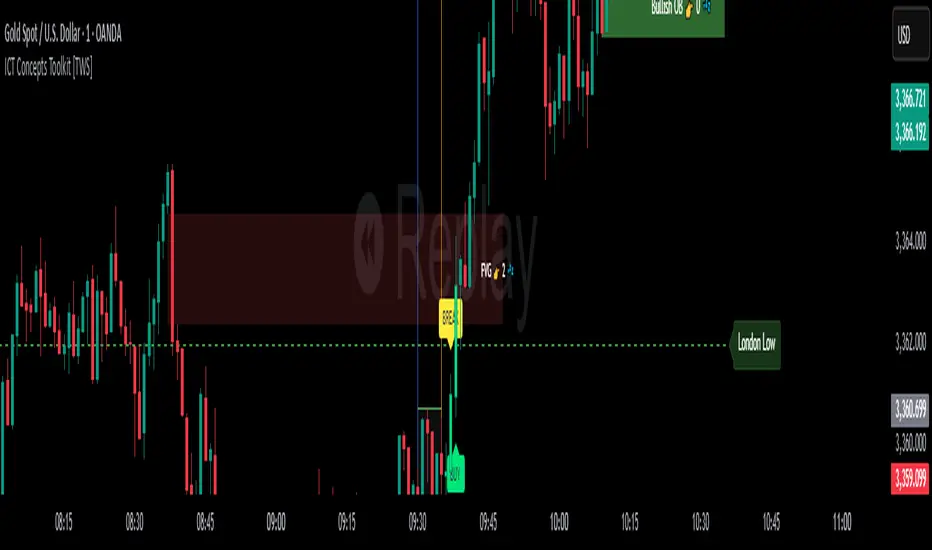
ICT Concepts Toolkit [TWS]
ICT Concepts Toolkit – by Trade With Stevie
Unlock the full power of Inner Circle Trader (ICT) concepts with this all-in-one indicator built for serious traders.
The ICT Concepts Toolkit combines the most powerful price action tools into one clean, efficient, and highly customizable interface — perfect for mastering market structure and timing precision entries.
✅ Features Included:
🟩 Order Blocks – Automatically detect key institutional levels for potential reversals and entries.
📉 Fair Value Gaps (FVGs) – Visualize imbalances in price action to spot high-probability targets and mitigation zones.
📊 Support & Resistance – Dynamically plotted levels to track market structure and trend shifts in real-time.
📅 Previous Daily Highs/Lows – Key liquidity zones marked for precision scalping and swing setups.
🕒 Session Zones – Clearly defined Asian, London, and New York sessions with customizable times and colors.
📌 Extension Lines – Extends each session’s high and low to the current candle for ongoing bias and liquidity mapping.
🚦ICT Morning Signal – Your personal directional bias assistant: smart signals showing when to Buy or Sell based on ICT’s powerful Morning Model logic.
Whether you're trading Forex, Futures, or Crypto — this toolkit gives you a cleaner chart, clearer bias, and more confidence in your setups.
💡 Created by Trade With Stevie — follow for more smart tools and signal insights.
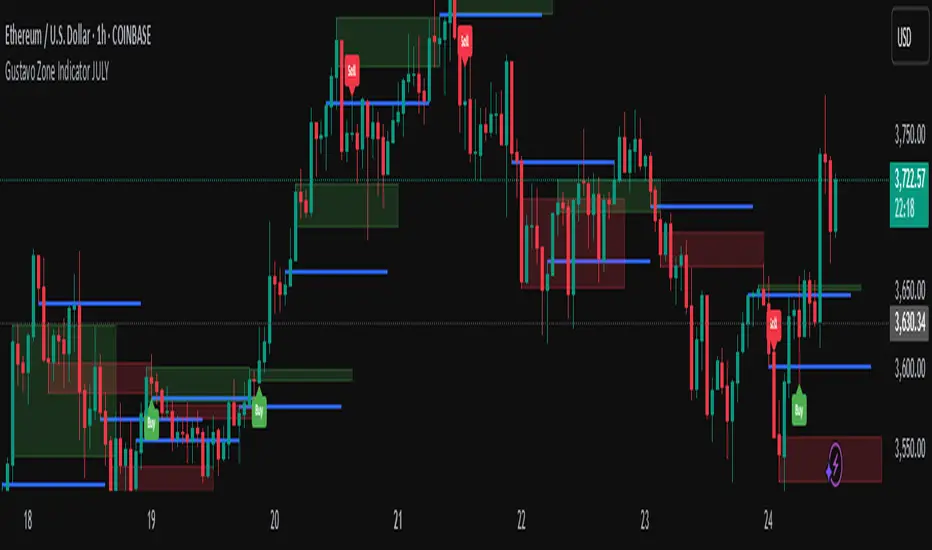
Gustavo Zone Indicator JULYThis indicator watches for runs of at least three consecutive green (or red) candles followed by an opposite-color candle, then marks that reversal zone by drawing a rectangle from the wicks of the first two run candles. It optionally plots a horizontal “target” line at the wick of the third run candle. While the zone is active, if three bars in a row close beyond both the zone boundary and the target line, it issues a customizable “Sell” label above the bar (after bullish runs) or a “Buy” label below the bar (after bearish runs). All colors, text labels, sizes, offsets, and toggles for the zones, lines, and signals can be adjusted in the input settings.
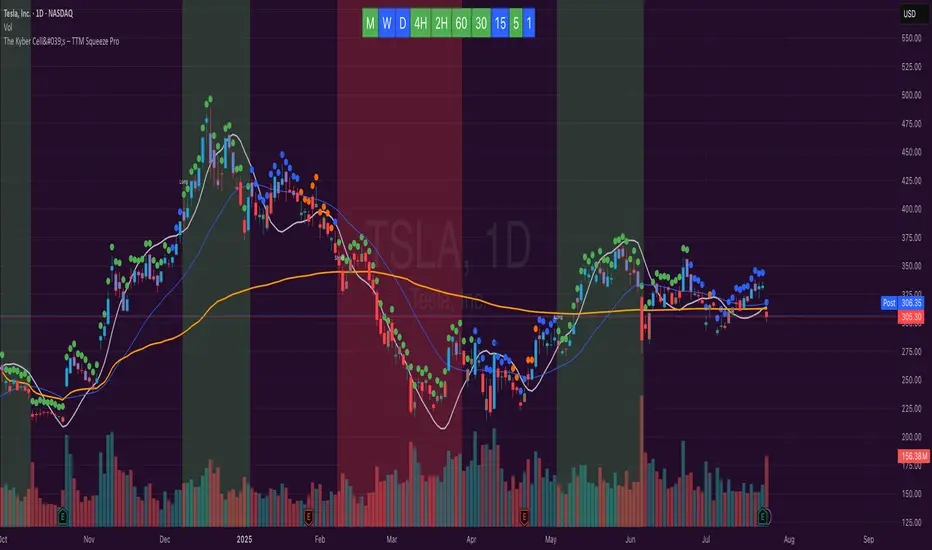
The Kyber Cell's – TTM Squeeze ProThe Kyber Cell’s TTM Squeeze Pro
TTM Squeeze + ALMA + VWAP for Precision Trade Timing
⸻
1. Introduction
Kyber Cell’s Squeeze Pro is a comprehensive, all-in-one overlay indicator built on top of John Carter’s famous TTM Squeeze concept. It integrates advanced momentum and trend analysis using Arnaud Legoux Moving Averages (ALMA), a scroll-aware VWAP with optional deviation bands, and a clean, user-friendly visual system. The goal is simple: give traders a clear and configurable chart that identifies price compression, detects release moments, confirms direction, and helps manage risk and reward visually and effectively.
This tool is intended for traders of all styles — scalpers, swing traders, or intraday strategists — looking for cleaner signals, better visual cues, and more confidence in entry/exit timing.
⸻
2. Core Concepts
At its heart, the Squeeze Pro builds an in-chart visualization of the TTM Squeeze, a strategy that identifies when price volatility compresses inside a Bollinger Band that is narrower than a Keltner Channel. These moments often precede explosive breakouts. This version categorizes squeezes into three levels of compression:
• Blue Dot – Low Compression
• Orange Dot – Medium Compression
• Red Dot – High Compression
When the squeeze “fires” (i.e., the Bollinger Bands expand beyond all Keltner thresholds), the indicator flips to a Green Dot, signaling potential entry if confirmed by trend direction.
The indicator also includes a momentum model using linear regression on smoothed price deviation to determine directional bias. Momentum is further reinforced by a customizable trend engine, allowing you to switch between EMA-21 or HMA 34/144 logic.
An ALMA ribbon is plotted across the chart to represent smoothed trend strength with minimal lag, and a scroll-aware VWAP (Volume-Weighted Average Price) line, optionally with ±σ bands, helps confirm mean-reversion or momentum continuation setups.
⸻
3. Visual Components
Squeeze Pro replaces the traditional histogram with bar coloring logic based on your selected overlay mode:
• Momentum Mode colors bars based on whether momentum is rising or falling and in which direction (aqua/blue for bullish, red/yellow for bearish).
• Trend Mode colors bars using EMA or HMA logic to identify whether price is in a bullish, bearish, or neutral trend state.
A colored backdrop is triggered when a squeeze fires and momentum direction is confirmed. It remains green for bullish runs and red for bearish runs. The background disappears when the trend exhausts or reverses.
Each squeeze level (low, medium, high) is plotted as tiny dots above or below candles, with configurable colors. On the exact bar where the squeeze fires, the indicator optionally plots entry markers — either arrows or triangles — which can be placed with adjustable padding using ATR. These provide an at-a-glance signal of possible long or short entries.
EXPERIMENTAL : For risk and reward management, protective stop lines and limit targets can be toggled on. Stops are calculated using either recent swing highs/lows or a fixed ATR multiple, depending on user preference. Limit targets are calculated from entry price using ATR-based projections.
All colors are customizable.
⸻
4. Multi-Timeframe Squeeze Panel
An optional MTF Squeeze Panel appears in the top-right corner of the chart, displaying the squeeze status across multiple timeframes — from 1-minute to Monthly. Each timeframe is color-coded:
• Red for High Compression
• Orange for Medium Compression
• Blue for Low Compression
• Yellow for Open/No Compression
This provides rapid context for whether multiple timeframes are simultaneously compressing (a common precursor to explosive moves), helping traders align higher- and lower-timeframe signals. Colors are customizable.
The MTF panel dynamically adjusts to chart space and only renders the selected intervals for clarity and performance.
⸻
5. Inputs and Configuration Options
Squeeze Pro offers a rich configuration suite:
• Squeeze Settings: Control the Bollinger Band standard deviation, and three separate Keltner Channel multipliers (for low, medium, and high compression zones).
• ALMA Controls: Adjust the smoothing length, offset, and σ factor to control ribbon sensitivity.
• VWAP Options: Toggle VWAP on/off and optionally show ±σ bands for mean reversion signals.
• Entry Markers: Customize marker shape (arrow or triangle), size (tiny to huge), color, and padding using ATR multipliers.
• Stops and Targets:
• Choose between Swing High/Low or ATR-based stop logic.
• Define separate ATR lengths and multipliers for stops and targets.
• Independently toggle their visibility and color.
• Bar Coloring Mode: Select either Momentum or Trend logic for bar overlays.
• Trend Engine: Choose between EMA-21 or HMA 34/144 for identifying trend direction.
• Squeeze Dot Colors: Customize the colors for each compression level and release state.
• MTF Panel: Toggle visibility per timeframe — from 1m to Monthly.
This high degree of customization ensures that the indicator can adapt to nearly any trading style or preference.
⸻
6. Trade Workflow Suggestions
To get the most out of this tool, traders can follow a consistent workflow:
1. Watch Dot Progression: Blue → Orange → Red indicates increasing compression and likelihood of breakout.
2. Enter on Green Dot: When the squeeze fires (green dot), confirm entry direction with bar color and backdrop.
3. Use Confirmation Tools:
• ALMA should slope in the trade direction.
• VWAP should support the price move or confirm expansion away from mean.
4. Manage Risk and Reward (experimental):
• Respect stop-loss placements (Swing/ATR).
• Use ATR-based limit targets if enabled.
5. Exit:
• Consider exiting when momentum crosses zero.
• Or exit when the background color disappears, signaling potential trend exhaustion.
⸻
7. Alerts
Includes built-in alert conditions to notify you when a squeeze fires in either direction:
• “Squeeze Long”: Triggers when a green dot appears and momentum is bullish.
• “Squeeze Short”: Triggers when a green dot appears and momentum is bearish.
You can use these alerts for automation or to stay notified of new setups even when away from the screen.
⸻
8. Disclaimer
This indicator is designed for educational purposes only and should not be interpreted as financial advice. Trading is inherently risky, and any decisions based on this tool should be made with full awareness of personal risk tolerance and capital exposure.
Call and Put signals[vivekm8955]🔍 Strategy Overview
This adaptive strategy generates clear CALL (Buy) and PUT (Sell) signals by combining:
✅ Dual EMA structure
✅ Heikin Ashi trend confirmation
✅ Smoothed Stochastic Momentum Index (SMI)
✅ Take Profit (TP) signals via momentum reversal
✅ Dynamic support from average price action
The goal: Give retail traders institutional-grade signals with clarity, without lag.
📊 Trade Entry Logic
🔼 CALL Signal (Buy):
Fast EMA < Avg Price
Slow EMA < Avg Price
Slow EMA < Fast EMA
Confirmed by crossover
➡️ This implies price has dipped below value zones and is showing strength.
🔽 PUT Signal (Sell):
Fast EMA > Avg Price
Slow EMA > Avg Price
Slow EMA > Fast EMA
Confirmed by crossover
➡️ Indicates price is elevated and showing weakness.
🏁 Exit Logic (Take Profit)
✅ TP Buy Signal: SMI crosses below 0 → Weakening upside
✅ TP Sell Signal: SMI crosses above 0 → Weakening downside
These act as exit cues or partial booking areas.
📌 Visualization & Alerts
🔼 CALL Signal → Green label below candle
🔽 PUT Signal → Red label above candle
✅ TP Signal → Small label (TP) showing ideal exit points
🔔 Real-time alerts enabled (CALL, PUT, TP alerts)
Background color changes based on EMA crossovers for added confirmation.
🕯️ Additional Filters Used
Heikin Ashi Candles: For smoothing out noise and validating trends.
SMI (Double EMA): A momentum indicator better suited for trending markets.
📈 Dashboard Included
Displays current signal, SMI value, and TP status in real-time
Color-coded for easy interpretation
Auto-adaptive table (fixes out-of-bound issues)
📎 Ideal Timeframes
Timeframe Use Case
5m – 15m Intraday Scalping
1h – 4h Swing Trading
1D Positional Plays
🚦 Suggested Usage
Step Action
1️⃣ Confirm signal (CALL or PUT) on 1TF and 1 higher TF
2️⃣ Enter near signal candle close
3️⃣ Exit on TP label OR SMI reversal
4️⃣ Avoid entry during high volatility news events
⚠️ Disclaimer – Use with Caution!
⚠️ This script is for educational & analytical purposes only.
It does NOT guarantee profits, nor is it a financial advisory tool.
Always use risk management: Stop-losses, position sizing, capital preservation.
Do not trade blindly. Backtest it across market conditions.
Past performance is not indicative of future results.
Consult a SEBI-registered advisor for real trading decisions.

Price discovery indicatorGives an ability to show places where price drops more than n percent in x candles. Use cases: see dips of btc, get a notification when a stablecoin goes crazy, validate that webhook integration works as expected using keep alive messages.
Features included:
- Price dip alerts. Create an alert that sends a notification every time price dips more than expected (yellow zone at the chart).
- Percentage drop threshold. Define how many percents price should drop to trigger an alert and to show a yellow zone.
- Candles length threshold. Define within how many candles this drop should happen. If price drops in 2% within 10 candles, but this option is 5 - the alert will not be triggered because price dropped not as fast as expected.
- Templates of messages on price dip and price recovery. Set your message that should be triggered with alert.
- Keep alive feature. Set to trigger keep alive alerts every period. Can be helpful if you don't check charts often - this feature will trigger alert every period with "hey, the integration is alive" message. I use it to validate on weekly basis that tradingview triggers my alerts (example: you created an alert with expiration date and forgot to recreate it), that webhook integration receives these alerts, that the integration sends these alerts to telegram. Example: I expect to see this message every monday's morning, otherwise something is broken and I have to check what is wrong with my alerting system.

Impulse Alert - Demand (Buy) [Fixed]🔵 Impulse Alert – Demand (Buy)
This indicator is designed to detect high-probability Demand Zones based on impulsive bullish price action, helping traders get alerted only when it matters most.
🧠 Core Logic:
Scans the chart for 2 consecutive bullish impulsive candles with significant range (body size)
Also captures single large bullish impulse candles that often mark institutional buying
Marks the origin of the move as a potential Demand Zone
Sends alerts when such bullish setups form, allowing you to monitor charts passively
⚙️ Features:
✅ Alerts on impulsive move formations
✅ Detects both 2-candle and single-candle impulses
✅ Custom zone detection logic based on pip size and momentum
✅ Cleaner & smarter: removes distractions and avoids false signals
📌 Best Used For:
Smart Money / Supply & Demand traders
Identifying potential institutional buy zones
Executing trades with HTF confluence
Traders who want to get alerted without screen-watching
🔁 Suggested Strategy:
Set HTF directional bias (H1, H4, D1)
Use this indicator on LTF (1M–15M) for impulsive bullish entries
Wait for price to return to the marked zone for low-risk entries
💡 Pro Tip: Combine with your Supply Zone (Sell) indicator to track both sides of market structure and increase R:R
👤 Created by: Rohit Jadhav | YT/Insta/X - @GrowthByTrading
📬 Want updates, enhancements, or personal versions? Leave feedback or reach out through profile!
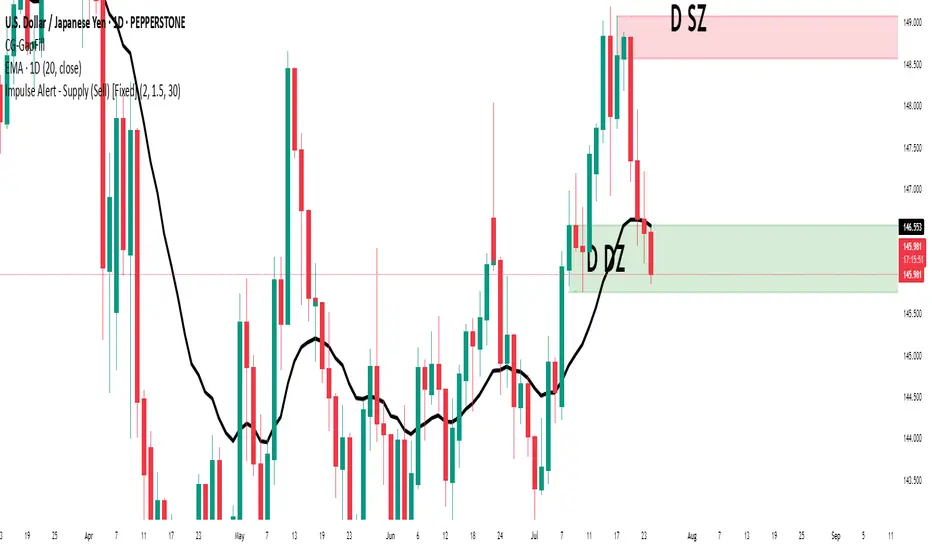
Impulse Alert - Supply (Sell) [Fixed]🟥 Supply Zone (Sell) – Institutional Order Block Detector
This custom indicator automatically detects valid Supply Zones (Sell Zones) based on Smart Money Concepts and institutional trading behavior.
🔍 How It Works:
Identifies strong bearish impulsive moves after price forms a potential Order Block
Valid supply zones are plotted after:
A valid rally–base–drop or drop–base–drop structure
A shift in structure or clear imbalance is detected
The zone is created from the last bullish candle before a strong bearish engulfing move
Zones remain on chart until price revisits and reacts
📊 Use Case:
Ideal for traders using Smart Money Concepts (SMC), Supply & Demand, or ICT-inspired strategies
Perfect for scalping, day trading, or swing setups
Designed for confluence with HTF bias and LTF execution
⚙️ Features:
Supply Zone auto-plotting
Customizable zone color and opacity
Alerts when price returns to the zone (retest entry opportunity)
🧠 Tip for Best Use:
Use in confluence with:
HTF Supply zones (manual or other indicator)
Market Structure breaks
Fair Value Gaps or Imbalance zones
Strong impulsive moves from HTF to LTF
🔁 Future Additions (Coming Soon):
Demand Zone detection
Zone strength rating system
Refined zone filters (volume, candle size, etc.)
Alerts for mitigation or invalidation
📌 Created by: Rohit Jadhav | Real-time market trader | YT/Insta - @GrowthByTrading
💬 Feedback? Drop a comment or connect via profile for updates and tutorials!