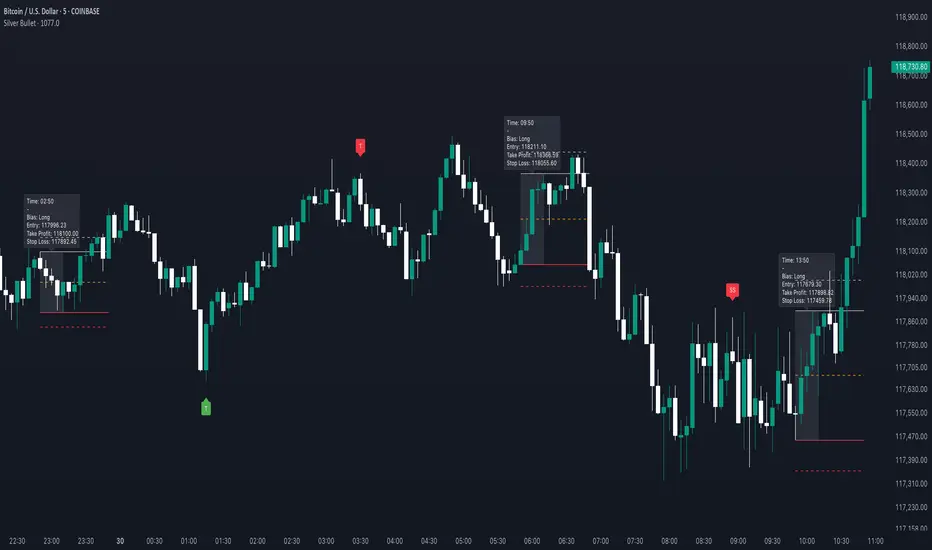
Silver BulletSilver Bullet is a trading tool built for finding cleaner, higher-probability setups. It focuses on key windows of market movement and adds helpful tools like daily range levels and candlestick patterns.
Whether you’re trading breakouts or reversals, Silver Bullet gives you a clearer view of the market and more confidence in your setups.
⸻
🔹 Trading Setup #1: Macro Time
The Macro Time setting offers two modes: Macro Bullet and Silver Bullet. Both help traders focus on specific times when the market tends to deliver clean moves.
• Macro Bullet is based on the high and low of a full macro session. It automatically detects the session’s range and bias, then offers optimal entries for either Long or Short setups. Once the session resolves, it provides Fibonacci-based levels for entry, target, and stop loss.
• Silver Bullet is based on ICT concepts and focuses on the hourly range for London, NY AM, and NY PM sessions. It’s designed for quick time blocks and highlights key levels as the session unfolds.
To use this setup, set Macro Time to “ICT Sessions” and select your preferred mode under Bullet Mode.
⸻
🔹 Trading Setup #2: Daily Range
Enable Daily Range to draw Fibonacci levels based on either the previous day’s candle or the current day’s developing range. These levels help you identify potential support, resistance, and midpoint zones throughout the day.
With the current day’s range, levels automatically update in real time as new highs or lows form — keeping your chart aligned with evolving price action.
⸻
🔹 Trading Setup #3: Candlestick Patterns
Turn on Candlestick Patterns to automatically highlight clean reversal signals such as Hammers, Hanging Men, Shooting Stars, and Tweezers. Each pattern is detected using specific criteria and trend filters to reduce noise and improve reliability. They work especially well as confirmation signals around key levels or session zones.
Silver Bullet brings structure, clarity, and precision to your intraday trading. By combining time-based bias, price action levels, and pattern recognition, it helps you trade with purpose — not guesswork. Use one setup or combine all three for a complete view of the market, tailored to your style and session of choice.
Candlestickpattern
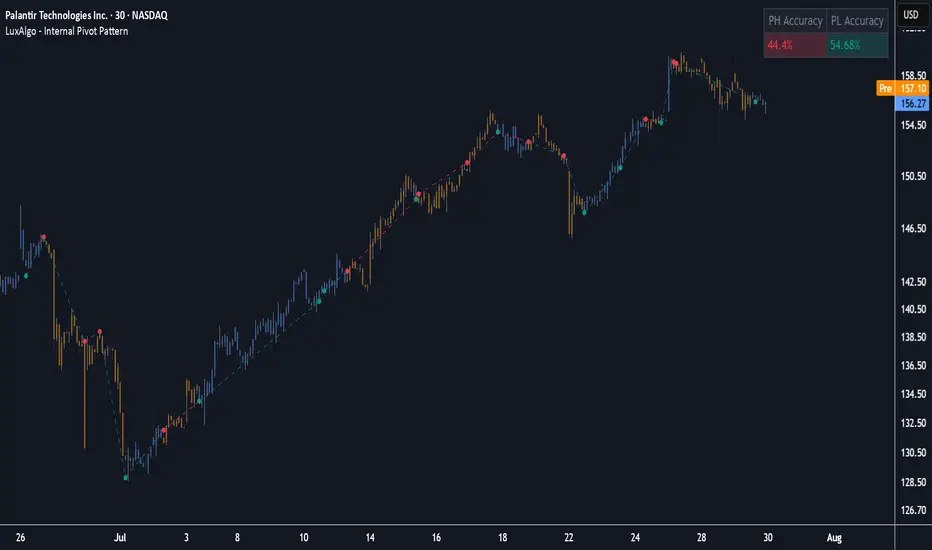
Internal Pivot Pattern [LuxAlgo]The Internal Pivot Pattern indicator is a novel method allowing traders to detect pivots without excessive delay on the chart timeframe, by using the lower timeframe data from a candle.
It features custom colors for candles and zigzag lines to help identify trends. A dashboard showing the accuracy of the pattern is also included.
🔶 USAGE
We define a pivot as the occurrence where the middle candle over a specific interval (for example, the most recent 21 bars) is the highest (pivot high) or the lowest (pivot low). This method commonly allows for identifying swing highs/lows on a trader's chart; however, this pattern can only be identified after a specific number of bars has been formed, rendering this pattern useless for real-time detection of swing highs/lows.
This indicator uses a different approach, removing the need to wait for candles to form on the user chart; instead, we check the lower timeframe data of the current candle and evaluate for the presence of a pivot given the internal data, effectively providing pivot confirmation at the candle close.
An internal pivot low pattern is indicative of a potential uptrend, while an internal pivot high is indicative of a potential downtrend.
Candles are colored based on the last internal pivot detected, with blue candle colors indicating that the most recent internal pivot is a pivot low, indicating an uptrend, while an orange candle color indicates that the most recent internal pivot is a pivot high, indicating a downtrend.
🔹 Timeframes
The timeframe setting allows controlling the amount of lower timeframe data to consider for the internal pivot detection. This setting must be lower than the user's chart timeframe.
Using a timeframe significantly lower than the user chart timeframe will evaluate a larger amount of data for the pivot detection, making it less frequent, while using a timeframe closer to the chart timeframe can make the internal pivot detection more frequent, and more prone to false positives.
🔹 Accuracy Dashboard
The Accuracy Dashboard allows evaluating how accurate the detected patterns are as a percentage, with a pattern being judged accurate if subsequent patterns are detected higher or lower than a previous one.
For example, an internal pivot low is judged accurate if the following internal pivot is higher than it, indicating that higher highs have been made.
This dashboard can be useful to determine the timeframe setting to maximize the respective internal pivot accuracy.
🔶 SETTINGS
Timeframe: Timeframe for detecting internal swings
Accuracy Dashboard: Enable or disable the Accuracy Dashboard.
🔹 Style
Internal Pivot High: Color of the dot displayed upon the detection of an internal pivot high
Internal Pivot Low: Color of the dot displayed upon the detection of an internal pivot low
Zig-Zag: Color of the zig-zag segments connecting each internal pivot
Candles: Enable candle coloring, with control over the color of the candles highlighting the detected trend
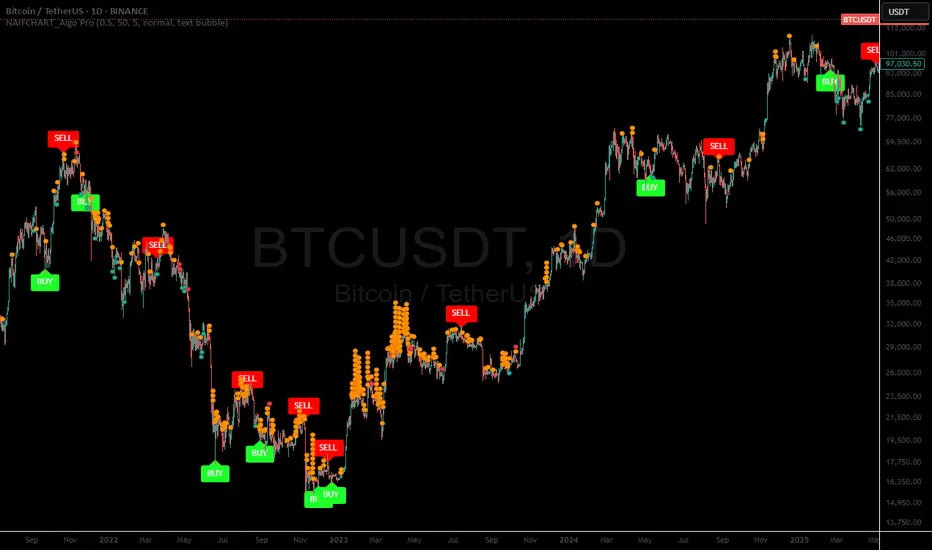
NAIFCHART_Algo Pro# NAIFCHART Algo Pro: Advanced Candlestick Pattern Analysis Tool
## Overview
The NAIFCHART Algo Pro indicator represents an innovative approach to candlestick pattern analysis, combining traditional engulfing patterns with advanced technical filters. This indicator was developed and shared by the trading community at t.me focusing on high-probability reversal signals through multi-layered confirmation.
## Core Algorithm Components
**Candle Stability Index**: Measures the ratio between candle body and total range (including wicks). Higher values indicate more decisive price action with stronger conviction. Default setting of 0.5 ensures only stable, well-formed candles generate signals, filtering out indecisive market conditions.
**RSI Momentum Filter**: Utilizes 14-period RSI with customizable threshold (default 50) to confirm overbought/oversold conditions. Buy signals require RSI below the threshold, while sell signals need RSI above the inverse threshold, ensuring momentum alignment with pattern direction.
**Candle Delta Analysis**: Examines price movement over a specified period (default 5 candles) to confirm directional bias. This filter ensures patterns occur after meaningful price moves in the opposite direction, increasing reversal probability.
**Engulfing Pattern Recognition**: Identifies classic bullish and bearish engulfing formations where the current candle completely engulfs the previous candle's body, indicating potential momentum shift.
## Signal Generation Logic
**Buy Signal Criteria**:
- Bullish engulfing pattern formation
- Candle stability above threshold level
- RSI below specified threshold (oversold condition)
- Price decrease over the delta length period
- Confirmed bar state (prevents repainting)
**Sell Signal Criteria**:
- Bearish engulfing pattern formation
- Candle stability above threshold level
- RSI above inverse threshold (overbought condition)
- Price increase over the delta length period
- Confirmed bar state (prevents repainting)
## Advanced Features
**Signal Filtering**: Optional "Disable Repeating Signals" feature prevents signal clusters by blocking consecutive identical signals. This enhances chart clarity and reduces noise in trending markets where multiple patterns might form in sequence.
**Visual Customization**: Multiple label styles including text bubbles, triangles, and arrows with full color customization. Label sizes range from tiny to huge, allowing adaptation to different chart configurations and personal preferences.
**Alert Integration**: Built-in alert system notifies traders immediately when buy or sell conditions are met, enabling real-time trade execution without constant chart monitoring.
## Implementation Strategy
**Timeframe Optimization**: The indicator performs effectively across multiple timeframes, with higher timeframes (1-hour and above) providing more reliable signals due to reduced market noise. Shorter timeframes require more conservative position sizing due to increased false signal probability.
**Parameter Tuning**:
- Increase Candle Stability Index for more selective signals in volatile markets
- Adjust RSI threshold based on market conditions (lower for trending markets, higher for ranging conditions)
- Modify Candle Delta Length for different trend confirmation periods
**Risk Management**: Combine signals with proper stop loss placement below/above the engulfing pattern's extreme points. Consider position sizing based on pattern strength and overall market context.
## Market Application
**Reversal Trading**: Primary application focuses on identifying high-probability reversal points after extended moves. The multi-filter approach significantly reduces false signals compared to basic engulfing pattern strategies.
**Trend Confirmation**: In trending markets, signals align with pullback completion, providing optimal entry points for trend continuation strategies. The RSI and delta filters help identify temporary retracements rather than trend changes.
**Range Trading**: Within sideways markets, signals often occur near range boundaries, providing effective support and resistance bounce opportunities with clearly defined risk parameters.
## Performance Optimization
**Market Selection**: The indicator performs best on liquid instruments with clear candlestick formations. Avoid extremely volatile or thin markets where patterns may be less reliable.
**Session Timing**: Consider trading sessions when focusing on specific markets. Major session overlaps often provide clearer patterns due to increased participation and volume.
**Confirmation Techniques**: While the indicator provides internal filtering, additional confirmation through volume analysis, key support/resistance levels, or broader market context enhances signal reliability.
## Community Resources
Access ongoing strategy discussions and optimization techniques through the source community at t.me where traders share practical applications and parameter adjustments for different market conditions.
The collaborative environment provides valuable insights into optimal settings for various trading styles and market environments, along with real-time feedback on signal quality and performance.
## Conclusion
NAIFCHART Algo Pro offers a sophisticated approach to candlestick pattern trading through intelligent filtering and confirmation mechanisms. The indicator's strength lies in combining traditional pattern recognition with modern technical analysis filters, creating a robust framework for identifying high-probability reversal opportunities.
Success with this tool requires understanding each component's role in signal generation and adapting parameters to match current market conditions and personal trading style. The community-driven development ensures practical relevance and ongoing refinement based on real trading experiences.
Practice with demo accounts to develop familiarity with signal timing and optimal parameter settings before live implementation. The indicator's systematic approach provides clear entry signals while maintaining flexibility for different risk management and position sizing strategies.
Engulfing DashboardThis is an indicator that detects candles based on the **Engulfing system** I’ve studied — from **wick to wick**.
It determines whether it’s a Buy or Sell based on the **opening price** and how the candle moves.
Anyone familiar with the Engulfing system will know how to use it.
It’s especially useful for people who use only **one screen** and can’t constantly monitor multiple timeframes.
And don’t forget:
**Trend is your friend.**

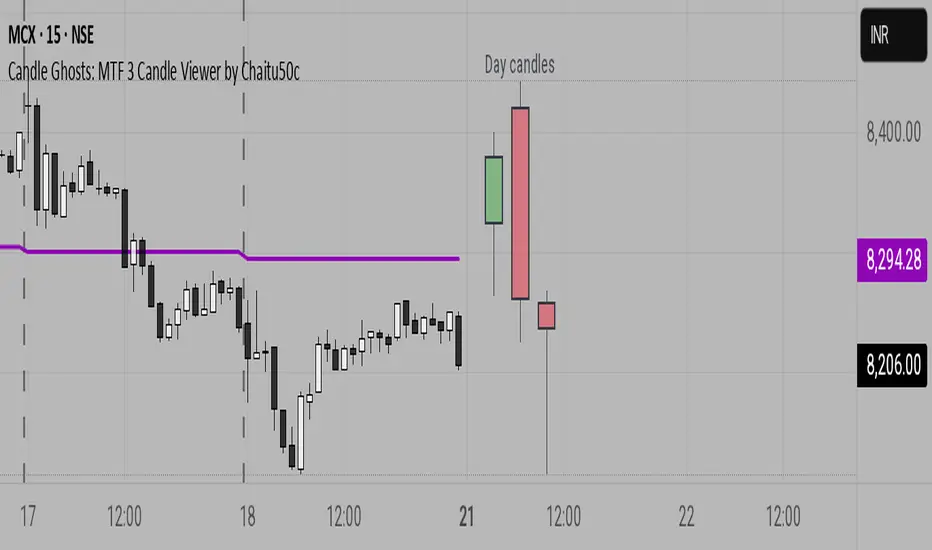
Candle Ghosts: MTF 3 Candle Viewer by Chaitu50cCandle Ghosts: MTF 3 Candle Viewer helps you see candles from other timeframes directly on your chart. It shows the last 3 candles from a selected timeframe as semi-transparent boxes, so you can compare different timeframes without switching charts.
You can choose to view candles from 30-minute, 1-hour, 4-hour, daily, or weekly timeframes. The candles are drawn with their full open, high, low, and close values, including the wicks, so you get a clear view of their actual shape and size.
The indicator lets you adjust the position of the candles using horizontal and vertical offset settings. You can also control the spacing between the candles for better visibility.
An optional EMA (Exponential Moving Average) from the selected timeframe is also included to help you understand the overall trend direction.
This tool is useful for:
Intraday traders who want to see higher timeframe candles for better decisions
Swing traders checking lower timeframe setups
Anyone doing top-down analysis using multiple timeframes on a single chart
This is a simple and visual way to study how candles from different timeframes behave together in one place.
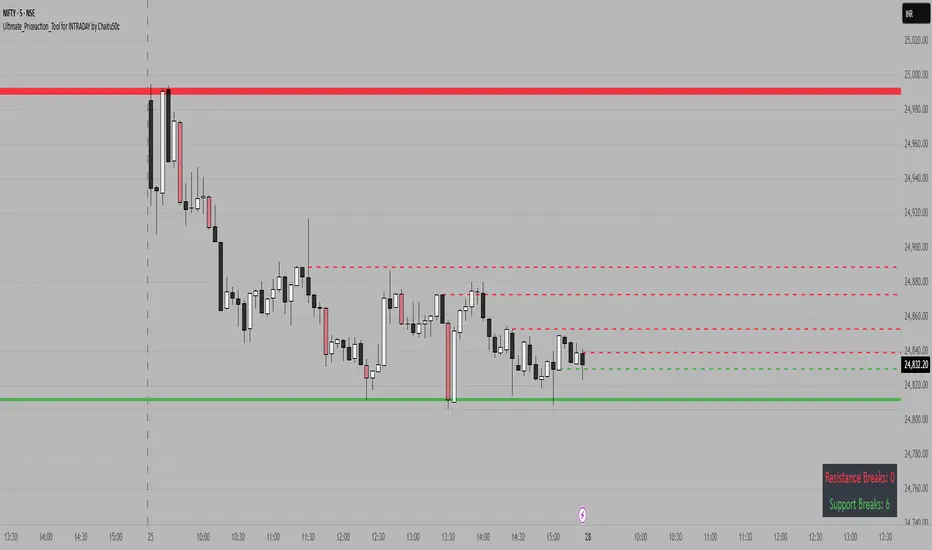
Ultimate_Priceaction_Tool for INTRADAY by Chaitu50cUltimate_Priceaction_Tool for INTRADAY by Chaitu50c
This indicator is crafted for intraday traders who rely on raw price action. It identifies support and resistance zones based on engulfing candle structures and 2-bar breakout formations. These patterns often signal meaningful reversals or momentum-based breakouts.
Key features:
• Real-time support and resistance zone detection
Uses green-to-red and red-to-green candle transitions where open and close levels align within a defined buffer. Also includes logic to capture two-bar breakout patterns that confirm directional conviction.
• Dynamic line behavior
Line width increases as the level holds for more bars, visually representing zone strength. Breakout buffers also expand with time to reduce false signals.
• Session-based resets
At the start of each new session, all zones reset automatically. This ensures only current, relevant intraday structures are shown, reducing clutter and improving focus.
• Dashed zone detection
Within the main high-low range, additional price levels are plotted as dashed lines when qualifying patterns appear. These zones are suppressed if similar ones already exist nearby.
• Fully customizable
Includes adjustable buffer range, breakout margin, dash suppression distance, line width control, and visual styling for both resistance and support zones.
Recommended usage:
This tool is optimized for the 1-minute and 5-minute timeframes. It is best suited for scalpers and intraday traders who depend on breakout reactions, pullback validation, and session structure shifts.
Use it to identify areas of interest, react to price action, and refine intraday decision-making with high precision.
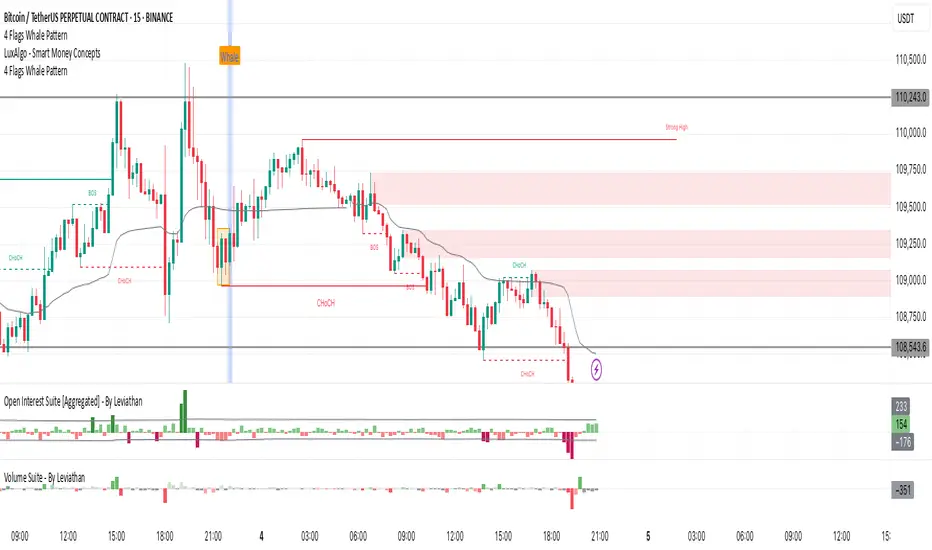
4 Flags Whale PatternThis indicator detects a unique 4-bar candlestick pattern characterized by alternating bullish and bearish candles (or vice versa), where all four candles have similar body sizes within a specified tolerance.
Usage:
This pattern may indicate a consolidation phase or a potential breakout zone after indecisive price action. Traders can use it to anticipate a directional move following the "tug-of-war" between buyers and sellers.
FVG Trailing Stop [LuxAlgo]The FVG Trailing Stop indicator tracks unmitigated Fair Value Gaps (FVG) data to produce a Trailing Stop indicator able to determine if the market is uptrending or downtrending easily.
🔶 USAGE
The FVG Trailing Stop is intended to identify trend directions through its position relative to the closing price:
Bullish: Price is located above the Trailing Stop, indicating that all Bearish FVGs have been mitigated and the trend is anticipated to continue upwards.
Bearish State: Price is located below the Trailing Stop, indicating that all Bullish FVGs have been mitigated and the trend is anticipated to continue downwards.
The Trailing Stop originates from two extremities obtained from the average of respective unmitigated FVGs. The specific directional average is also displayed as a more transparent secondary line, however, the trailing stop is derived from this value and a new trend will not be detected until the opposite directional average is crossed.
Price reaching the Trailing Stop is caused by retracements and can lead to the following scenarios:
Outcome 1: The directional average is crossed next, indicating a new trend direction.
Outcome 2: The directional average is held as support or resistance, leading to a new impulse and a continuation of the trend.
🔹 Reset on Cross
While price crossing the Trailing Stop should be considered as a sign of an upcoming trend change; it is possible for the price to still evolve outside it.
As a solution, we have included the "Reset on Cross" feature, which (as the name suggests) hides and resets the Trailing Stop each time it is crossed, leading to a "Neutral" state.
This opens the opportunity for the Trailing Stop to be displayed again once the price moves again in the direction of the pre-established trend. A trader might use this to accumulate positions within a specific trend.
🔶 DETAILS
The script uses a typical identification method for FVGs. Once identified, the script collects the point of the FVG farthest from the current price when formed.
For Upwards FVGs this is the bottom of the FVG.
For Downwards FVGs this is the top of the FVG.
The data is managed only to use the last input lookback of FVGs. If an FVG is mitigated, it frees up a spot in the memory for a new FVG, however, if the lookback is full, the oldest will be deleted.
From there, it uses a "trailing" logic only to move the Trailing Stop in one direction until the trailing stop resets or the direction flips.
The extremities used to calculate the Trailing Stop are created from 2 calculation steps, the first step involves taking the raw average of the FVG mitigation levels, and the second step applies a simple moving average (SMA) smoothing of the precedent-obtained averages.
🔶 SETTINGS
Unmitigated FVG Lookback: Sets the maximum number of Unmitigated FVGs that the script will use.
Smoothing Length: Sets the smoothing length for the Trailing Stop to reduce erratic results.
Reset on Cross: When enabled, hide and reset the Trailing Stop until the price starts moving in the pre-established trend direction again.

HTF Candle Breakout Fibonacci LevelsThis indicator automatically plots Fibonacci retracement levels on a lower timeframe (LTF) after detecting a breakout candle on a selected higher timeframe (HTF).
🔍 How It Works
When a candle on your selected HTF closes beyond the high or low of the previous candle, the indicator automatically draws Fibonacci levels on the LTF.
These levels remain visible until the next HTF candle is formed — allowing you to trade retracements with contextual precision.
⸻
⚙️ Customization Options
From the indicator settings, you can modify:
• The HTF candle timeframe (default is 1D)
• Fibonacci levels and colors
• Enable or disable “Show Only the Latest Levels” — ideal for live trading to keep the chart clean and focused.
⸻
🟪 HTF Candles Preview
After applying the indicator, you’ll see 3 vertical bars on the right edge of your LTF chart. These represent a live preview of the last three HTF candles and update in real-time.
If you prefer a cleaner chart, disable this feature via the “Show HTF Candles” toggle in the settings.
⸻
Feel free to reach out if you have any questions.

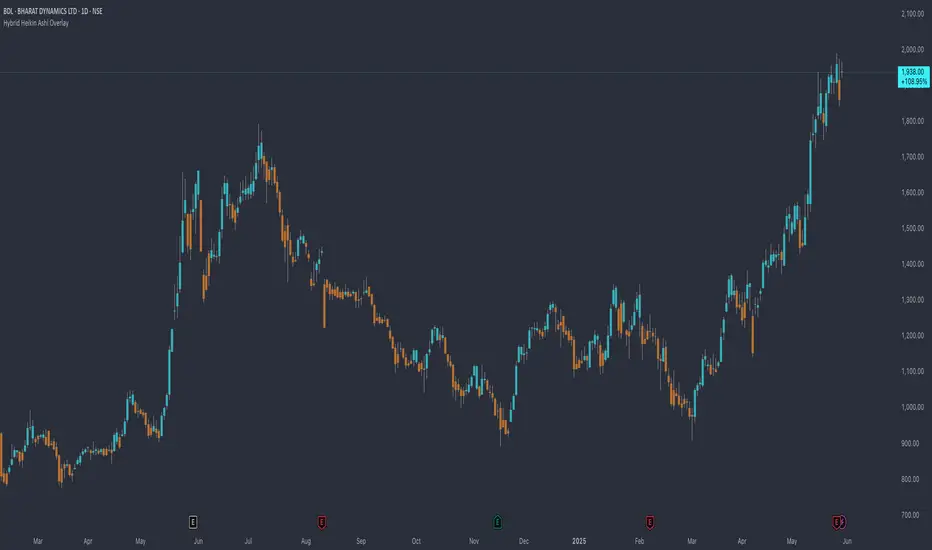
Hybrid Heikin Ashi OverlayHybrid Heikin Ashi Overlay
I personally like Heikin Ashi for its simplicity in showing clean trends. However, it tends to smooth out price action so much that we sometimes miss key signals from the actual candles.
This indicator overlays Heikin Ashi-style background colors while keeping regular candles intact — giving you the best of both worlds:
• Smoother trend visibility
• No loss of execution precision
• Customizable colors & transparency
🔹 No repainting
🔹 No strategy logic — purely visual
🔹 Designed to reduce clutter and help traders stay focused on structure
Created by: @yug_and_her
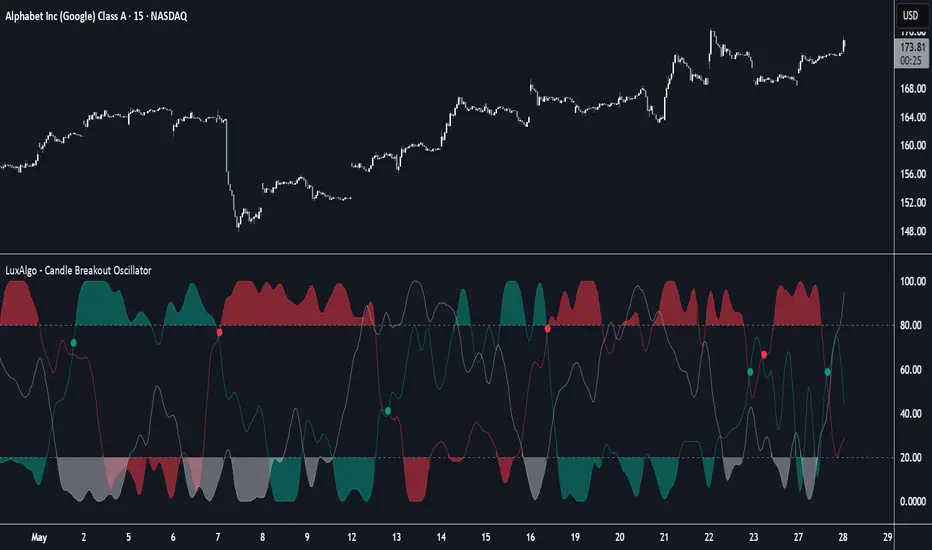
Candle Breakout Oscillator [LuxAlgo]The Candle Breakout Oscillator tool allows traders to identify the strength and weakness of the three main market states: bullish, bearish, and choppy.
Know who controls the market at any given moment with an oscillator display with values ranging from 0 to 100 for the three main plots and upper and lower thresholds of 80 and 20 by default.
🔶 USAGE
The Candle Breakout Oscillator represents the three main market states, with values ranging from 0 to 100. By default, the upper and lower thresholds are set at 80 and 20, and when a value exceeds these thresholds, a colored area is displayed for the trader's convenience.
This tool is based on pure price action breakouts. In this context, we understand a breakout as a close above the last candle's high or low, which is representative of market strength. All other close positions in relation to the last candle's limits are considered weakness.
So, when the bullish plot (in green) is at the top of the oscillator (values above 80), it means that the bullish breakouts (close below the last candle low) are at their maximum value over the calculation window, indicating an uptrend. The same interpretation can be made for the bearish plot (in red), indicating a downtrend when high.
On the other hand, weakness is indicated when values are below the lower threshold (20), indicating that breakouts are at their minimum over the last 100 candles. Below are some examples of the possible main interpretations:
There are three main things to look for in this oscillator:
Value reaches extreme
Value leaves extreme
Bullish/Bearish crossovers
As we can see on the chart, before the first crossover happens the bears come out of strength (top) and the bulls come out of weakness (bottom), then after the crossover the bulls reach strength (top) and the bears weakness (bottom), this process is repeated in reverse for the second crossover.
The other main feature of the oscillator is its ability to identify periods of sideways trends when the sideways values have upper readings above 80, and trending behavior when the sideways values have lower readings below 20. As we just saw in the case of bullish vs. bearish, sideways values signal a change in behavior when reaching or leaving the extremes of the oscillator.
🔶 DETAILS
🔹 Data Smoothing
The tool offers up to 10 different smoothing methods. In the chart above, we can see the raw data (smoothing: None) and the RMA, TEMA, or Hull moving averages.
🔹 Data Weighting
Users can add different weighting methods to the data. As we can see in the image above, users can choose between None, Volume, or Price (as in Price Delta for each breakout).
🔶 SETTINGS
Window: Execution window, 100 candles by default
🔹 Data
Smoothing Method: Choose between none or ten moving averages
Smoothing Length: Length for the moving average
Weighting Method: Choose between None, Volume, or Price
🔹 Thresholds
Top: 80 by default
Bottom: 20 by default
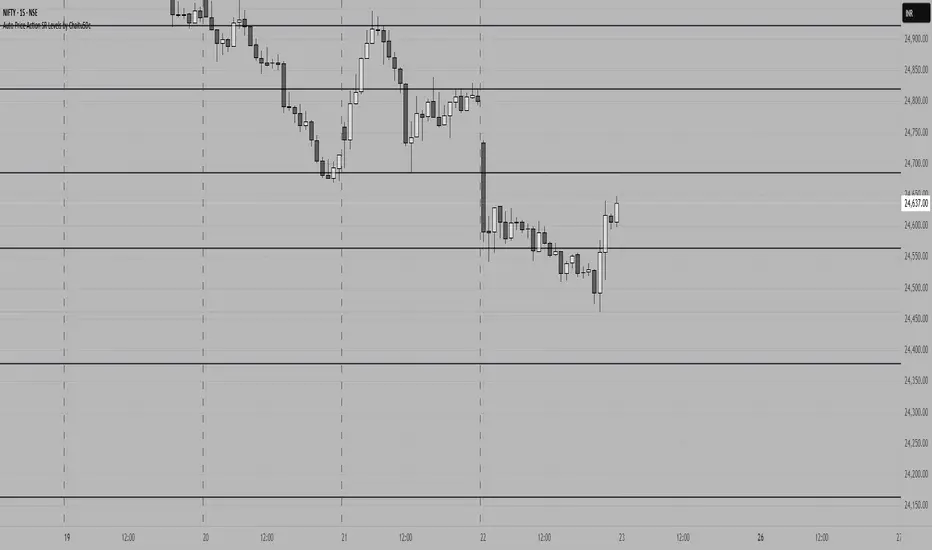
Auto Price Action SR Levels by Chaitu50cAuto Price Action SR Levels by Chaitu50c:
This is a session-based support and resistance indicator that identifies price levels based on actual candle activity, without relying on traditional indicators. It works by clustering open, high, low, or close values of past candles that frequently occur within a defined price range, making it a reliable price action-based tool for intraday traders.
The indicator calculates these levels at the start of each new trading session (based on NSE 09:15 time) and keeps them static throughout the session. This avoids unnecessary noise or flickering due to live price action, giving traders consistent zones to work with during the day.
FEATURES:
* Automatic detection of support and resistance levels based on candle price hits
* Cluster formation using high/low or open/close logic
* Static levels: calculated once per session and remain unchanged until the next session
* Adjustable settings for:
* Cluster range (in points)
* Number of lookback candles
* Line width
* Line color (default: black)
* Minimalist design for a clean chart experience
HOW IT WORKS:
The indicator looks back over a defined number of candles at the beginning of each session. It clusters prices that fall within a specified range (e.g., 250 points) and counts how many times they appear as open, high, low, or close values. If a price level is hit at least once (default), it is considered significant and a line is plotted.
Because clustering is done once per session, the lines do not shift during the session. This allows traders to base decisions on fixed, stable levels formed by prior market structure.
RECOMMENDED FOR:
* Intraday traders
* Price action traders
* Traders who prefer clean charts with logical SR zones
* Nifty, BankNifty, and stock-based day trading
Created by Chaitu50c for traders who rely on logic and structure, not signals.
Disclaimer:
This indicator is intended for educational and informational purposes only. It does not constitute financial advice or trading recommendations. Use at your own discretion and always manage risk responsibly.
---
Let me know if you’d like to include use-case examples or screenshots before publishing.
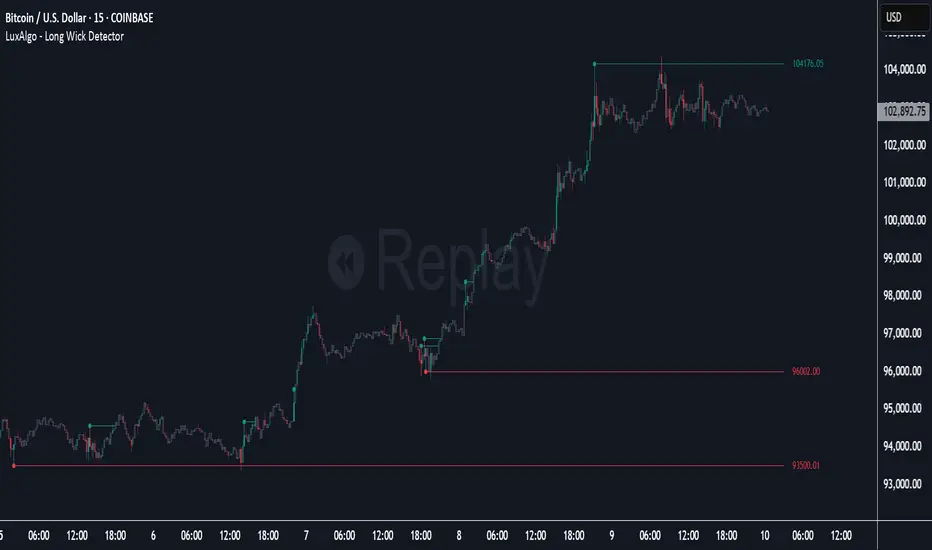
Long Wick Detector [LuxAlgo]The Long Wick Detector tool allows traders to identify candle wicks longer than a user-defined volatility threshold. This makes it useful for spotting zones with high supply or demand.
The tool displays mitigated and unmitigated levels and changes the color of the candles based on wick size and level breakouts.
🔶 USAGE
By default, the tool displays long mitigated and unmitigated candle wicks, with a maximum duration for an unmitigated long wick of 1,000 bars. What does all this mean?
🔹 Wick Threshold
Traders can adjust the volatility threshold to identify long wicks, with a higher threshold detecting more significant wicks.
As we can see in the image above, the tool detects more wicks with a smaller threshold compared to a higher one.
🔹 Level %
Traders can choose the percentage of the wick at which the level is located. By default, the level is displayed at the extremes of the wick. This parameter accepts values between 0 and 100.
100: extreme of the wick
50: middle of the wick
0: start of the wick
🔹 Max Duration
This parameter allows traders to specify the number of bars for the levels. The tool will only display mitigated or unmitigated levels up to the specified number of bars.
As shown in the above image, a longer duration allows more room for mitigation, displaying more levels.
🔹 Colored Candles
The tool allows for color customization using two parameters from the settings panel. The chart shows the different outputs.
The setting "Wick-Based Transparency" makes candles with smaller wicks less visible and candles with longer wicks more visible.
On the other hand, "Breakout-Based Color" changes the base color of the candles based on the mitigation of long wicks. When the price breaks above a detected top wick, the bullish color is used. When the price breaks below a detected bottom wick, the bearish color is used.
🔶 SETTINGS
Wick Threshold: The volatility threshold for wick detection. Use a smaller value to detect smaller wicks.
Level %: Placement of the plotted level relative to the wick.
Max Duration: The maximum duration in bars of mitigated wicks.
Mitigated Wicks: Enable or disable mitigated wicks.
🔹 Style
Wick Based Transparency: Make candles with smaller wicks more transparent and candles with longer wicks more solid.
Breakout Based Color: Change the base color based on wick mitigation.
Bullish & Bearish Colors
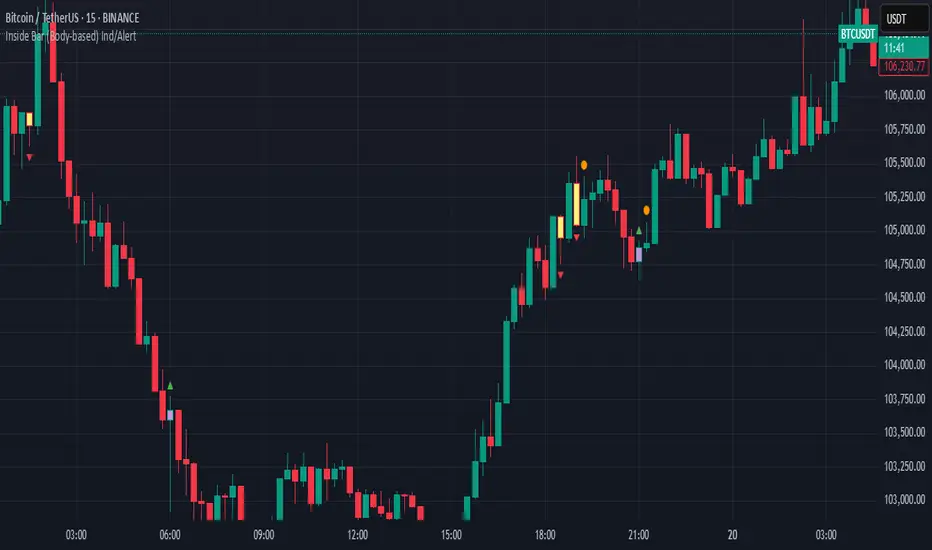
Inside Bar (Body-based) Ind/AlertDescription:
This indicator detects Inside Bar patterns based strictly on the candle body (open/close range) of the mother candle, rather than the traditional high/low wick method. An inside bar is highlighted when the current candle’s entire body is contained within the body of the previous candle.
It can be useful for traders who want a more conservative and reliable definition of inside bars, focusing on true consolidation periods and filtering out signals caused by extended wicks.
Features:
Body-based Inside Bar detection:
The indicator colors and marks candles where the current bar’s body is fully within the previous bar’s body.
Bullish/Bearish identification:
Bullish inside bars are marked in green, bearish in red.
Double Inside Bar Detection:
An optional feature marks when two consecutive candles’ bodies are inside the same mother bar body—potentially indicating stronger consolidation.
Alerts:
Set alerts for single or double inside bars for automated monitoring.
How to Use:
Add the indicator to your chart.
Look for colored bars or plotted shapes for inside bar signals based on candle bodies.
Use alerts to get notified in real time when inside bar patterns appear.
Note:
This script uses only the candle body (open and close) for inside bar calculations, which may help filter out less reliable signals found with wick-based approaches.
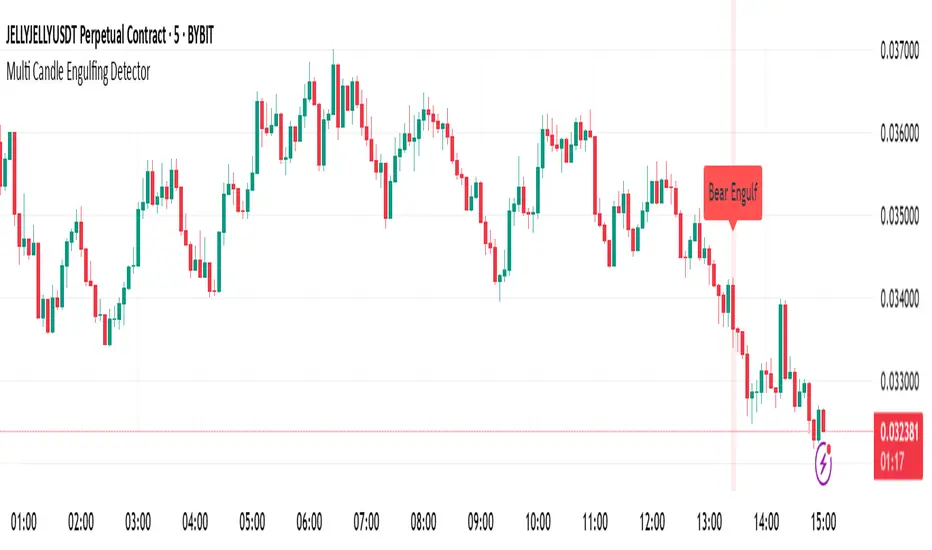
Multi Candle Engulfing Detector🔍 Multi Candle Engulfing Detector
This indicator identifies powerful engulfing candles that consume three or more previous candles — a signal often tied to strong market reversals or continuation moves.
🧠 Features
Detects candles that fully engulf the previous 3 or more candles
Optional filtering: only trigger when the engulfed candles are of the opposite color
Customizable engulf count for greater pattern control
Clear bullish and bearish signal labels on the chart
Alerts integrated: get notified the moment a setup forms
Background highlighting for enhanced visibility
⚙️ Settings
Minimum Number of Candles to Engulf: Default is 3, but can be adjusted
Require Opposite Color: When enabled, the engulfing candle must be opposite in color to the engulfed ones (e.g., green engulfing red)
📈 Use Cases
Spot strong reversal signals at tops and bottoms
Confirm breakout momentum on trend continuation
Use in confluence with other tools like volume or support/resistance
🚨 Alerts
Alerts fire when a bullish or bearish engulfing pattern is detected, allowing for mobile, email, or webhook notifications.
✅ Notes
This script is fully customizable and can be extended into a strategy or scanning tool. Feedback and suggestions are always welcome!
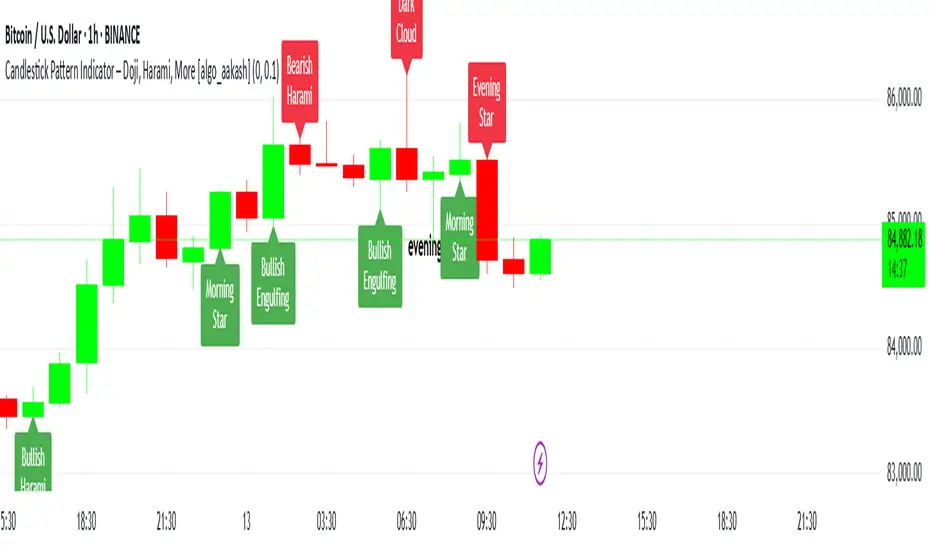
Candlestick Pattern Indicator – Doji, Harami, More [algo_aakash]This Candlestick Pattern Indicator is designed to help traders identify key price action patterns like Bullish Engulfing, Bearish Engulfing, Doji, Hammer, Morning Star, Evening Star, and many more directly on your TradingView chart. With customizable options to display both bullish and bearish patterns , this indicator provides real-time visual markers and labels, helping you make informed trading decisions.
Key features of the indicator include:
Detects popular candlestick patterns such as Bullish Engulfing, Bearish Engulfing, Hammer, Morning Star, Tweezer Tops, and more.
Customizable settings for displaying pattern shapes, labels, and opacity, tailored to your trading preferences.
Option to plot signals only after a candle closes, ensuring accuracy.
Alerts for immediate notification of detected patterns.
Visual markers on the chart, including arrows and labels, for quick recognition of potential trade setups.
This indicator is ideal for traders who rely on candlestick patterns for technical analysis and want an automated tool to highlight these setups for easier decision-making.
Whether you're a beginner or an experienced trader, this tool will help you spot important patterns in real-time without cluttering your chart.
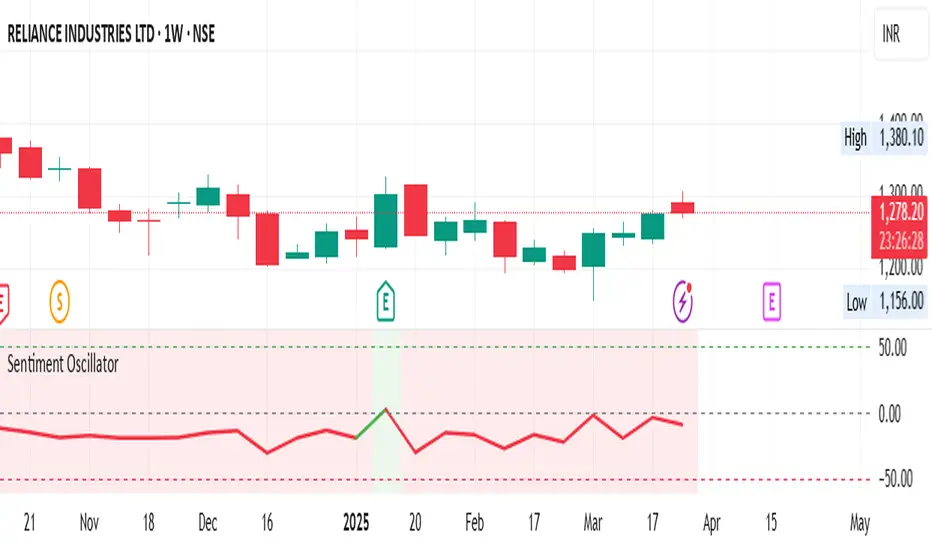
Sentiment OscillatorIn the complex world of trading, understanding market sentiment can be like reading the emotional pulse of financial markets. Our Sentiment Oscillator is designed to be your personal market mood translator, helping you navigate through the noise of price movements and market fluctuations.
Imagine having a sophisticated tool that goes beyond traditional price charts, diving deep into the underlying dynamics of market behavior. This indicator doesn't just show you numbers – it tells you a story about market sentiment, combining multiple financial signals to give you a comprehensive view of potential market directions.
The Sentiment Oscillator acts like a sophisticated emotional barometer for stocks, cryptocurrencies, or any tradable asset. It analyzes price changes, market volatility, trading volume, and long-term trends to generate a unique sentiment score. This score ranges from highly bullish to deeply bearish, providing traders with an intuitive visual representation of market mood.
Green zones indicate positive market sentiment, suggesting potential buying opportunities. Red zones signal caution, hinting at possible downward trends. The oscillator's gray neutral zone helps you identify periods of market uncertainty, allowing for more calculated trading decisions.
What sets this indicator apart is its ability to blend multiple market factors into a single, easy-to-understand indicator. It's not just about current price – it's about understanding the deeper currents moving beneath the surface of market prices.
Traders can use this oscillator to:
- Identify potential trend reversals
- Understand market sentiment beyond price movement
- Spot periods of market strength or weakness
- Complement other technical analysis tools
Whether you're a day trader, swing trader, or long-term investor, the Sentiment Oscillator provides an additional layer of insight to support your trading strategy. Remember, no indicator is a crystal ball, but this tool can help you make more informed decisions in the dynamic world of trading.
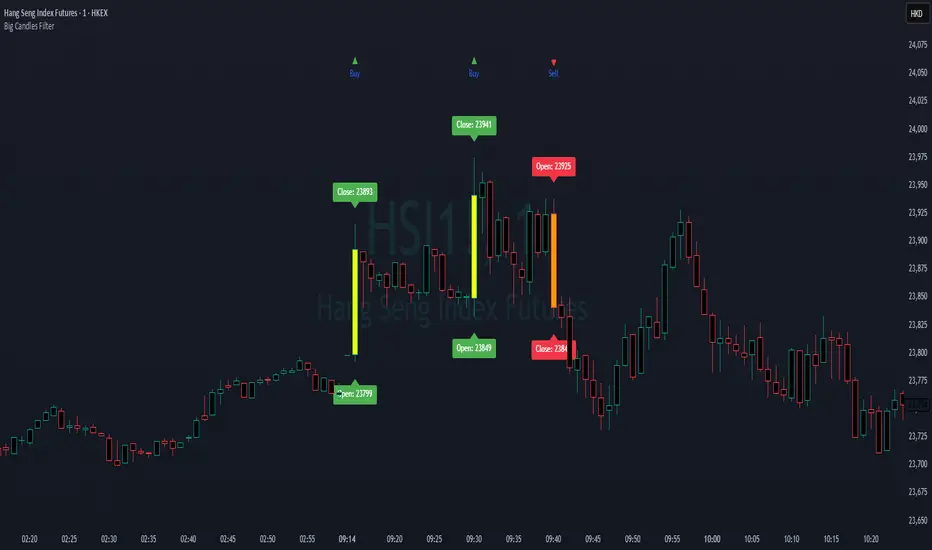
Big Candles FilterHow It Works
A candle is considered "big" only if its body (distance from open to close) exceeds the barHeight value.
** NOT calculated by Range !!!
Features :
Bullish candles (close > open) are marked with a green "Buy" triangle if the body is large enough.
Bearish candles (close < open) are marked with a red "Sell" triangle if the body is large enough.
The bars are colored for big candles, and optional labels show the open and close prices.
DynamicHeikin-Ashi-RKDynamic Heikin-Ashi RK is an advanced Heikin-Ashi candle indicator with a unique ATR-based offset mechanism. This script refines traditional Heikin-Ashi calculations while dynamically shifting the candles using ATR multipliers, helping traders visualize market trends with greater clarity.
🔹 Features:
✔ Customizable Heikin-Ashi colors
✔ ATR-based dynamic candle offset
✔ Enhanced trend visualization
This tool is ideal for traders looking for a smoother trend representation while incorporating volatility-based adjustments. 🚀
Customizations Available in Dynamic Heikin-Ashi RK
This indicator allows several customizations to suit different trading styles:
🔹 Heikin-Ashi Candle Display: Toggle the visibility of Heikin-Ashi candles.
🔹 Custom Colors: Choose custom colors for bullish and bearish Heikin-Ashi candles.
🔹 ATR-Based Dynamic Offset: Adjust the ATR multiplier to control the offset of Heikin-Ashi candles, helping fine-tune trend visualization.
🔹 Refined Heikin-Ashi Calculation: Uses a smoother formula for Heikin-Ashi candles, enhancing clarity.
With these options, traders can personalize the indicator for better trend detection and volatility analysis. 🚀

Inside Bars📌 Overview:
This indicator scans for multiple inside bars during periods of consolidation by dynamically designating a “mother bar” and then marking subsequent bars that trade entirely within its range. It includes an optional doji filter on the most recent candle, helping to confirm indecision before potential breakouts.
🛠 Key Features:
✅ Dynamic Mother Bar Identification:
The script selects a mother bar when the current bar’s range exceeds that of the previous bar. This bar sets the high and low boundaries, creating a reference zone for later price action.
Once a mother bar is defined, subsequent candles that remain completely within its high and low are flagged as inside bars.
✅ Optional Doji Check:
For added precision, an optional feature lets you verify that the most recent bar is a doji—a candle where the difference between the open and close is minimal relative to its total range. This additional filter highlights periods of market indecision, which can often precede strong directional moves.
⚡ Add this script to your chart and enhance your trading strategy! 🚀

Vortex Candle MarkerVortex Candle Marker
The Vortex Candle Marker is a specialized TradingView indicator designed to identify and highlight **Vortex Candles**—candles that momentarily form without wicks on either the high or low. This unique price behavior can signal potential price retracements or reversals, aligning with the **Power of Three (PO3)** concept in price action theory.
Indicator Logic:
A candle is classified as a **Vortex Candle** if either of these conditions is met during its formation:
1. **Vortex Top:** The **high** equals either the **open** or **close**, indicating no upper wick.
2. **Vortex Bottom:** The **low** equals either the **open** or **close**, indicating no lower wick.
When a Vortex Candle is detected, the indicator changes the **candle border color** to **aqua**, making it easy to identify these significant price moments.
Market Insight & PO3 Interpretation:
In typical price behavior, most candles exhibit both upper and lower wicks, representing price exploration before settling at a closing value. A candle forming without a wick suggests **strong directional intent** at that moment. However, by the **Power of Three (PO3)** concept—Accumulation, Manipulation, and Distribution—such wickless formations often imply:
- **Price Reversion Likelihood:** When a candle temporarily forms without a wick, it suggests the market may **revisit the opening price** to establish a wick before the candle closes.
- **Liquidity Manipulation:** The absence of a wick may indicate a **stop-hunt** or liquidity grab, where the price manipulates one side before reversing.
- **Entry Triggers:** Identifying these moments can help traders anticipate potential **retracements** or **continuations** within the PO3 framework.
Practical Application
- **Early Reversal Detection:** Spot potential price reversals by observing wickless candles forming at key levels.
- **Breakout Validation:** Use Vortex Candles to confirm **true breakouts** or **false moves** before the price returns.
- **Liquidity Zones:** Identify areas where the market is likely to revisit to create a wick, signaling entry/exit points.
This indicator is a powerful tool for traders applying **Po3** methodologies and seeking to capture price manipulation patterns.
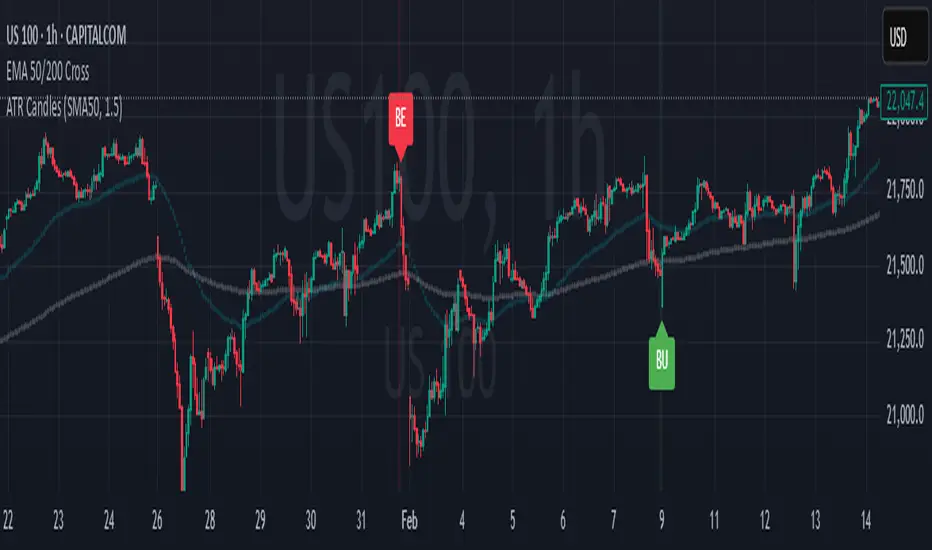
Engulfing Candles (ATR-Based)This indicator detects Engulfing Patterns with an ATR-based filtering mechanism and trend confirmation. Unlike a basic engulfing pattern indicator that only checks if a current candle engulfs the previous one, this script incorporates trend detection using either the 50-period SMA alone or a combination of 50 and 200-period SMAs to ensure that signals align with the broader trend. The indicator identifies Bullish Engulfing patterns when a strong bullish candle engulfs a smaller bearish candle in a downtrend and Bearish Engulfing patterns when a strong bearish candle engulfs a smaller bullish candle in an uptrend. It also generates alerts and visually marks these patterns with labels ("BU" for bullish and "BE" for bearish) while highlighting the background accordingly.
What sets this indicator apart from a normal engulfing indicator is its ATR-based filtering system, which ensures that only significant engulfing candles are considered. Instead of accepting any engulfing pattern, the script measures candle body size relative to 1.5x ATR (configurable) to filter out weak signals. It also differentiates between long-bodied and small-bodied candles to confirm that the engulfing pattern represents real momentum shifts. This approach reduces false signals caused by small, insignificant candles and ensures that traders focus on high-probability reversal patterns. By integrating trend-based filtering and ATR-based confirmation, this indicator provides more reliable and context-aware engulfing signals than a standard engulfing pattern detector.
Triangle Reversal IndicatorTriangle Reversal Indicator – A Visual Tool for Identifying Reversal Patterns
This indicator is designed to highlight potential trend reversal moments by comparing the current candle with the previous one. It offers a unique approach by focusing on distinct candle patterns rather than generic trend indicators, making it a valuable addition to your trading toolkit.
How It Works:
For a bullish signal, the indicator checks if:
The current candle is bullish (closing higher than it opens) while the previous candle was bearish.
The current candle’s low breaches the previous bearish candle’s low.
The current candle’s close is above the previous bearish candle’s close.
When these conditions are met, a tiny green triangle is plotted below the candle to signal a potential bullish reversal.
Conversely, for a bearish signal, it verifies if:
The current candle is bearish (closing lower than it opens) following a bullish candle.
The current candle’s high exceeds the previous bullish candle’s high.
The current candle’s close falls below the previous bullish candle’s close.
If all conditions are satisfied, a small red triangle appears above the candle to indicate a potential bearish reversal.
How to Use:
Simply apply the indicator on your chart and look for the tiny triangles that appear above or below the candles. These markers can serve as an additional visual cue when confirming entry or exit points, but it’s best used alongside your other analysis techniques.
Customization Options:
Users can further enhance the script by adding inputs for lookback periods, adjusting the triangle size, or modifying colors to match their chart themes.
