Major Lows OscillatorDescription
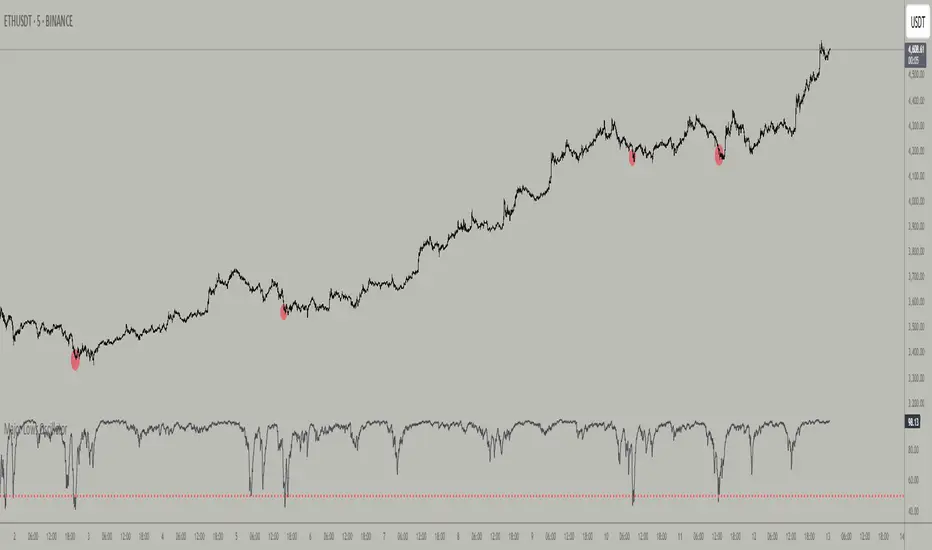
The Major Lows Oscillator is a custom technical indicator designed to identify significant low-price areas by normalizing the current closing price relative to recent lowest lows and highest highs. The oscillator calculates a normalized price percentage over a configurable lookback period, applies exponential moving averages for smoothing, and inverts the result to highlight potential market bottoms.
Calculation Details
Lowest Low Lookback : Finds the lowest low over a user-defined period (default 100 bars).
Highest High Lookback : Calculates the highest high over a short period (default 1 bar), providing a dynamic normalization range.
Normalization : Normalizes the current close within the range defined by the lowest low and highest high, scaled to 0-100.
Smoothing : Applies a 10-period EMA, inversion, and weighted smoothing combining the last valid value and current oscillator reading.
Final Output : Applies a final EMA (period 1) and inverts the oscillator (100 - value) to emphasize major lows.
Features
Customizable midline level for signal alerts (default 50).
Visual midline reference line.
Alerts trigger on oscillator crossing below midline for automated monitoring.
Usage
Useful for complementing existing setups or integration in algorithmic trading strategies.
Changing the input parameters opens new ways to leverage the asymmetric range concept, allowing adaptation to different market regimes and enhancing the oscillator’s sensitivity and utility.
Examples of input combinations and their potential purposes include:
Extremely Asymmetric Setting: Lowest Low Lookback = 200, Highest High Lookback = 1
Focuses on deep long-term lows contrasted with immediate highs, ideal for spotting strong oversold levels within an otherwise bullish short-term momentum.
Symmetric Lookbacks: Lowest Low Lookback = Highest High Lookback = 50
Balances the range equally, creating a normalized oscillator that treats recent lows and highs with the same weight — useful for markets with balanced volatility.
Short but Equal Lookbacks: Lowest Low Lookback = Highest High Lookback = 10
Highly sensitive to recent price swings, this setting can detect rapid shifts and is suited for intraday or very short-term trading.
Inverted Extreme: Lowest Low Lookback = 1, Highest High Lookback = 100
Highlights very recent lows against a long-term high range, possibly signaling quick dips in a generally overextended market.
Inputs
Midline Level : Threshold for alerts (default 50).
Lowest Low Lookback Period : Bars evaluated for lowest low (default 100).
Highest High Lookback Period : Bars evaluated for highest high (default 1).
Alerts
Configured to trigger once per bar close when the oscillator crosses below the midline level.
---
Disclaimer
This indicator is for educational and analytical use only.
Centered Oscillators
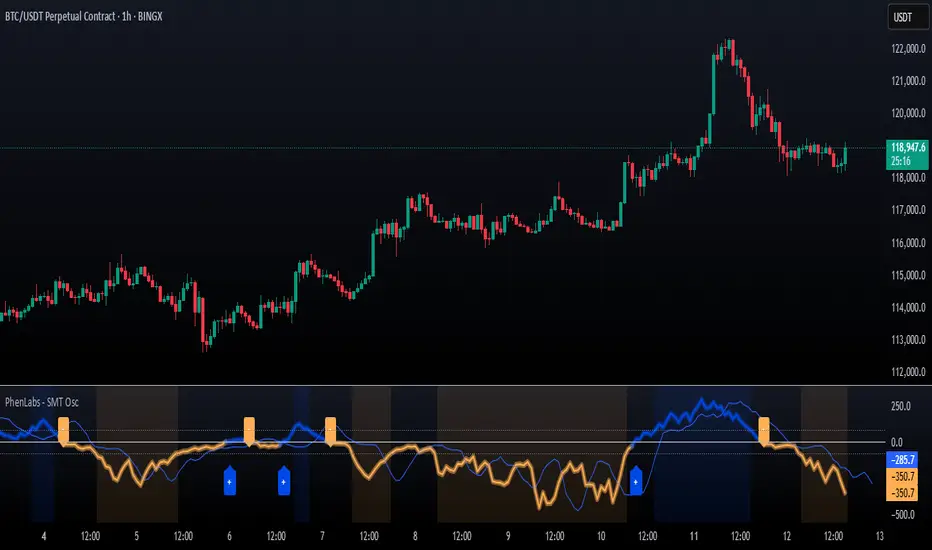
SMT Oscillator: Smarter Money Divergence Detector [PhenLabs]📊Phenlabs - SMT Oscillator: Smarter Money Divergence Detector
Version: PineScript™v6
📌Description
The SMT Oscillator is a sophisticated tool designed to identify smart money divergence between two correlated assets. By analyzing the momentum and volume-weighted price action of a primary and secondary symbol, traders can spot subtle shifts in market dynamics that often precede significant price movements. This indicator is built to provide a clearer, more filtered view of inter-market relationships, solving the common problem of false signals and market noise. Its primary purpose is to equip traders with a quantifiable edge in detecting potential reversals or continuations that are not obvious on a standard price chart.
🚀Points of Innovation
Dual-Symbol Divergence Core: Directly compares momentum (RSI or MACD) between two user-selected symbols to pinpoint true SMT divergence.
Volume-Weighted Analysis: Integrates volume delta into the divergence calculation, giving more weight to moves backed by significant market participation.
Entropy Filter for Noise Reduction: Employs an entropy calculation to filter out low-quality signals during choppy or consolidating market conditions.
Predictive Forecast Line: Utilizes a linear regression model to project the oscillator’s future trajectory, offering a forward-looking glimpse of potential momentum shifts.
Customizable Signal Sensitivity: Allows fine-tuning of overbought and oversold levels to adapt to different market volatilities and trading styles.
Integrated Signal Alerts: Provides built-in alerts for bullish/bearish zero crosses and overbought/oversold conditions.
🔧Core Components
Momentum Engine: The user can select either RSI or MACD as the underlying engine for the divergence calculation, allowing for flexibility in analysis.
Normalization Function: Price data from both symbols is normalized using percentage change to ensure a true “apples-to-apples” comparison, regardless of their nominal price differences.
Divergence Calculator: The core algorithm that subtracts the secondary symbol’s momentum from the primary’s and normalizes the result using the combined standard deviation.
Smoothing Mechanism: An Exponential Moving Average (EMA) is applied to the raw oscillator output to reduce choppiness and provide a clearer signal line.
🔥Key Features
Multi-Asset Comparison: Go beyond single-asset analysis by comparing correlated pairs like ES/NQ or BTC/ETH to uncover hidden trading opportunities.
Heatmap Visualization: An optional heatmap mode provides an intuitive visual representation of divergence strength, making it easier to gauge market sentiment at a glance.
Configurable Lookback and Timeframe: Adjust the lookback period and analysis timeframe to suit your specific strategy, from short-term scalping to long-term trend analysis.
Signal Markers: Visual markers are plotted directly on the chart for bullish and bearish zero-line crossovers, providing clear entry and exit signals.
🎨Visualization
SMT Oscillator Line: The primary visual element, colored blue for bullish (positive) divergence and orange for bearish (negative) divergence.
Zero Line: A solid horizontal line at the zero level, indicating the equilibrium point between the two assets. Crossovers of this line signal a shift in relative strength.
Overbought/Oversold Zones: Dotted lines at the +80 and -80 levels (customizable) that highlight extreme divergence readings, often indicating potential exhaustion points.
Forecast Line: A predictive line that plots the anticipated path of the oscillator, giving traders an advanced warning of potential changes in momentum.
📖Usage Guidelines
Setting Categories
Primary Symbol
Default: (Chart Symbol)
Description: The main asset you are analyzing. Leave blank to use the symbol currently on your chart.
Secondary Symbol
Default: CME_MINI:ES1! (used with NASDAQ futures due to inherent heavy correlation
Description: The asset to compare against the primary symbol.
Lookback Period
Default: 14
Range: 8-100
Description: Controls the calculation window for momentum (RSI/MACD). Higher values result in a smoother, less sensitive oscillator.
Divergence Type
Default: RSI
Options: RSI, MACD
Description: Choose the momentum indicator to use for the divergence calculation.
Enable Volume Weighting
Default: true
Description: When enabled, gives more weight to divergence signals that are accompanied by significant volume.
✅Best Use Cases
Identifying high-probability reversal points by spotting divergence in overbought or oversold territory.
Confirming the strength of a trend by observing sustained positive or negative divergence.
Pairs trading by taking a long position on the outperforming asset and a short position on the underperforming one during a divergence.
Risk management by recognizing when a current trend is losing its underlying momentum.
⚠️Limitations
Requires Correlated Assets: The indicator’s effectiveness is highly dependent on the selection of two assets with a known correlation (e.g., ES and NQ).
Not a Standalone System: Divergence signals should be used in conjunction with other forms of analysis (price action, market structure) and not as a complete trading system.
Lagging by Nature: As it is based on moving averages and past price data, the oscillator is inherently lagging and may not capture all rapid price changes.
💡What Makes This Unique
Combined Momentum & Volume: Unlike standard oscillators, it fuses momentum with volume delta for a more robust “Smart Money” perspective.
Noise-Filtering Mechanism: The proprietary entropy filter is a unique feature designed to weed out insignificant market chatter and focus on high-conviction signals.
🔬How It Works
Data Normalization:
The script first normalizes the price data of the two selected symbols into percentage changes. This ensures that the comparison is fair, regardless of the difference in their price scales.
Momentum Calculation:
It then calculates the chosen momentum value (either RSI or MACD histogram) for each of the normalized price series.
Divergence Computation:
The core of the indicator lies in subtracting the momentum of the secondary symbol from the primary one. This raw divergence is then optionally weighted by volume and filtered for market noise (entropy) to produce the final oscillator value.
💡Note:
For best results, use this indicator on adequate timeframes to filter out market noise. Always confirm signals with price action analysis before entering a trade.
Momentum_EMABand📢 Reposting Notice
I am reposting this script because my earlier submission was hidden due to description requirements under TradingView’s House Rules. This updated version fully explains the originality, the reason for combining these indicators, and how they work together. Follow me for future updates and refinements.
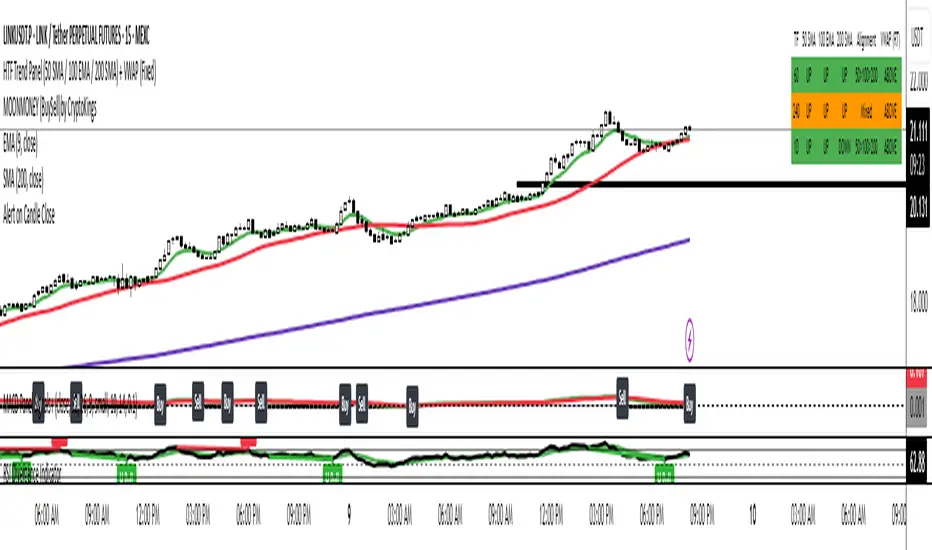
🆕 Momentum EMA Band, Rule-Based System
Momentum EMA Band is not just a mashup — it is a purpose-built trading tool for intraday traders and scalpers that integrates three complementary technical concepts into a single rules-based breakout & retest framework.
Originality comes from the specific sequence and interaction of these three filters:
Supertrend → Sets directional bias.
EMA Band breakout with retest logic → Times precise entries.
ADX filter → Confirms momentum strength and avoids noise.
This system is designed to filter out weak setups and false breakouts that standalone indicators often fail to avoid.
🔧 How the Indicator Works — Combined Logic
1️⃣ EMA Price Band — Dynamic Zone Visualization
Plots upper & lower EMA bands (default: 9-period EMA).
Green Band → Price above upper EMA = bullish momentum
Red Band → Price below lower EMA = bearish pressure
Yellow Band → Price within band = neutral zone
Acts as a consolidation zone and breakout trigger level.
2️⃣ Supertrend Overlay — Reliable Trend Confirmation
ATR-based Supertrend adapts to volatility:
Green Line = Uptrend bias
Red Line = Downtrend bias
Ensures trades align with the prevailing trend.
3️⃣ ADX-Based No-Trade Zone — Choppy Market Filter
Manual ADX calculation (default: length 14).
If ADX < threshold (default: 20) and price is inside EMA Band → gray background marks low-momentum zones.
🧩 Why This Mashup Works
Supertrend confirms trend direction.
EMA Band breakout & retest validates the breakout’s strength.
ADX ensures the market has enough trend momentum.
When all align, entries are higher probability and whipsaws are reduced.
📈 Example Trade Walkthrough
Scenario: 5-minute chart, ADX threshold = 20.
Supertrend turns green → trend bias is bullish.
Price consolidates inside the yellow EMA Band.
ADX rises above 20 → trend momentum confirmed.
Price closes above the green EMA Band after retesting the band as support.
Entry triggered on candle close, stop below band, target based on risk-reward.
Exit when Supertrend flips red or ADX momentum drops.
This sequence prevents premature entries, keeps trades aligned with trend, and avoids ranging markets.
🎯 Key Features
✅ Multi-layered confirmation for precision trading
✅ Built-in no-trade zone filter
✅ Fully customizable parameters
✅ Clean visuals for quick decision-making
⚠ Disclaimer: This is Version 1. Educational purposes only. Always use with risk management.

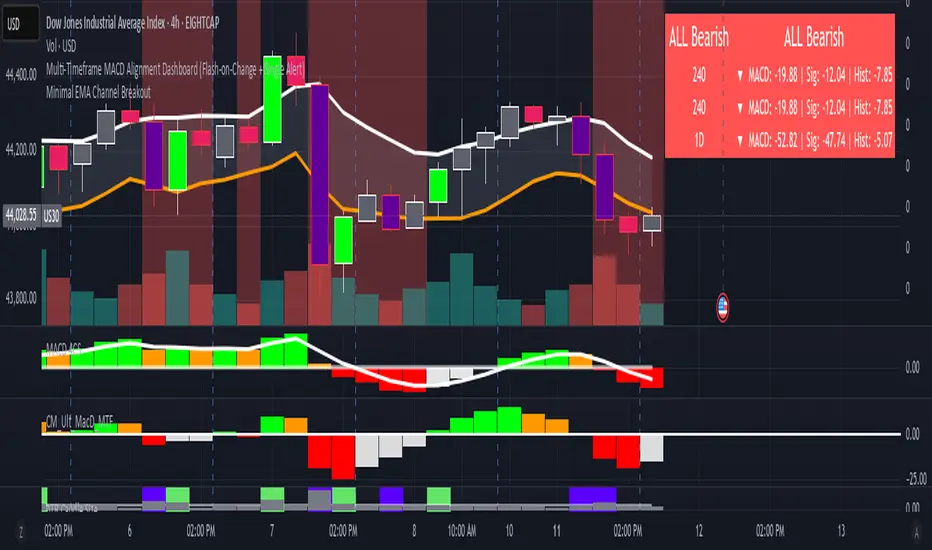
THE TRINTY - Multi-Timeframe MACD Alignment (Single Alert)Analyzes up to 3 timeframes at the same time waiting for MACD alignment plus determines when it's very bullish, very bearish, or just mixed. Ideal for traders who only want to trade in high probability markets to increase your chances at success. Also, there's only 1 single alert system that you can set for each pair making things much easier instead of setting separate bullish and bearish alerts like most other indicators.
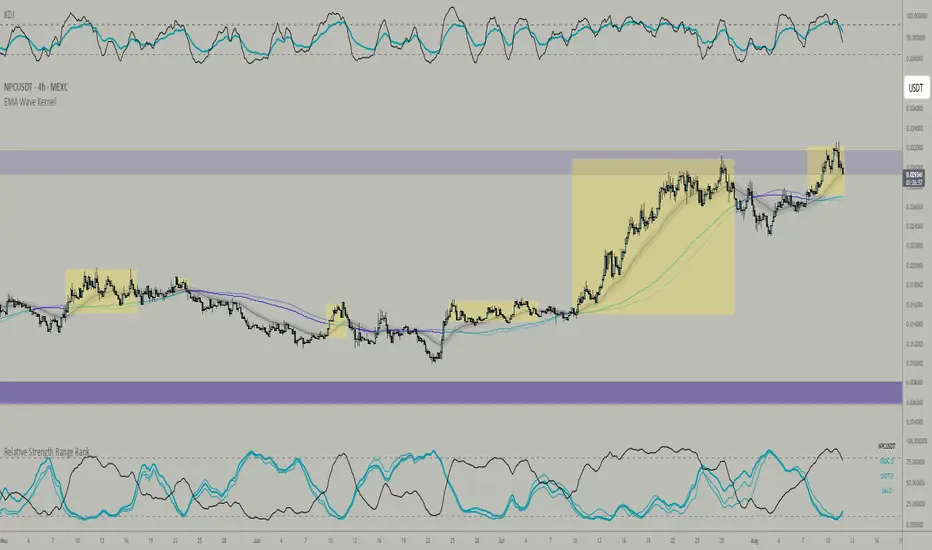
Relative Strength Range RankRelative Strength Range Rank – Chart Asset vs. Benchmarks
Description:
This indicator calculates and ranks the relative strength position of the current chart’s asset against up to five user-defined comparison symbols. By default, the comparison set is USDT.D, USDC.D and DAI.D.
Calculation method:
The same oscillator calculation is applied identically to the current chart’s asset and all comparison symbols:
For each symbol:
Determine the lowest low over LOWEST bars.
Determine the highest high over HIGHEST bars.
Calculate normalized position within range:
raw_osc = (close - lowest_low) / (highest_high - lowest_low) * 100
Apply a 10-period EMA to smooth raw_osc.
Invert and scale to match assets direction:
raw_osc = 100 - EMA_10(raw_osc)
Apply weighted smoothing:
smoothed = 0.191 * previous_value + 0.809 * current_value
Apply a final 1-period EMA to reduce jitter.
Output is the inverted smoothed oscillator value, representing the relative strength rank.
This function is implemented as calculate_oscillator() and used for all input symbols plus the current chart symbol, ensuring consistency in comparative analysis.
Plotting:
Each comparison symbol oscillator is plotted in the indicator pane.
The current chart oscillator is always plotted in black.
Alert condition:
Boolean chart_osc_above_all is true when the current chart oscillator is strictly greater than all other comparison oscillator values.
The alert chart_osc_crossed_above triggers only on the first bar where chart_osc_above_all changes from false to true.
Smoothing advantage:
The smoothing sequence (EMA → weighted smoothing → EMA) is designed to reduce short-term noise while preserving responsiveness to changes in price position.
The initial EMA(10) filters random fluctuations.
The weighted smoothing step (0.191 * prev + 0.809 * current) reduces overshoot and dampens oscillations without introducing significant lag, unlike longer EMAs.
The final EMA(1) step ensures stability in the plotted oscillator without visible jaggedness.
This combination yields a signal that is both smooth and reactive, making relative strength comparisons more precise.
Inputs:
Sym 1–5: up to five comparison tickers.
Lowest low lookback period ( LOWEST ).
Highest high lookback period ( HIGHEST ).
Color for plotted comparison lines.
Output:
Oscillator values from 0 to 100, where higher values indicate that the asset’s current price is closer to the highest high of the lookback period, and lower values indicate proximity to the lowest low.
Sorted table showing all selected assets ranked by oscillator value.
Optional alert when the current chart asset leads all selected assets in oscillator value.
Short Description:
Computes range-normalized oscillator values for the chart asset and up to 5 symbols, using EMA and weighted smoothing to reduce noise while preserving responsiveness; optional alert when the chart asset exceeds all others.
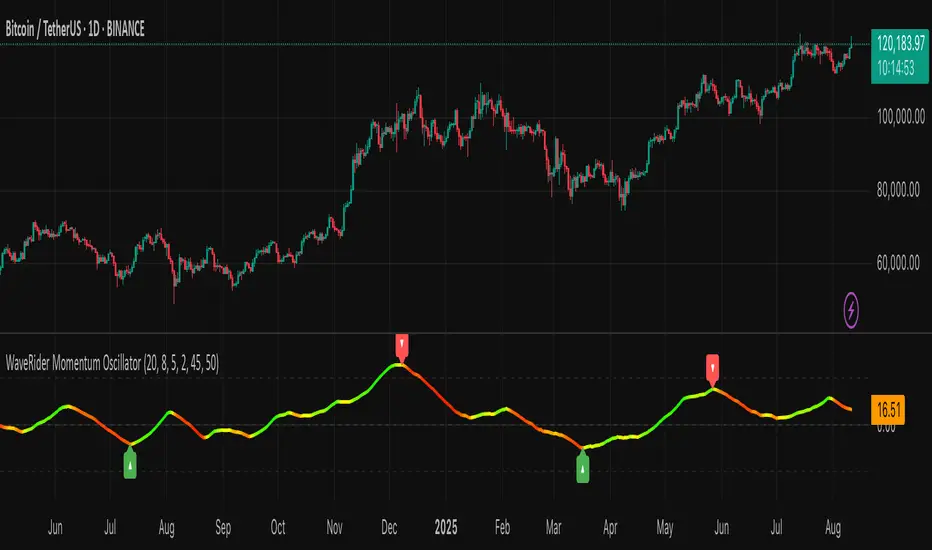
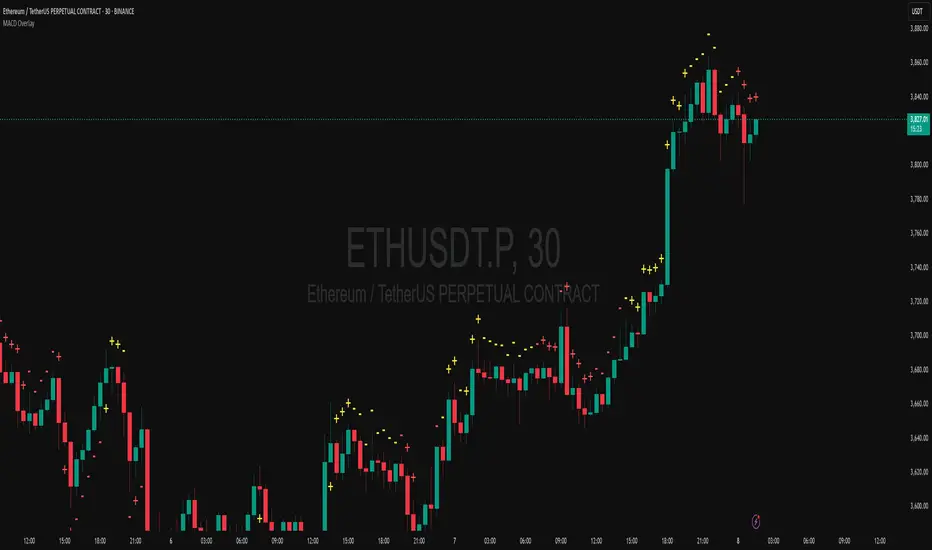
WaveRider Momentum OscillatorWaveRider Momentum Oscillator
The WaveRider Momentum Oscillator applies principles inspired by fluid dynamics to model price momentum as a flowing system, rather than relying on traditional static calculations. By interpreting market movement through the lens of velocity, viscosity, and turbulence—core concepts in fluid mechanics—this indicator offers a more adaptive and nuanced view of momentum that adjusts dynamically to changing market conditions.
Conceptual Foundation
Velocity: Just as fluid velocity measures the speed of flow at a point, WaveRider calculates momentum velocity by measuring the rate of price change over a specified period, smoothed to reduce noise.
Viscosity: In fluid dynamics, viscosity represents internal friction that resists flow. Here, viscosity is modeled based on volatility, modulating momentum signals to account for the “thickness” or noise level of the market. High volatility increases viscosity’s damping effect, reducing false signals during turbulent price action.
Turbulence: Turbulence characterizes sudden, chaotic changes in fluid flow. WaveRider detects rapid acceleration bursts in momentum analogous to turbulence, highlighting moments when momentum is shifting sharply and potentially signaling strong upcoming price moves.
Technical Features and Interpretation
Adaptive Momentum Calculation: Momentum is scaled by volatility-adjusted viscosity, making the oscillator less prone to whipsaws and more responsive during stable trends.
Turbulence Burst Detection: The oscillator incorporates a turbulence factor, identifying abrupt momentum accelerations that traditional oscillators often miss. This feature provides early warning signals of potential breakout or reversal points.
HSV Gradient Color Mapping: The oscillator visualizes acceleration using a continuous hue gradient—ranging from red (deceleration) through yellow (neutral) to green (acceleration). This continuous color transition provides intuitive, real-time insight into momentum dynamics beyond mere numeric values.
Pivot Point Identification: WaveRider automatically marks momentum pivots, signaling local maxima and minima in momentum flow. These points serve as critical confirmation markers for potential entry and exit decisions.
How to Interpret WaveRider
Colors:
Green hues indicate positive acceleration — momentum is increasing, favoring bullish positions.
Yellow hues represent neutral momentum — the market is consolidating or pausing.
Red hues signal negative acceleration — momentum is weakening, suggesting caution or bearish bias.
Oscillator Direction:
An upward sloping oscillator line reflects strengthening momentum.
A downward slope indicates weakening momentum or a potential reversal.
Pivot Labels:
▲ (Pivot Low): Denotes local momentum troughs; potential points to consider initiating long positions.
▼ (Pivot High): Marks local momentum peaks; useful for identifying possible short entries or profit-taking zones.
Summary
By grounding momentum analysis in fluid dynamics, WaveRider transcends the limitations of traditional oscillators. It accounts for the market’s inherent volatility and captures real-time acceleration changes, enabling traders to detect meaningful momentum shifts with greater accuracy and clarity.
WaveRider is designed for traders seeking a scientifically informed tool that adapts fluidly with market conditions—offering deeper insight into momentum flow and better timing for entries and exits.
Quant Signals: Econophysics-based MomentumPhysical Momentum Switcher (p0 / p1 / p2 / p3)
This indicator implements a “physical momentum” concept from quantitative finance research, where momentum is defined similarly to physics:
Momentum (p) = Mass × Velocity
Instead of using only the standard cumulative return (classic momentum), it lets you switch between multiple definitions:
p0: Cumulative return over the lookback period (no mass, just price change).
p1: Sum of (mass × velocity) over the lookback period.
p2: Weighted average velocity = (Σ mass×velocity) ÷ (Σ mass).
p3: Sharpe-like momentum = average velocity ÷ volatility (massless).
Velocity can be measured as:
Log return: ln(Pt / Pt-1)
Normal return: (Pt / Pt-1 – 1)
Mass (for p1/p2) can be defined as:
Unit mass (1) — equal weighting, equivalent to traditional momentum.
Turnover proxy — Volume ÷ average volume over k bars.
Value turnover proxy — Dollar volume ÷ average dollar volume.
Inverse volatility — 1 ÷ return volatility over a specified period.
Features:
Switchable momentum definition, velocity type, and mass type.
Adjustable lookback (k) and smoothing period for the signal line.
Optional ±1σ display bands for quick overbought/oversold visual cues.
Alerts for crosses above/below zero or the signal line.
Table display summarizing current settings and values.
Typical uses:
Momentum trading: Buy when PM > 0 (or crosses above the signal), sell/short when PM < 0 (or crosses below).
Contrarian strategies: Reverse the logic when testing mean-reversion effects.
Cross-asset testing: Apply to different instruments to see which PM definition works best.

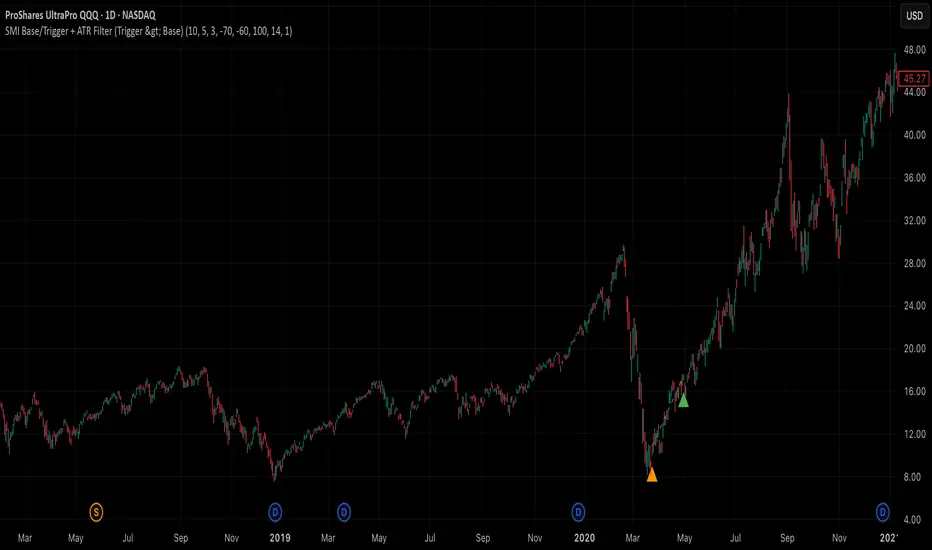
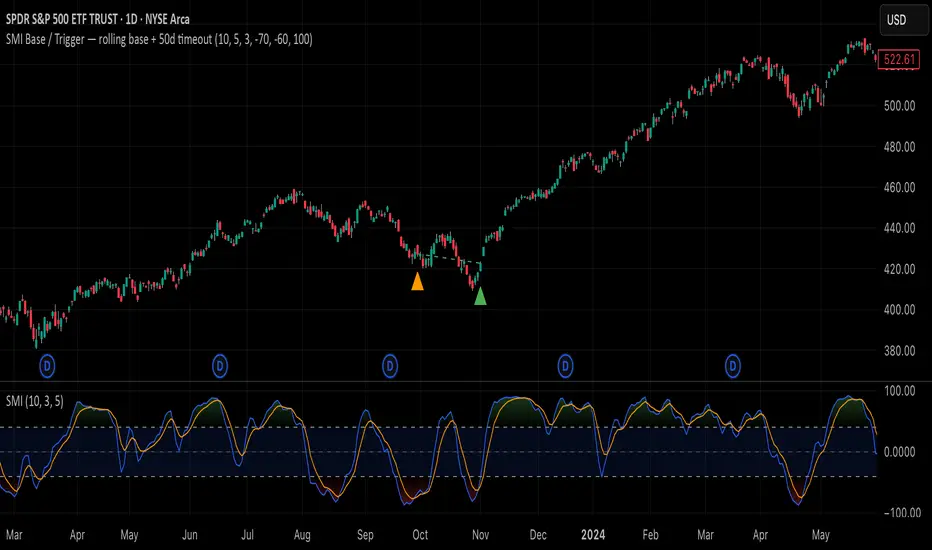
SMI Base-Trigger Bullish Re-acceleration (Higher High)Description
What it does
This indicator highlights a two-step bullish pattern using Stochastic Momentum Index (SMI) plus an ATR distance filter:
1. Base (orange) – Marks a momentum “reset.” A base prints when SMI %K crosses up through %D while %K is below the Base level (default -70). The base stores the base price and starts a waiting window.
2. Trigger (green) – Confirms momentum and price strength. A trigger prints only if, before the timeout window ends:
• SMI %K crosses up through %D again,
• %K is above the Trigger level (default -60),
• Close > Base Price, and
• Price has advanced at least Min ATR multiple (default 1.0× the 14-period ATR) above the base price.
A dashed green line connects the base to the trigger.
Why it’s useful
It seeks a bullish divergence / reacceleration: momentum recovers from deeply negative territory, then price reclaims and exceeds the base by a volatility-aware margin. This helps filter out weak “oversold bounces.”
Signals
• Base ▲ (orange): Potential setup begins.
• Trigger ▲ (green): Confirmation—momentum and price agree.
Inputs (key ones)
• %K Length / EMA Smoothing / %D Length: SMI construction.
• Base when %K < (default -70): depth required for a valid reset.
• Trigger when %K > (default -60): strength required on confirmation.
• Base timeout (days) (default 100): maximum look-ahead window.
• ATR Length (default 14) and Min ATR multiple (default 1.0): price must exceed the base by this ATR-scaled distance.
How traders use it (example rules)
• Entry: On the Trigger.
• Risk: A common approach is a stop somewhere between the base price and a multiple of ATR below trigger; or use your system’s volatility stop.
• Exits: Your choice—trend MA cross, fixed R multiple, or structure-based levels.
Notes & tips
• Works best on liquid symbols and mid-to-higher timeframes (reduce noise).
• Increase Min ATR multiple to demand stronger price confirmation; tighten or widen Base/Trigger levels to fit your market.
• This script plots signals only; convert to a strategy to backtest entries/exits.
MACD (Panel) with Histogram-Confirmed Signals - Middle LineMacd indicator with buy and sell signals to help spot the macd signal crossover and histogram
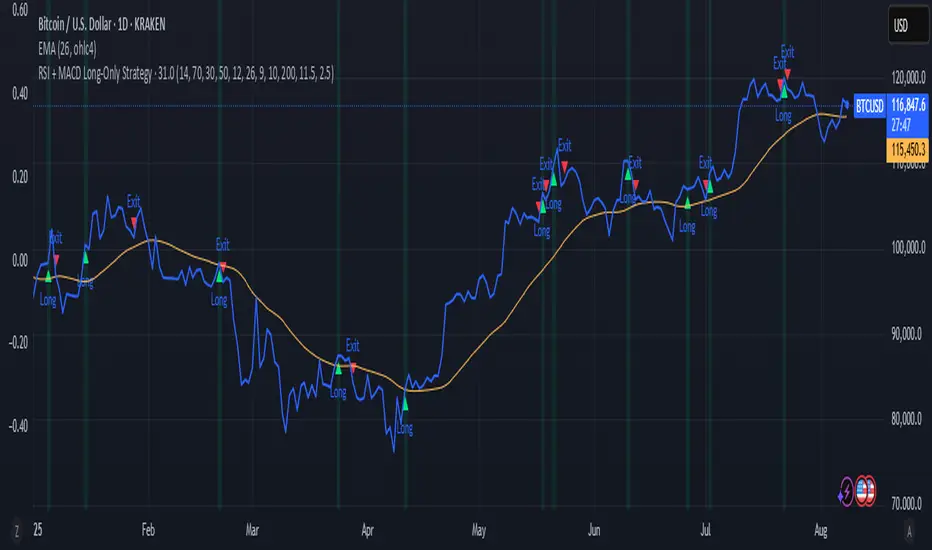
RSI + MACD Long-Only StrategyRSI + MACD Long-Only Strategy
Overview: Momentum-based, long-only strategy combining RSI and MACD. Entries favor upside momentum; exits trigger on momentum fades or risk targets. Signals are state-gated so you get one exit per entry (no multiple exits without a prior entry).
Entry conditions:
RSI crosses above the midline (default 50) while MACD is bullish (MACD > Signal, optionally MACD > 0), OR
MACD crosses above its Signal while RSI is at/above the midline.
Optional filters:
EMA trend filter: only enter if price > EMA(n).
Oversold context: only enter within N bars after RSI dipped below the oversold threshold.
Exit conditions:
RSI crosses below the midline, OR
MACD crosses below its Signal with MACD histogram ≤ 0.
Optional risk exit: Take Profit / Stop Loss based on percentage from average entry price.
Risk management:
Inputs: Use TP/SL (on/off), TP% (default 3.0), SL% (default 1.5).
Implements protective strategy.exit (limit/stop) while in position.
Signal-based exit uses strategy.close to flatten.
Position management:
Long-only, no pyramiding (single position at a time).
Internal state ensures entries occur only when flat and exits only when in a position.
Inputs you can tune:
RSI: length, overbought, oversold, midline.
MACD: fast length, slow length, signal length; toggle “Require MACD > 0”.
Signals: oversold lookback window; EMA trend on/off and EMA length.
Risk: TP% and SL%.
Visuals: show entry/exit markers, bar coloring; optional debug background on raw triggers.
Visuals and alerts:
Plots EMA (optional), draws entry/exit markers, optional bar coloring, and a faint background on raw long triggers to aid tuning.
Alert conditions provided for entries and exits.
Notes:
Designed for bar-close evaluation; performance varies by symbol/timeframe—tune inputs accordingly.
Long-only; intended for trend-following momentum with basic risk control.
Not financial advice.
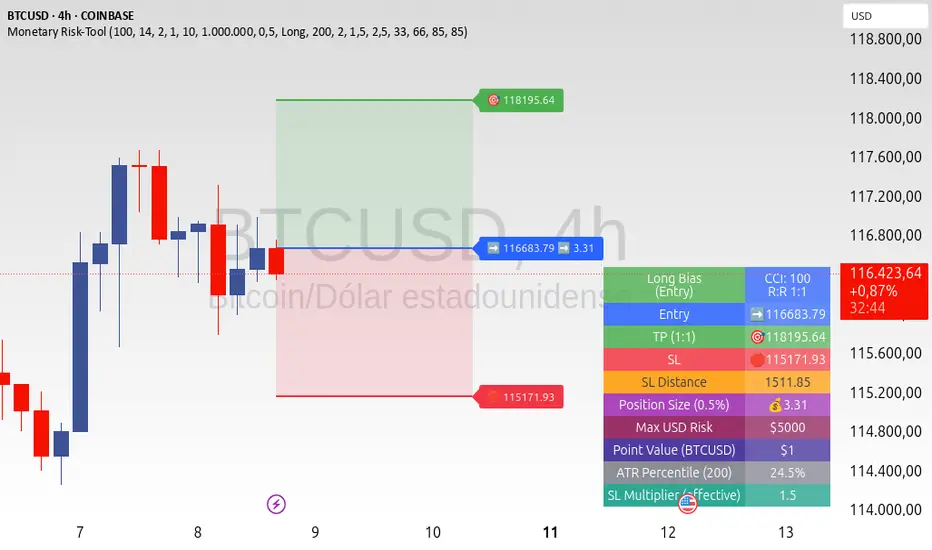
ATR+CCI Monetary Risk Tool - TP/SL⚙️ ATR+CCI Monetary Risk Tool — Volatility-aware TP/SL & Position Sizing
Exact prices (no rounding), ATR-percentile dynamic stops, and risk-budget sizing for consistent execution.
🧠 What this indicator is
A risk-first planning tool. It doesn’t generate orders; it gives you clean, objective levels (Entry, SL, TP) and position size derived from your risk budget. It shows only the latest setup to keep charts readable, and a compact on-chart table summarizing the numbers you actually act on.
✨ What makes it different
Dynamic SL by regime (ATR percentile): Instead of a fixed multiple, the SL multiplier adapts to the current volatility percentile (low / medium / high). That helps avoid tight stops in noisy markets and over-wide stops in quiet markets.
Risk budgeting, not guesswork: Size is computed from Account Balance × Max Risk % divided by SL distance × point value. You risk the same dollars across assets/timeframes.
Precision that matches your instrument: Entry, TP, SL, and SL Distance are displayed as exact prices (no rounding), truncated to syminfo.mintick so they align with broker/exchange precision.
Symbol-aware point value: Uses syminfo.pointvalue so you don’t maintain tick tables.
Non-repaint option: Work from closed bars to keep the plan stable.
🔧 How to use (quick start)
Add to chart and pick your timeframe and symbol.
In settings:
Set Account Balance (USD) and Max Risk per Trade (%).
Choose R:R (1:1 … 1:5).
Pick ATR Period and CCI Period (defaults are sensible).
Keep Dynamic ATR ON to adapt SL by regime.
Keep Use closed-bar values ON to avoid repaint when planning.
Read the labels (Entry/TP/SL) and the table (SL Distance, Position Size, Max USD Risk, ATR Percentile, effective SL Mult).
Combine with your entry trigger (price action, levels, momentum, etc.). This indicator handles risk & targets.
📐 How levels are computed
Bias: CCI ≥ 0 ⇒ long, otherwise short.
ATR Percentile: Percent rank of ATR(atrPeriod) over a lookback window.
Effective SL Mult:
If percentile < Low threshold ⇒ use Low SL Mult (tighter).
If between thresholds ⇒ use Base SL Mult.
If percentile > High threshold ⇒ use High SL Mult (wider).
Stop-Loss: SL = Entry ± ATR × SL_Mult (minus for long, plus for short).
Take-Profit: TP = Entry ± (Entry − SL) × R (R from the R:R dropdown).
Position Size:
USD Risk = Balance × Risk%
Contracts = USD Risk ÷ (|Entry − SL| × PointValue)
For futures, quantity is floored to whole contracts.
Exact prices: Entry/TP/SL and SL Distance are not rounded; they’re truncated to mintick so what you see matches valid price increments.
📊 What you’ll see on chart
Latest Entry (blue), TP (green), SL (red) with labels (optional emojis: ➡️ 🎯 🛑).
Info Table with:
Bias, Entry, TP, SL (exact, truncated to mintick)
SL Distance (exact, truncated)
Position Size (contracts/units)
Max USD Risk
Point Value
ATR Percentile and effective SL Mult
🧪 Practical examples
High-volatility session (e.g., XAUUSD, 1H): ATR percentile is high ⇒ wider SL, smaller size. Reduces churn from normal noise during macro events.
Range-bound market (e.g., EURUSD, 4H): ATR percentile low ⇒ tighter SL, better R:R. Helps you avoid carrying unnecessary risk.
Index swing planning (e.g., ES1!, Daily): Non-repaint levels + risk budgeting = consistent sizing across days/weeks, easier to review and journal.
🧭 Why traders should use it
Consistency: Same dollar risk regardless of instrument or volatility regime.
Clarity: One-trade view forces focus; you see the numbers that matter.
Adaptivity: Stops calibrated to the market’s current behavior, not last month’s.
Discipline: A visible checklist (SL distance, size, USD risk) before you hit buy/sell.
🔧 Input guide (practical defaults)
CCI Period: 100 by default; use as a bias filter, not an entry signal.
ATR Period: 14 by default; raise for smoother, lower for more reactive.
ATR Percentile Lookback: 200 by default (stable regime detection).
Percentile thresholds: 33/66 by default; widen the gap to change how often regimes switch.
SL Mults: Start ~1.5 / 2.0 / 2.5 (low/base/high). Tune by asset.
Risk % per trade: Common pro ranges are 0.25–1.0%; adjust to your risk tolerance.
R:R: Start with 1:2 or 1:3 for balanced skew; adapt to strategy edge.
Closed-bar values: Keep ON for planning/live; turn OFF only for exploration.
💡 Best practices
Combine with your entry logic (structure, momentum, liquidity levels).
Review ATR percentile and effective SL Mult across sessions so you understand regime shifts.
For futures, remember size is floored to whole contracts—safer by design.
Journal trades with the table snapshot to improve risk discipline over time.
⚠️ Notes & limitations
This is not a strategy; it does not place orders or alerts.
No slippage/commissions modeled here; build a strategy() version for backtests that mirror your broker/exchange.
Displayed non-price metrics use two decimals; prices and SL Distance are exact (truncated to mintick).
📎 Disclaimer
For educational purposes only. Not financial advice. Markets involve risk. Test thoroughly before trading live.
Bullish Divergence SMI Base & Trigger with ATR FilterDescription:
A bullish divergence indicator combining the Stochastic Momentum Index (SMI) and Average True Range (ATR) to pinpoint high-probability entries:
1. Base Arrow (Orange ▲):
• Marks every SMI %K / %D bullish crossover where %K < –70 (deep oversold)—the first half of the divergence setup.
• Each new qualifying crossover replaces the previous base, continuously “arming” the divergence signal.
• Configurable SMI lookbacks, oversold threshold, and a base timeout (default 100 days) to clear stale bases.
2. Trigger Arrow (Green ▲):
• Completes the bullish divergence: fires on the next SMI bullish crossover where %K > –60 and price has dropped below the base arrow’s close by at least N × ATR (default 1 × 14-day ATR).
• A dashed green line links the base and trigger to visually confirm the divergence.
• Resets after triggering, ready for a new divergence cycle.
Inputs:
• SMI %K Length, EMA Smoothing, %D Length
• Oversold Base Level (–70), Trigger Level (–60)
• ATR Length (14), ATR Multiplier (1.0)
• Base Timeout (100 days)
Ideal for any market, this study highlights genuine bullish divergences—oversold momentum crossovers that coincide with significant price reactions—before entering long trades.
MACD Overlay In main chart# MACD Overlay Indicator
## Overview
This indicator displays MACD (Moving Average Convergence Divergence) signals directly on the price chart without creating a separate window. It shows the momentum and trend changes through simple + and - symbols positioned relative to candlesticks.
## Features
- **Overlay Display**: Shows MACD information on the main price chart
- **Clean Interface**: Uses minimal + and - symbols instead of complex charts
- **Position Logic**: Symbol placement indicates MACD position relative to zero line
- **Energy Analysis**: Symbols represent histogram energy changes (absolute value)
- **Color Coding**: Different colors for golden cross and death cross signals
## Symbol Meaning
### Position Logic
- **Above Candlesticks**: MACD is above zero line (bullish territory)
- **Below Candlesticks**: MACD is below zero line (bearish territory)
### Symbol Meaning
- **+ Symbol**: MACD histogram absolute value is increasing (momentum strengthening)
- **- Symbol**: MACD histogram absolute value is decreasing (momentum weakening)
### Color Coding
- **Yellow**: Golden cross (MACD line above signal line)
- **Red**: Death cross (MACD line below signal line)
## Settings
- **Fast Length**: Default 12 (EMA fast period)
- **Slow Length**: Default 26 (EMA slow period)
- **Signal Smoothing**: Default 9 (Signal line period)
- **Oscillator MA Type**: EMA or SMA for MACD calculation
- **Signal Line MA Type**: EMA or SMA for signal line
## How to Use
1. **Trend Identification**:
- Symbols above candlesticks = Bullish MACD territory
- Symbols below candlesticks = Bearish MACD territory
2. **Momentum Analysis**:
- + symbols = Momentum is strengthening
- - symbols = Momentum is weakening
3. **Signal Confirmation**:
- Yellow symbols = MACD above signal line (bullish signal)
- Red symbols = MACD below signal line (bearish signal)
## Advantages
- **Space Efficient**: No separate indicator window required
- **Clean Chart**: Maintains price chart clarity
- **Quick Analysis**: Instant visual feedback on MACD status
- **Non-Intrusive**: Doesn't alter candlestick colors or backgrounds
## Best Practices
- Use in conjunction with price action analysis
- Combine with other technical indicators for confirmation
- Pay attention to symbol color changes for trend shifts
- Monitor symbol position changes for momentum shifts
---
*This indicator provides a simplified way to monitor MACD signals without cluttering your chart with additional windows.*
Animal EnvironmentInfers based on topogrophy if you are more likely to encounter bears or bulls near.
MACD + RSI Signal ArrowsA small green arrow up (↑) when there's a buy signal
A small red arrow down (↓) when there's a sell signal

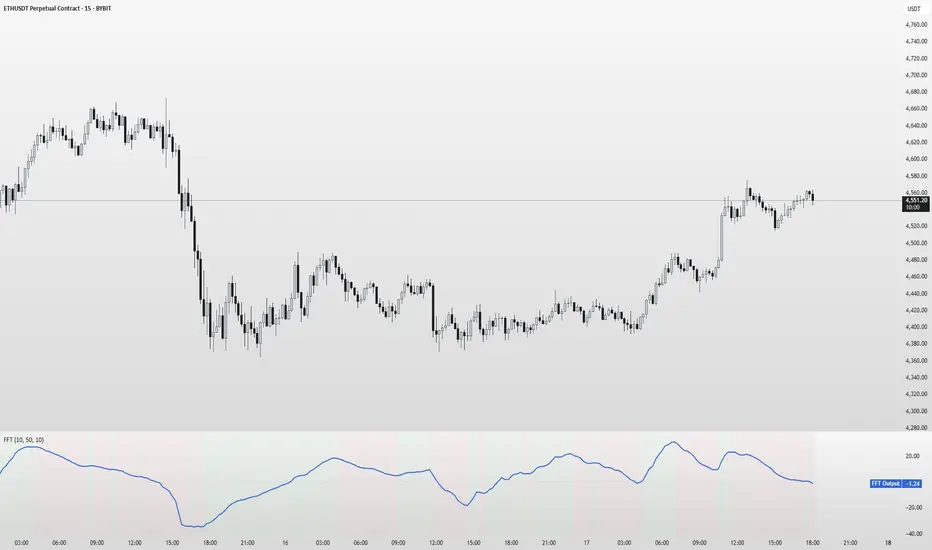
FFT Signal AnalyzerFFT Signal Analyzer
The FFT Signal Analyzer uses a simplified Fast Fourier Transform (FFT) approach to extract dominant cyclical components from price data. By detrending and applying adaptive smoothing, the indicator highlights frequency-driven signals that traditional indicators often miss.
This tool is ideal for traders who want to visualize cyclical market behavior, identify turning points, and confirm entries/exits with frequency-based momentum signals.
How it works:
Removes price trend via detrending (moving average subtraction)
Applies a bandpass filter (EMA) to isolate dominant frequency components
Normalizes the signal using a z-score for consistent visibility
Amplifies the signal for easy interpretation
Highlights slope changes with background coloring (green = rising, red = falling)
Use Cases:
Use zero-line crosses to detect cycle shifts or momentum pivots
Combine with trend filters (e.g., GRJMOM) for high-probability setups
Ideal for detecting underlying rhythm in sideways or oscillating markets
Best for:
Swing traders, scalpers, and cycle analysts looking for frequency-aware confirmation signals
Works on all timeframes and asset classes
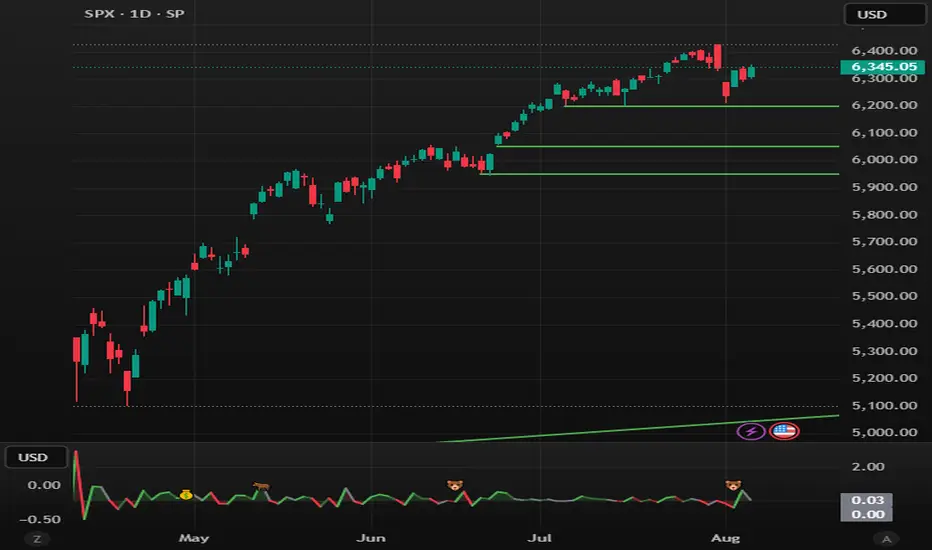
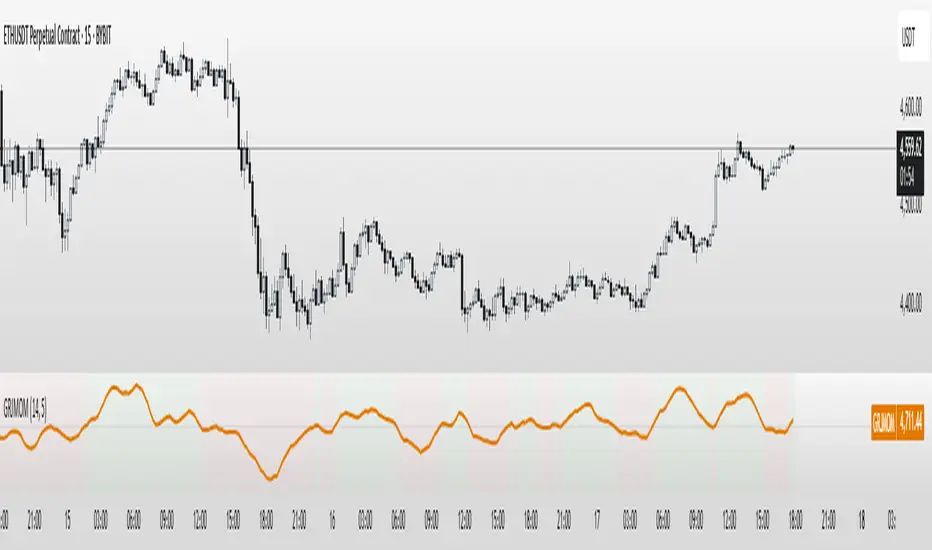
GRJMOM - Risk-Adjusted MomentumGRJMOM – Risk-Adjusted Momentum
GRJMOM stands for Generalized Risk-Adjusted Momentum. This indicator adjusts traditional momentum by dividing it by realized volatility over the same formation period. The result is a cleaner, more risk-sensitive momentum signal designed to avoid momentum crashes and volatility-driven false breakouts.
How it works:
Calculates raw momentum: Close - Close
Computes realized volatility using standard deviation of log returns
Outputs a risk-adjusted momentum score (Momentum / Volatility)
Optional smoothing can be applied to reduce short-term noise
Background coloring highlights bullish (green) and bearish (red) regimes
Use Cases:
GRJMOM > 0 suggests a bullish risk-adjusted trend
GRJMOM < 0 indicates a weakening or bearish trend
Can be used as a trend confirmation filter
Pairs well with cycle indicators like HHT or FFT for timing
Best for:
Swing traders, trend followers, and systematic strategy builders looking for smarter momentum signals with built-in risk awareness
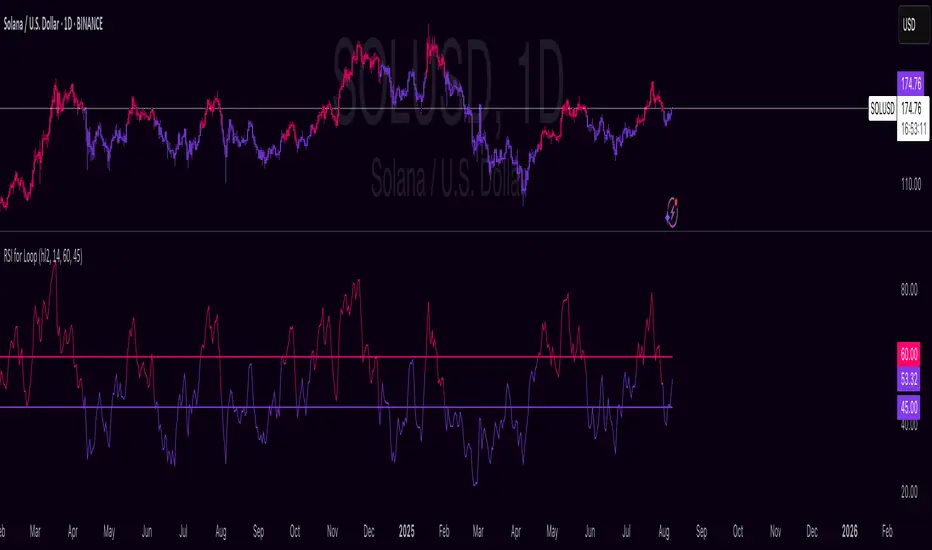
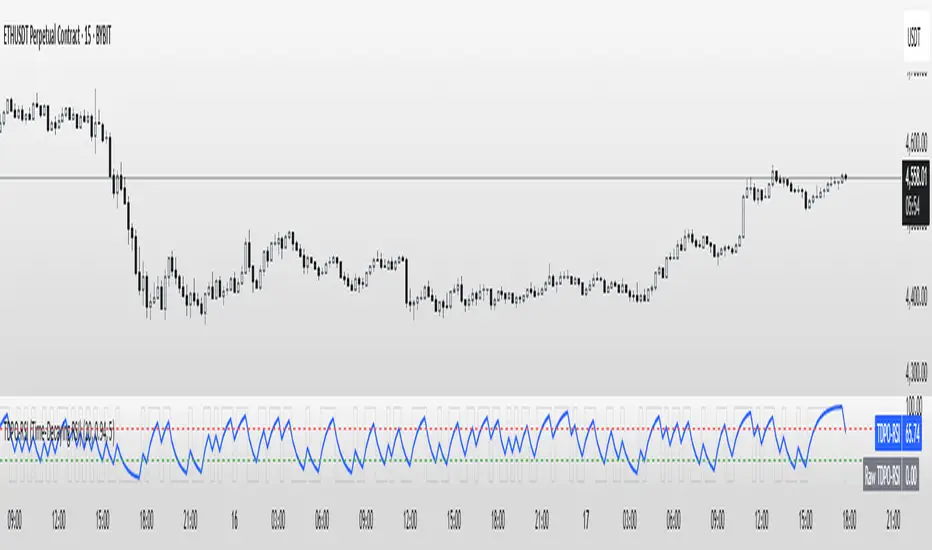
TDPO-RSI (Time-Decaying Percentile RSI)TDPO-RSI (Time-Decaying Percentile RSI)
TDPO-RSI is a modern, statistically-enhanced momentum indicator that improves on traditional RSI by using percentile-based analysis with exponential time decay. Instead of averaging gains and losses equally, this indicator ranks them by size and weights recent data more heavily—resulting in a more responsive and noise-resistant signal.
How it works:
Calculates percentile rank of gains and losses over a lookback window
Applies a decay factor (lambda) to give more weight to recent price action
Outputs a percentile-based RSI value between 0 and 100
Optional smoothing via EMA for clearer crossover signals
Key Uses:
Identify overbought/oversold zones (default: 70/30)
Use raw vs. smoothed RSI crossovers for entries
Detect momentum shifts earlier than traditional RSI
Suitable for scalping, trend continuation, and reversal setups
Inputs:
Lookback Length: Number of bars used for percentile calculation
Decay Factor (lambda): How quickly older data fades in influence (0.80–0.99)
Smoothing EMA: Smooths the final output to reduce noise
Tip: Combine with price structure and volume for best results. Higher timeframes can be used for trend context, while lower timeframes help with precise entries.
This tool is ideal for traders who want adaptive momentum analysis rooted in statistical behavior.
Stochastic MACDStochastic MACD Indicator: Quick Guide
This Pine Script indicator, "Stochastic MACD" (SMACD), blends MACD and Stochastic Oscillator principles to help you spot momentum shifts and potential reversals.
What it Shows:
SMACD Line: Tracks momentum.
Signal Line: Averages the SMACD line, creating crossovers.
Histogram: Visualizes momentum strength, changing color with direction.
Overbought/Oversold Levels: (Default 10 and -10) Help identify stretched market conditions. Adjustable in settings.
Visual Signals (Triangles):
Red Down Arrow (Overbought Signal): Appears when both SMACD and Signal lines are above the Overbought level (default 10) AND SMACD crosses the Signal line upwards. This suggests strong overbought conditions and a potential reversal down.
Green Up Arrow (Oversold Signal): Appears when both SMACD and Signal lines are below the Oversold level (default -10) AND SMACD crosses the Signal line upwards. This suggests potential buying opportunities from oversold conditions and a possible reversal up.
How to Use It:
Confirm Trends: Use the histogram and line directions.
Spot Reversals: Look for the red and green triangles for quick alerts.
Combine: Always use with other analysis like price action or support/resistance.
Important: This is an analytical tool, not financial advice. Trading involves risk.

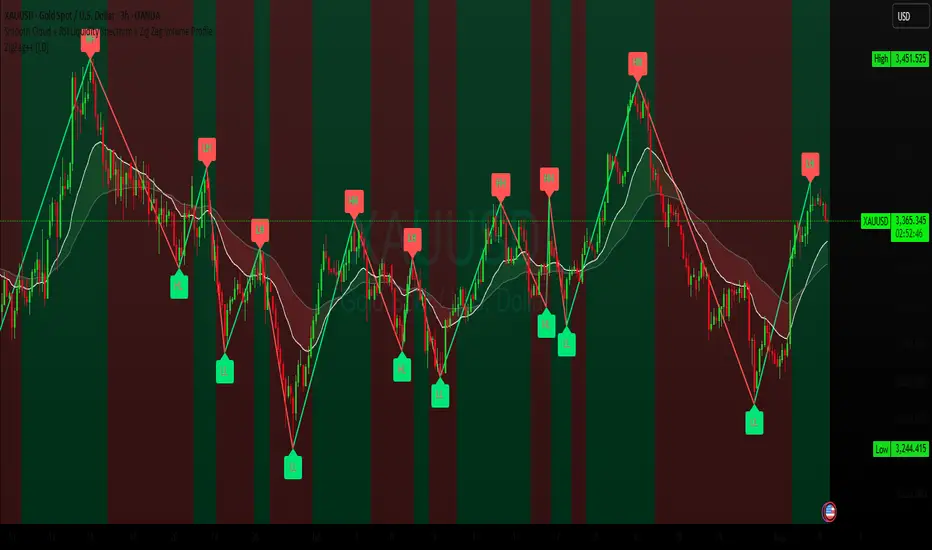
Smooth Cloud + RSI Liquidity Spectrum + Zig Zag Volume ProfileSmooth Cloud + RSI Liquidity Spectrum + Zig Zag++ Volume Profile" Indicator
| Advanced Trend & Liquidity Analysis.
---
📌 Key Features & Enhancements (Zig Zag++)
This advanced indicator combines **trend-following moving averages, RSI momentum with liquidity factors, and an improved Zig Zag++ algorithm with volume profiling** for precise swing detection.
🔹 Zig Zag++ Upgrades:
✅ **Dynamic Reversal Detection** – Adapts to volatility using percentage-based pivots.
✅ **Volume-Weighted Swing Points** – Highlights high-liquidity turning points.
✅ **Multi-Timeframe Confirmation** – Uses historical pivots for stronger signals.
✅ **Volume Profile Clustering** – Reveals key support/resistance zones based on traded volume.
---
📊 Indicator Components Breakdown
1️⃣ Smooth Cloud (Trend Filter)
- **Fast MA (20-period) & Slow MA (50-period)** – Configurable as EMA, SMA, or WMA.
- **Cloud Coloring** – Green when fast MA > slow MA (bullish), red otherwise (bearish).
- **Purpose**: Acts as a trend filter—only take trades in the direction of the cloud.
2️⃣ RSI Liquidity Spectrum (Momentum + Volume)
- **RSI (14-period default)** – Standard momentum oscillator.
- **Liquidity-Adjusted Momentum** = `(RSI + ROC(RSI,3)) * (Volume / SMA(Volume, RSI Length))`
- **Purpose**: Identifies overbought/oversold conditions with volume confirmation (high volume = stronger signal).
3️⃣ Zig Zag++ (Swing Detection & Volume Profiling)
📈 Zig Zag Logic:**
- **Percentage-Based Reversals** (default: 5%) – Only plots swings exceeding this threshold.
- **Pivot Tracking** – Stores price & bar index of each swing point in arrays.
- **Dynamic Line Drawing** – Connects swing points with yellow trendlines.
📊 Volume Profile at Swings:
- **Lookback Period** (200 bars default) – Analyzes volume distribution between Zig Zag turns.
- **10-Price Bin Clustering** – Splits the price range into 10 levels and calculates traded volume at each.
- **Transparency Scaling** – Higher volume zones appear darker (stronger support/resistance).
---
🎯 Step-by-Step Trading Strategies
📈 Strategy 1: Trend-Following with RSI Liquidity Confirmation**
1. **Enter Long** when:
- Smooth Cloud is **green** (fast MA > slow MA).
- RSI Liquidity Momentum crosses above **30** (bullish momentum + volume).
- Price pulls back to the **Volume Profile high-volume zone** (demand area).
2. **Enter Short** when:
- Smooth Cloud is **red** (fast MA < slow MA).
- RSI Liquidity Momentum crosses below **70** (bearish momentum + volume).
- Price rallies into the **Volume Profile high-volume zone** (supply area).
3. **Exit** when:
- Zig Zag++ detects a new reversal (5% move against position).
- RSI Liquidity Momentum crosses back mid-level (50).
---
📉 Strategy 2: Swing Trading with Zig Zag++ Pivots**
1. **Buy at Swing Lows** when:
- Zig Zag++ prints a **higher low** (bullish structure).
- Volume Profile shows **strong absorption** (high volume at the low).
- RSI Liquidity Momentum is rising from oversold (<30).
2. **Sell at Swing Highs** when:
- Zig Zag++ prints a **lower high** (bearish structure).
- Volume Profile shows **distribution** (high volume at the top).
- RSI Liquidity Momentum is falling from overbought (>70).
3. **Stop Loss**:
- Below the recent Zig Zag low (for longs).
- Above the recent Zig Zag high (for shorts).
---
📌 Additional Enhancements (Pro Tips)**
- **Combine with Higher Timeframe (HTF) Cloud** – Use a 4H/1D cloud to filter trades.
- **Divergence Detection** – Hidden bullish/bearish divergences between Zig Zag & RSI Liquidity.
- **Volume Spike Confirmation** – Only trade if volume exceeds SMA(volume, 20) at reversal points.
---
🚀 Conclusion
This **all-in-one indicator** provides:
✔ **Trend direction** (Smooth Cloud)
✔ **Momentum + Liquidity strength** (RSI Spectrum)
✔ **Precise swing points** (Zig Zag++)
✔ **Volume-based S/R zones** (Profile Clustering)
Best used on **15M-4H timeframes** for swing/day trading. Adjust parameters based on asset volatility.
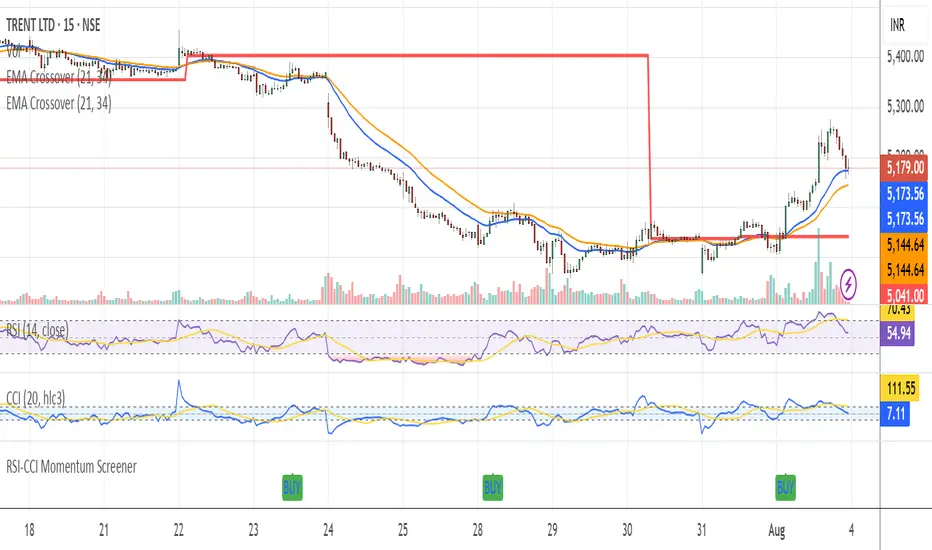
RSI-CCI Momentum ScreenerRSI-CCI Momentum Screener;
How to Use:
Apply this script to 1H or 4H timeframe
Works well for NSE stocks, crypto, or forex
Look for a green label “BUY” that shows when the screener conditions are met
HMA Strategy HMA Strat (Hull Moving Average Strategy) Indicator Description
The HMA Strat is a trend-following strategy that uses a dual Hull Moving Average system. It helps identify continuation and high-probability reversal signals in both bullish and bearish market conditions. The strategy aims to reduce noise while maintaining sensitivity to changes in price momentum by comparing the standard Hull Moving Average (HMA) to a smoothed version.
This strategy is ideal for traders who focus on systematic backtesting, momentum entry, and simple charts. It features integrated plotting, color-zoning, and strategic actions based on TradingView's strategy engine. The system provides dynamic long and short signals based on crossover logic.
Key Features
Dual HMA Framework: To improve signal quality and reduce choppy trend identification, it compares a regular HMA with a smoothed version (HMA3).
Entries Based on Crossover