FREE INDICATOR: CHOPPINESS INDEX "TREND DETECTION FROM CHAOS"About:
The Choppiness Index was created by E.W. Dreiss out of chaos theory, and attempts to gauge the current market's trendiness.
I've seen a few versions of this floating around, but this was built off the true version as described in the original 1993 release, you can read more about it here: www.edwards-magee.com
Usage:
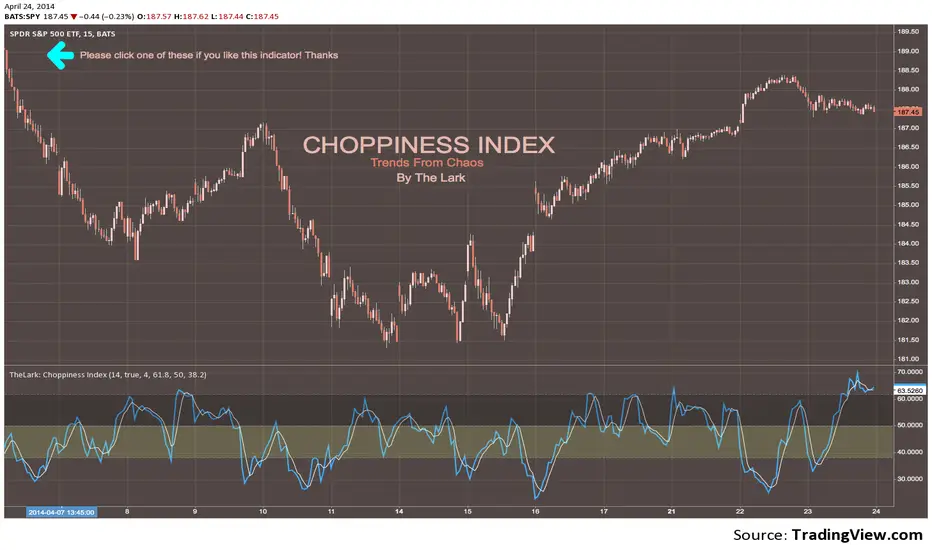
Values above 61.8 are considered very choppy, values below 38.2 are considered very trendy, but values along the entire scale can help you determine position sizing, or even weather you should be getting into this trade or not.
If you are looking for a new way to know weather the market is trending, about to trend, or just going sideways, this very handy indicator for algorithmic trading may be your answer.
Grab the source code here: pastebin.com
Installation video by @ChrisMoody here : blog.tradingview.com
░░░░░░░░░░░░░░░ Feel free to follow me to keep up with my latest scripts! ░░░░░░░░░░░░░░░
░░░░░░░░░░░░ PLEASE THUMB UP OR STAR IF YOU LIKE THIS INDICATOR! ░░░░░░░░░░░░
I'd like as many people as possible to get it :)