Auto Channel [SciQua]Auto Channel
Purpose
Auto Channel finds the single best parallel price channel from recent price action and keeps it updated in real time. It uses ZigZag pivots to build candidate channels, scores each candidate for quality, then plots the winner. When price closes outside the channel, the script flags a breakout and can fire alerts.
How it works
1. ZigZag pivots
The script uses TradingView’s TradingView/ZigZag/7 library to generate a stream of swing highs and lows based on a percentage reversal threshold and a leg depth. These pivots are the only points the channel logic evaluates, which keeps the search fast and focused on structure rather than noise.
2. Channel candidates
From the most recent pivots, the script forms all combinations of two swing highs and two swing lows.
It computes a slope for the high line and a slope for the low line and requires that they be nearly parallel within a user-defined tolerance.
3. Quality scoring and selection
For every valid candidate, the script checks the recent pivot segments against the trial channel and computes:
Inside ratio: fraction of tested pivots that sit fully inside the channel after applying the tolerance buffer.
Violation sum: total magnitude of the breaches for any pivots outside the channel.
Current width: distance between upper and lower lines at the current bar.
The “best” channel is chosen by:
1. highest inside ratio
2. then widest current width
3. then smallest violation sum
4. Plot and projection
The upper and lower lines are anchored to the chosen pivot pairs and extend to the left. The script also projects each line to the current bar to compute the live upper and lower channel prices. Those levels drive the breakout checks and alerts.
5. Breakouts and alerts
A breakout is detected when the bar closes above the projected upper line or closes below the projected lower line, after applying the tolerance buffer. Triangle markers highlight fresh breakouts, and you can enable alert conditions to automate notification or strategy handoff.
Inputs:
ZigZag
Price deviation for reversals (%)
Default 0.2. Larger values produce fewer, larger swings. Smaller values produce more, smaller swings.
Pivot legs
Default 2. Controls the lookback depth ZigZag uses to confirm pivots.
ZigZag Color
Visual only.
Tip: If you are not seeing a stable channel, increase the ZigZag percentage to reduce minor swings.
Channel search
Number of recent pivots to consider
Default 12. Higher values search more history and try more channel combinations. Lower values make the search faster and more reactive.
Max slope difference for parallel
Default 0.0005. Maximum allowed difference between the upper and lower line slopes. Smaller values enforce stricter parallelism.
Max price tolerance outside channel
Default 0.0. A buffer added to the channel boundaries during validation and breakout checks. Use this to ignore tiny wicks that poke the lines.
Minimum inside to outside pivots ratio for valid channel (0.00–1.00)
Default 1.00. Require that at least this fraction of checked pivots lie inside the channel. For a more permissive fit, try 0.60 to 0.85.
Styling
Upper Line Color
Lower Line Color
Breakout Above Color
Breakout Below Color
Plots and visuals
Upper channel line
Lower channel line
Triangle markers on the bar that first confirms a close outside the channel, above or below.
Lines extend left from their pivot anchors. Projection to the current bar is used internally to test for breakouts and to set alerts.
Alerts
The script defines two alert conditions:
Close Above Channel
Triggers when the bar closes above the projected upper line plus tolerance.
Close Below Channel
Triggers when the bar closes below the projected lower line minus tolerance.
Practical usage
Trend channels
In a steady trend, a high inside ratio with a moderate width often highlights the dominant channel. Consider trend entries near the lower line in an uptrend or near the upper line in a downtrend, with exits or stops beyond the opposite boundary.
Breakout trades
Combine the channel breakout alert with volume or a separate momentum filter. The tolerance input helps avoid false triggers from small wicks.
Tuning for timeframe and symbol
• Faster markets or lower timeframes usually benefit from a larger ZigZag percentage and a smaller pivot count.
• Slower markets or higher timeframes can use more pivots and a tighter slope difference to enforce cleaner geometry.
Notes and limitations
Channels are derived from ZigZag pivots. If your ZigZag settings change, the detected channel will also change.
The script plots only the single best channel at any time to keep the chart clean.
Breakout markers appear on confirmed bars. For historical bars, markers appear only where a breakout would have been confirmed at that time.
Lines extend left from their anchors. The script projects the lines internally to the current bar for checks and alerts.
License and attribution
License
Creative Commons Attribution-NonCommercial 4.0 International (CC BY-NC 4.0).
Open source for educational and personal use only. Commercial use requires written permission.
Attribution
© 2025 SciQua — Joshua Danford
Libraries
Uses TradingView/ZigZag/7.
Changelog
v1.0
Initial release. Automatic parallel channel detection from ZigZag pivots, quality scoring, live plotting, and close-based breakout alerts.
FAQ
Why do I not see any channel sometimes?
There may not be a valid pair of highs and lows that pass the slope, inside ratio, and tolerance checks. Loosen the constraints by increasing Max slope difference, lowering Minimum inside ratio, or increasing the ZigZag percentage.
The channel looks too narrow or too wide?
Adjust Number of recent pivots and Minimum inside ratio. A higher inside ratio tends to favor cleaner, sometimes wider channels. A lower ratio may admit narrower, more reactive channels.
How can I reduce false breakout alerts?
Increase Max price tolerance outside channel to ignore small wicks. Add a volume or momentum confirmation in your personal alert workflow.
Thank you for using Auto Channel . Feedback and improvements are welcome.
Chart patterns

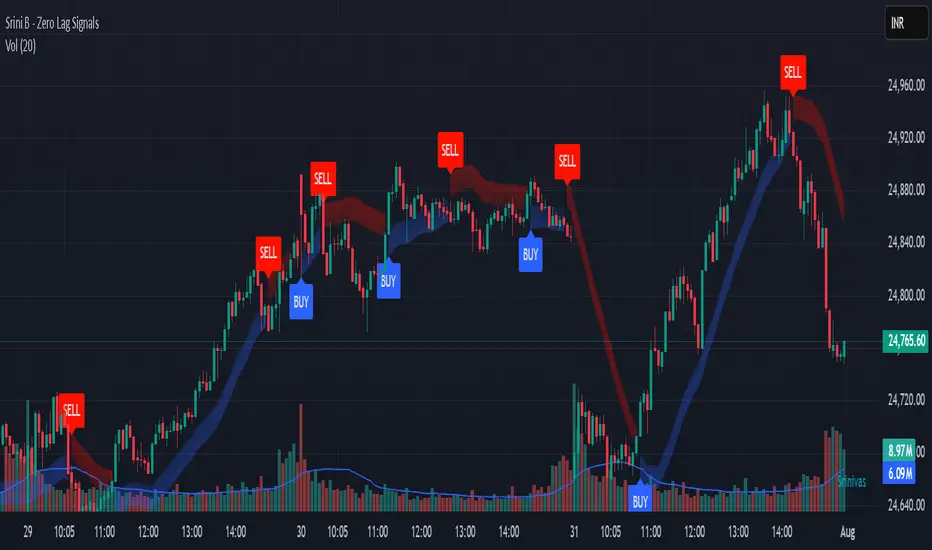
Srini B - Zero Lag Trend SignalsFinal version with minor changes. This indicator displays buy & sell alerts as per settings defined and comes out really well. Just my own personal indicator for own use.
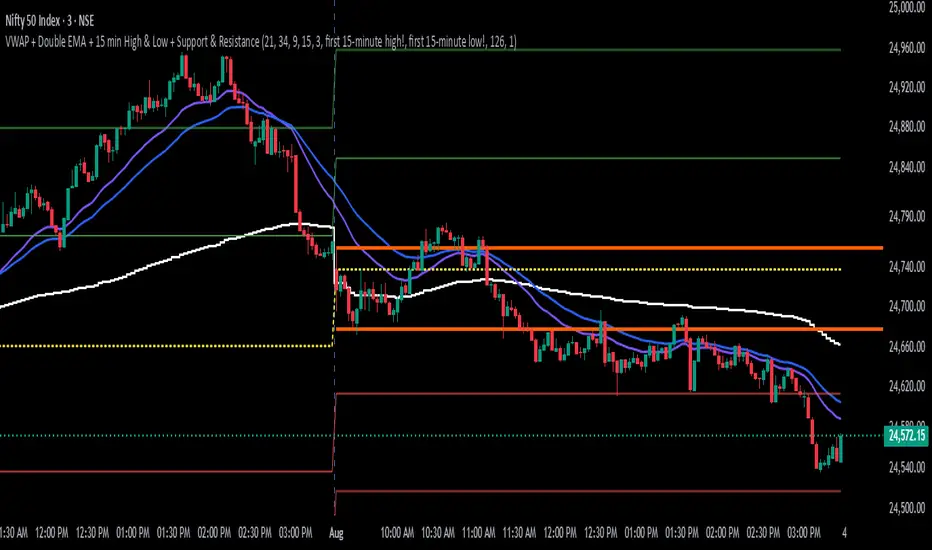
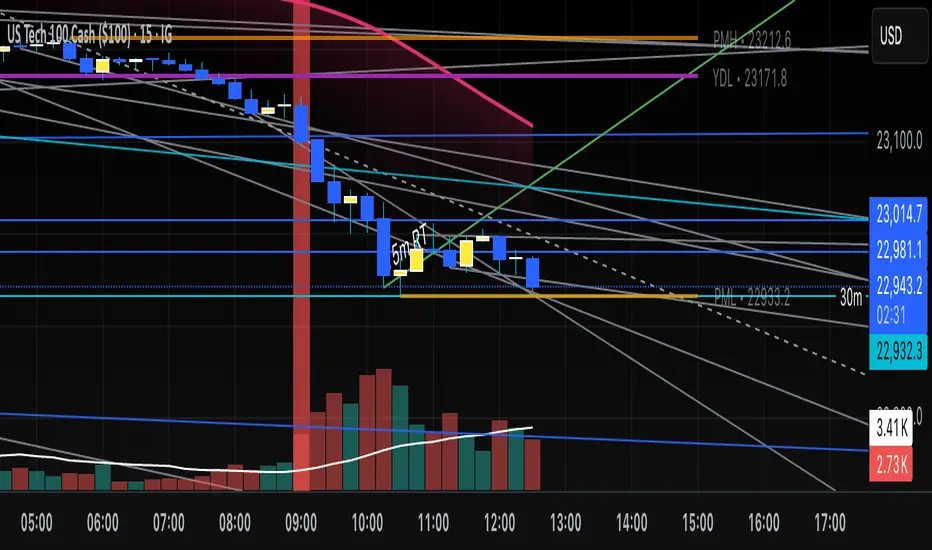
Intraday Smart PlusIntraday Smart Plus
The indicator is for intraday day, shows the below.
1. VWAP
2. Day Open Line
3. First 15 minutes High and Low
4. Support and Resistance Lines
Recommended time frame is 3 minutes
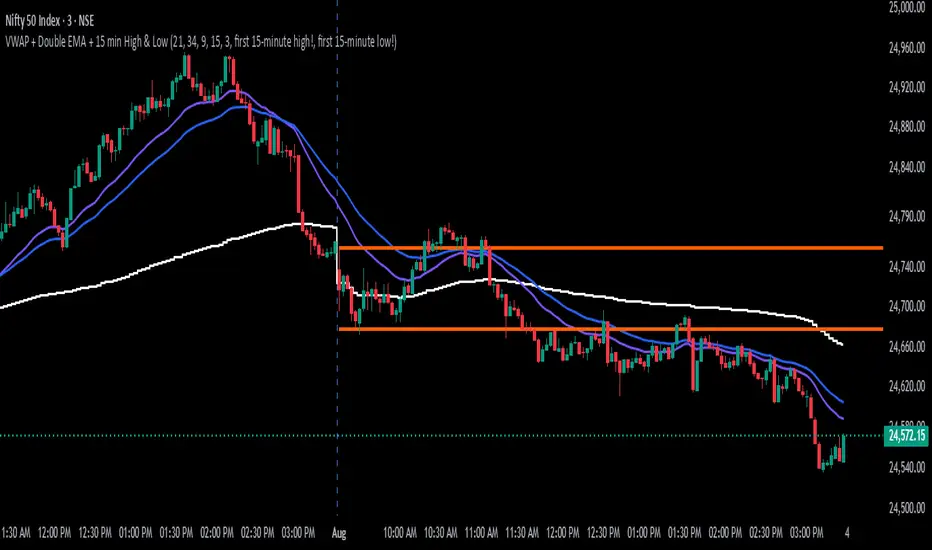
Intraday SmartVWAP + Double EMA + 15 min High & Low
The indicator is for intraday, shows the below.
1. VWAP
2. EMA's
3. First 15 mins High and Low
Recommended time frame is 3 minutes.
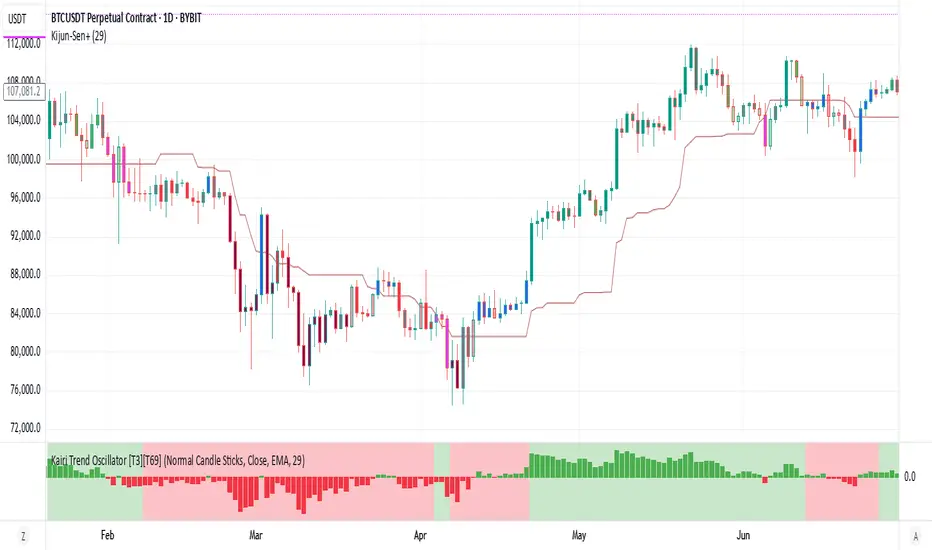
Kairi Trend Oscillator [T3][T69]📌 Overview
The Kairi Trend Oscillator is a Japanese-inspired hybrid oscillator combining Heikin-Ashi trend clarity with the Kairi (乖離率) indicator — a measure of price deviation from a moving average. This dual-layer system gives you both trend direction and trend strength/health, designed to highlight trend maturity and avoid overextended entries.
✨ Features
Heikin-Ashi or normal candlestick input modes
Multiple moving average options: SMA, EMA, DEMA, VWMA, and Kijun
Visual color-coded trend zones: overbought, oversold, healthy, weak, and reversal conditions
Full Kairi column plot with dynamic coloring
Adaptive logic for trend detection (linear regression or Heikin-Ashi structure)
Built-in reversal detection based on divergence between Kairi and trend direction
⚙️ How to Use
Choose Candle Type: Select Heiken Ashi or Normal Candlesticks via the Candle Mode dropdown.
Select Source: Choose open, high, low, or close as the input for Kairi computation.
Set MA Type & Length: Configure the moving average mode and its length under Moving Average Settings.
Interpret the Plot:
Green/Red bars: Show Kairi oscillator values above/below 0
Background color: Shows current trend (green = uptrend, red = downtrend)
Candle color overlays:
🟩 Teal = Overextended Bulls
🟥 Maroon = Overextended Bears
✅ Green = Healthy Uptrend
🔻 Red = Healthy Downtrend
🟨 Light tones = Weak trends
🔄 Blue/Fuchsia = Possible reversal detected
🔧 Configuration
Inputs:
Candle Mode: Heiken Ashi or Normal Candle Sticks
Source: Open, High, Low, Close
MA Mode: SMA, EMA, DEMA, VWMA, or Kijun
MA Length: Default is 29
🧪 Advanced Tips
Use Heikin-Ashi mode for better trend smoothing.
Kairi divergence (e.g., bullish Kairi in a downtrend) may signal upcoming reversal — watch for blue or fuchsia bars.
Combine with momentum indicators (e.g. RSI or MACD) for confluence-based setups.
For mean reversion strategies, fade extreme Kairi readings (> ±5%).
⚠️ Limitations
Not suited for ranging markets without trend.
Kairi extremes may remain elevated in strong trends — avoid early counter-trend entries.
Reversal logic is not a confirmation signal; use with caution.
📌 Disclaimer
This script is educational and illustrative. Always backtest thoroughly before using in live markets.
Golden Launch Pad🔰 Golden Launch Pad
This indicator identifies high-probability bullish setups by analyzing the relationship between multiple moving averages (MAs). A “Golden Launch Pad” is formed when the following five conditions are met simultaneously:
📌 Launch Pad Criteria (all must be true):
MAs Are Tightly Grouped
The selected MAs must be close together, measured using the Z-score spread — the difference between the highest and lowest Z-scores of the MAs.
Z-scores are calculated relative to the average and standard deviation of price over a user-defined window.
This normalizes MA distance based on volatility, making the signal adaptive across different assets.
MAs Are Bullishly Stacked
The MAs must be in strict ascending order: MA1 > MA2 > MA3 > ... > MA(n).
This ensures the short-term trend leads the longer-term trend — a classic sign of bullish structure.
All MAs Have Positive Slope
Each MA must be rising, based on a lookback period that is a percentage of its length (e.g. 30% of the MA’s bars).
This confirms momentum and avoids signals during sideways or weakening trends.
Price Is Above the Fastest MA
The current close must be higher than the first (fastest) moving average.
This adds a momentum filter and reduces false positives.
Price Is Near the MA Cluster
The current price must be close to the average of all selected MAs.
Proximity is measured in standard deviations (e.g. within 1.0), ensuring the price hasn't already made a large move away from the setup zone.
⚙️ Customization Options:
Use 2 to 6 MAs for the stack
Choose from SMA, EMA, WMA, VWMA for each MA
Adjustable Z-score window and spread threshold
Dynamic slope lookback based on MA length
Volatility-adjusted price proximity filter
🧠 Use Case:
This indicator helps traders visually and systematically detect strong continuation setups — often appearing before breakouts or sustained uptrends. It works well on intraday, swing, and positional timeframes across all asset classes.
For best results, combine with volume, breakout structure, or multi-timeframe confirmation.

HMA Strategy HMA Strat (Hull Moving Average Strategy) Indicator Description
The HMA Strat is a trend-following strategy that uses a dual Hull Moving Average system. It helps identify continuation and high-probability reversal signals in both bullish and bearish market conditions. The strategy aims to reduce noise while maintaining sensitivity to changes in price momentum by comparing the standard Hull Moving Average (HMA) to a smoothed version.
This strategy is ideal for traders who focus on systematic backtesting, momentum entry, and simple charts. It features integrated plotting, color-zoning, and strategic actions based on TradingView's strategy engine. The system provides dynamic long and short signals based on crossover logic.
Key Features
Dual HMA Framework: To improve signal quality and reduce choppy trend identification, it compares a regular HMA with a smoothed version (HMA3).
Entries Based on Crossover
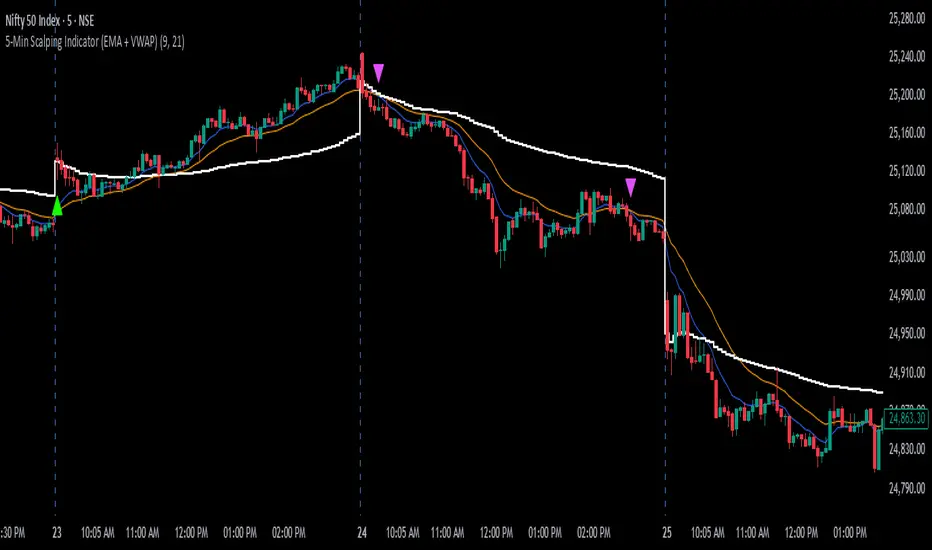
5-Min Scalping Indicator (EMA + VWAP)5-Min Scalping Indicator (EMA + VWAP)
Strategy Logic (for 5-min timeframe):
Long Entry: Price above VWAP, EMA Fast crosses above EMA Slow.
Short Entry: Price below VWAP, EMA Fast crosses below EMA Slow.
Exit: On opposite EMA cross or trailing stop (optional for strategy).
How to Use:
Apply this on a 5-minute chart.
Look for buy signals when:
Fast EMA crosses above Slow EMA.
Price is above VWAP.
Look for sell signals when:
Fast EMA crosses below Slow EMA.
Price is below VWAP.
Combine with price action or volume confirmation for best results.
GOALZONE INDIWhy Use the "GOALZONE INDI" Indicator?
Are you looking for a reliable tool to enhance your gold trading strategy?
Introducing "GOALZONE INDI", a smart and easy-to-use indicator specifically designed to help traders make informed decisions in the gold market.
What Makes "GOALZONE INDI" Stand Out?
* Tailored for Gold (XAUUSD):
Specially optimized to detect crucial trend changes in gold prices, offering you timely signals to buy or sell.
* Precise Entry Points:
Uses smart moving average crossovers to identify the best moments for entry and exit, reducing guessing and improving profitability.
* Real-Time Alerts:
Get instant notifications when buy or sell signals occur—whether you're at your desk or on the go. Never miss a critical trading opportunity again!
* Easy to Use:
Clear visual signals on your chart show exactly when the market is favorable, perfect for both beginners and experienced traders.
* Ideal for Short-Term Trading:
Designed to generate signals on 1-minute charts, helping you capitalize on quick market movements in the fast-paced gold market.
Why Trader's Love It:
* Increase Confidence:
Making trade decisions becomes easier with accurate signals specific to gold trends.
* Save Time:
Automate your analysis—spend less time guessing and more time trading confidently.
* Maximize Profits:
Spot those crucial moments when the price movement is about to turn, giving you a competitive edge.
Start Using "GOALZONE INDI" Today!
Whether you're looking to refine your short-term trading strategy or want a trustworthy tool to guide your trades in gold markets, "GOALZONE INDI" is the perfect addition to your trading arsenal. Try it now and watch your trading confidence and results improve!

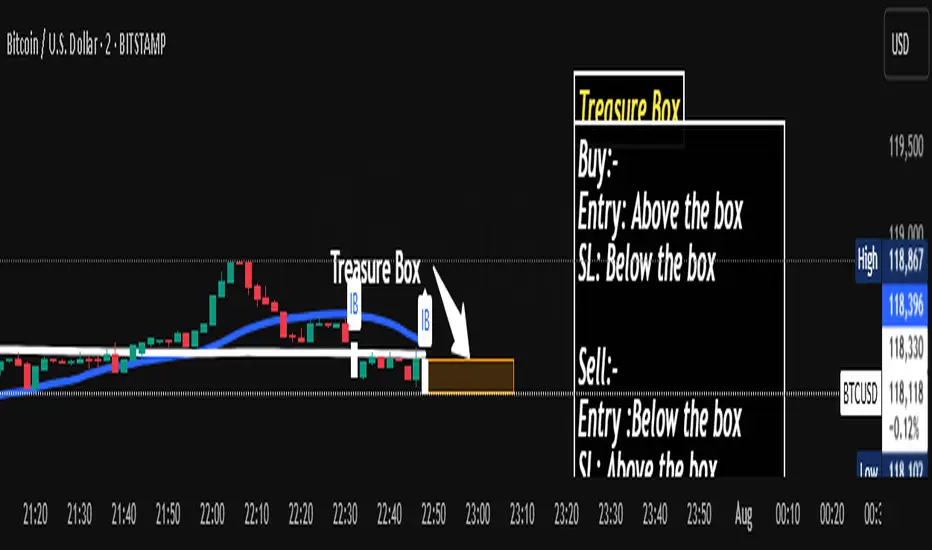
Wx2 Treasure Box – Institutional EntryBuy:-
Entry: Above the box
SL: Below the box
Sell:-
Entry :Below the box
SL: Above the box
RRR: 1:2
Best Location near 200MA
TF: Any TF
Watch My Video:
youtu.be
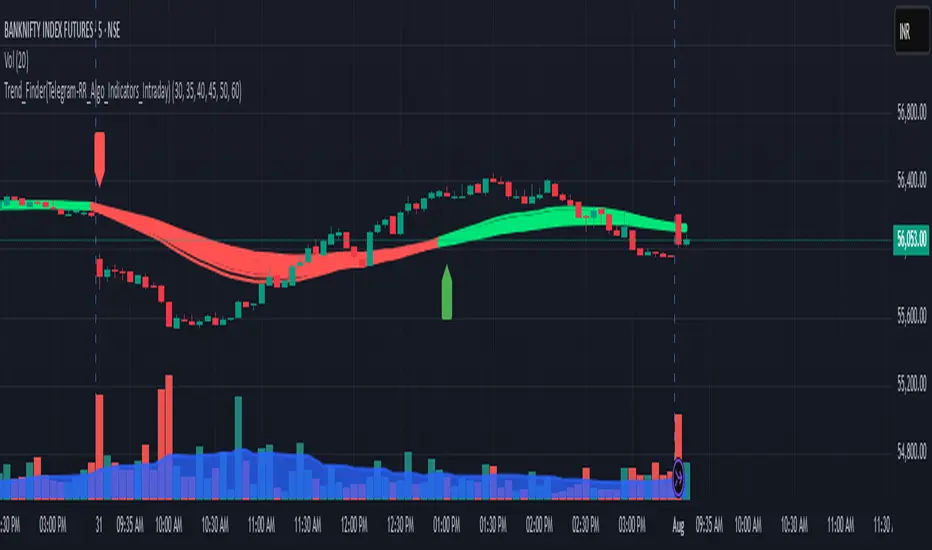
Trend_Finder(Telegram-RR_Algo_Indicators_Intraday)EMA Inputs
It uses 6 EMAs with customizable lengths (defaults: 30, 35, 40, 45, 50, 60).
Trend Conditions
Bullish Trend: All EMAs are strictly ordered from smallest to largest, meaning short-term prices are leading long-term prices upward.
Bearish Trend: All EMAs are ordered from largest to smallest, meaning short-term prices are falling below long-term ones.
Neutral: EMAs are mixed and do not meet the above criteria.
Trend Tracking
The script remembers the current trend and only flips when a full trend reversal condition is confirmed.
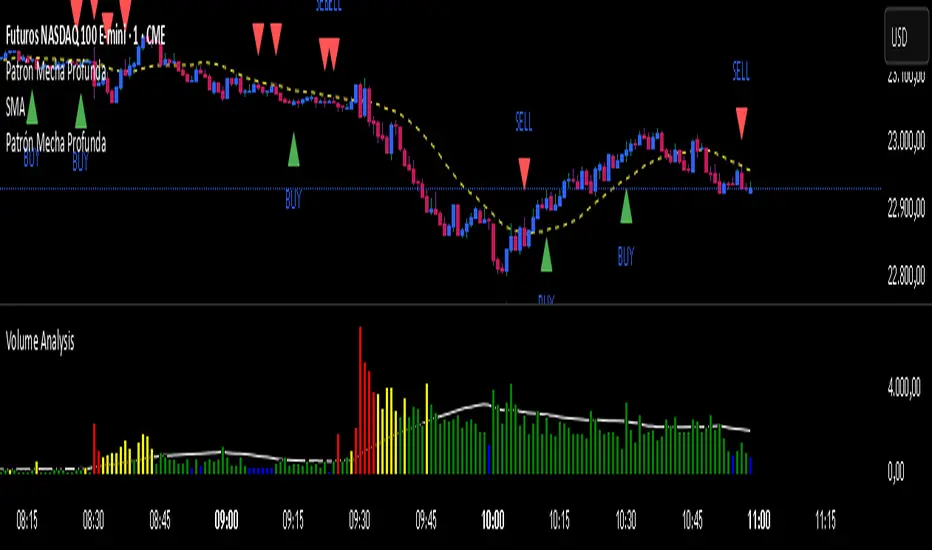
Patrón Mecha ProfundaThis pattern must be combined with a 20-period moving average. It is used to know the direction of the price. When the pattern appears and the price is above the 20-period moving average, it is a bullish signal and vice versa.
Midnight OpenMidnight Opening Price because there wasn't a single indicator that was specifically marking this.

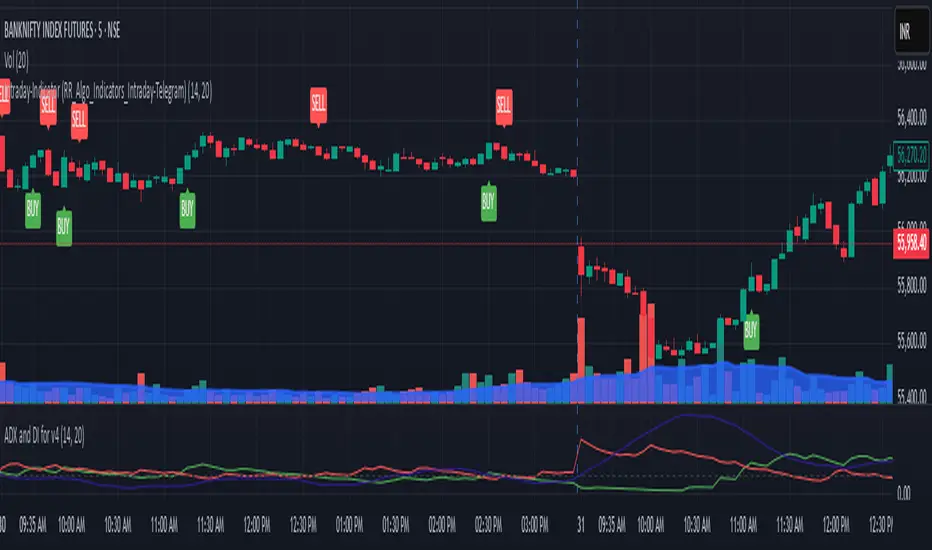
Buy/Sell Labels-RR_AlgoAI (Telegram-RR_Algo_Indicators_Intraday)This indicator uses the Trend Movement to identify shifts in market trend. When the positive movement crosses above the negative, it signals a potential bullish move and marks the chart with a "BUY" label along with a green trend line from the candle's low. Conversely, when Negative movement crosses above Positive Movement, it signals bearish potential, showing a "SELL" label and a red trend line from the candle's high. It also plots the smoothed difference between to show trend strength.

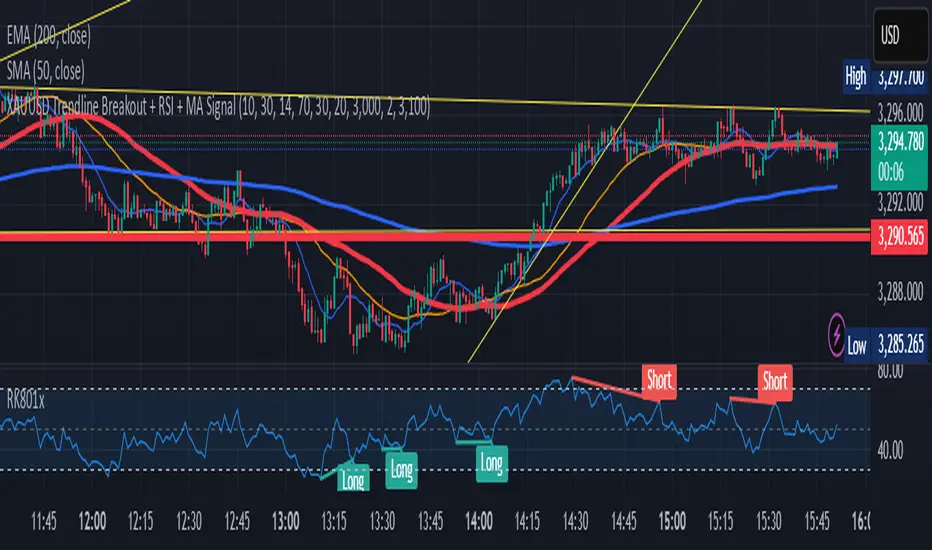
XAUUSD Trendline Breakout + RSI + MA Signal//@version=5
indicator("XAUUSD Trendline Breakout + RSI + MA Signal", overlay=true)
// --- Inputs ---
lengthFast = input.int(10, title="Fast MA Length")
lengthSlow = input.int(30, title="Slow MA Length")
rsiLength = input.int(14, title="RSI Length")
rsiOverbought = input.int(70, title="RSI Overbought Level")
rsiOversold = input.int(30, title="RSI Oversold Level")
// --- Moving Averages ---
fastMA = ta.sma(close, lengthFast)
slowMA = ta.sma(close, lengthSlow)
// --- RSI ---
rsi = ta.rsi(close, rsiLength)
// --- Trendline (Manual input) ---
// Use fixed default price values here, change manually based on your chart.
trend_x1 = input.int(20, title="Trendline Point 1 X (bars ago)")
trend_y1 = input.float(3000.0, title="Trendline Point 1 Y (price)") // constant default
trend_x2 = input.int(2, title="Trendline Point 2 X (bars ago)")
trend_y2 = input.float(3100.0, title="Trendline Point 2 Y (price)") // constant default
bar_idx1 = bar_index - trend_x1
bar_idx2 = bar_index - trend_x2
trendline_y_value(bar) =>
m = (trend_y2 - trend_y1) / (bar_idx2 - bar_idx1)
c = trend_y1 - m * bar_idx1
m * bar + c
trend_y_curr = trendline_y_value(bar_index)
trend_y_prev = trendline_y_value(bar_index - 1)
// --- Signals ---
// Trendline breakout
buyBreakout = (close < trend_y_prev) and (close > trend_y_curr)
sellBreakout = (close > trend_y_prev) and (close < trend_y_curr)
// MA crossover
maBuy = ta.crossover(fastMA, slowMA)
maSell = ta.crossunder(fastMA, slowMA)
// RSI confirmation
rsiBuy = rsi < rsiOversold
rsiSell = rsi > rsiOverbought
// Final buy/sell signal with all conditions
buySignal = buyBreakout and maBuy and rsiBuy
sellSignal = sellBreakout and maSell and rsiSell
// --- Plot ---
plot(fastMA, color=color.blue, title="Fast MA")
plot(slowMA, color=color.orange, title="Slow MA")
plotshape(buySignal, title="Buy Signal", location=location.belowbar, color=color.green, style=shape.labelup, text="BUY")
plotshape(sellSignal, title="Sell Signal", location=location.abovebar, color=color.red, style=shape.labeldown, text="SELL")
// Plot trendline
var line trendLine = na
if barstate.islast
if na(trendLine)
trendLine := line.new(bar_idx1, trend_y1, bar_idx2, trend_y2, color=color.yellow, width=2)
else
line.set_xy1(trendLine, bar_idx1, trend_y1)
line.set_xy2(trendLine, bar_idx2, trend_y2)
// --- Alerts ---
alertcondition(buySignal, title="Buy Alert", message="XAUUSD Buy Signal")
alertcondition(sellSignal, title="Sell Alert", message="XAUUSD Sell Signal")
EMA 8 & 21 crossover change EMA 8 & 21 crossover change Indicator This custom TradingView indicator highlights trend shifts by changing candle colors when the 8 EMA crosses the 21 EMA. Bullish crossovers turn candles different color, while bearish crossovers turns different as well—making it easy to visually identify emerging trends and momentum shifts in real time.

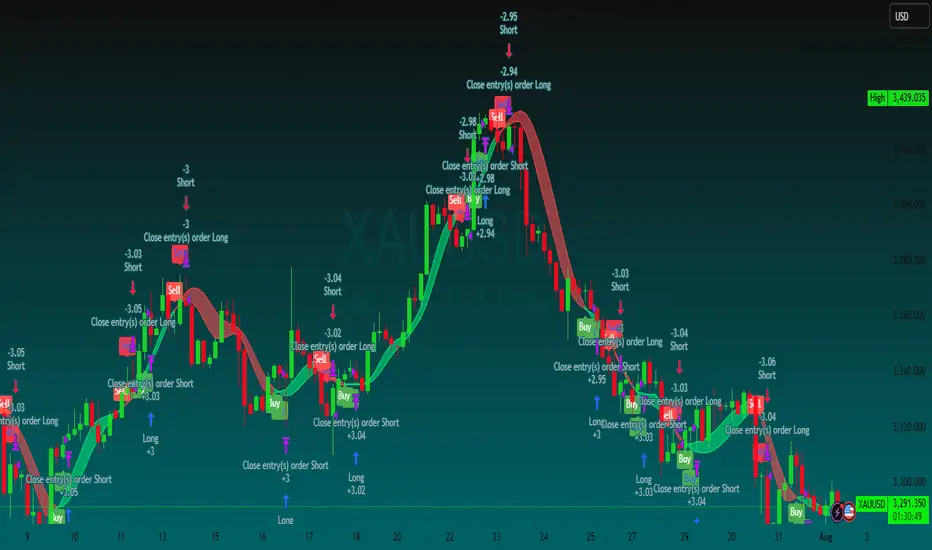
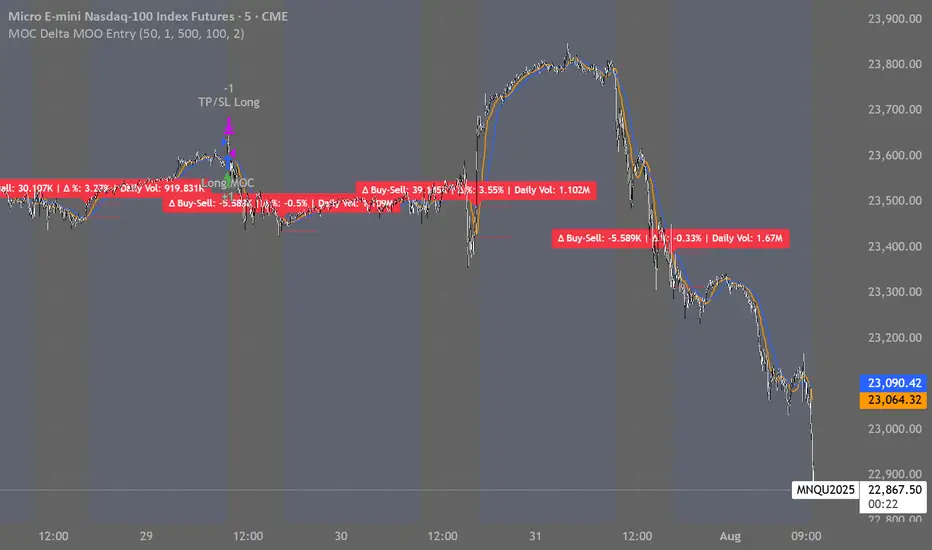
MOC Delta MOO Entry
This model is a momentum-based futures strategy that uses the buy/sell delta during the MOC window (3:50–3:59 EST) to determine market sentiment. If the MOC delta exceeds a customizable percentage of total daily volume, a trade is triggered at the next day’s 9:30 open, but only if the price opens above or below the 15 and 30 SMAs (for long or short entries, respectively). All trades are exited at 3:50 PM EST on the same day.
Trailing TP Bot • Crossover-based Trend Strategy using two simple moving averages (SMAs)
• Includes Take Profit and optional Trailing Take Profit
• Trades both long and short
• No pyramiding, i.e., one position at a time

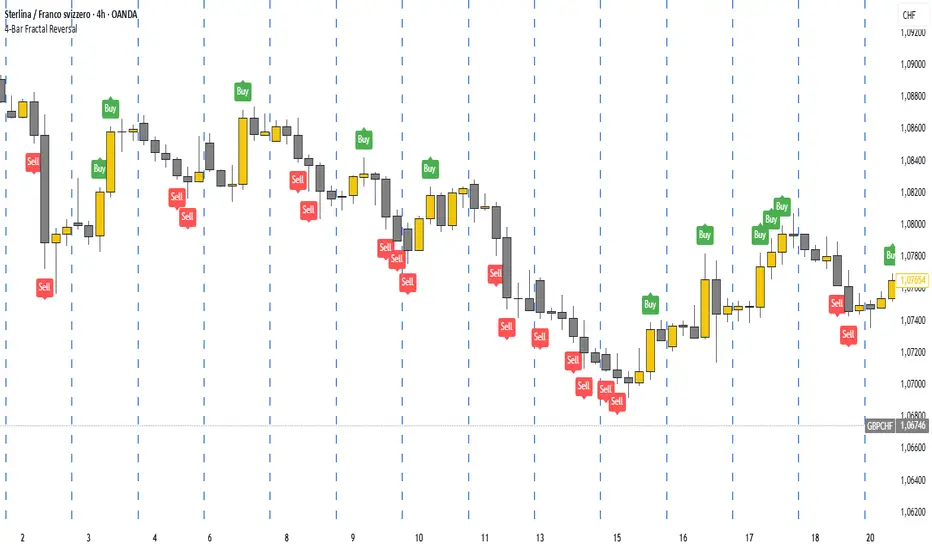
4-Bar Fractal ReversalTitle: 4-Bar Fractal Reversal
Description:
The "4-Bar Fractal Reversal" is a clean and effective tool for identifying potential market reversals based on pure price action logic.
📈 How It Works:
This indicator scans for a 4-bar fractal pattern where the current candle (bar 0) acts as the confirmation bar. A reversal signal is generated when:
Bullish Reversal (Buy): The current close is higher than both the high of 1 bar back and the high of 3 bars back.
Bearish Reversal (Sell): The current close is lower than both the low of 1 bar back and the low of 3 bars back.
⚙️ Features:
Works on any timeframe.
Customizable display: choose to show or hide symbols and/or labels.
Includes alerts for both bullish and bearish setups.
This tool allows traders to react only after confirmation, reducing false signals and providing a more disciplined approach to reversal trading.
Indicator born following the viewing of the following video.
www.youtube.com
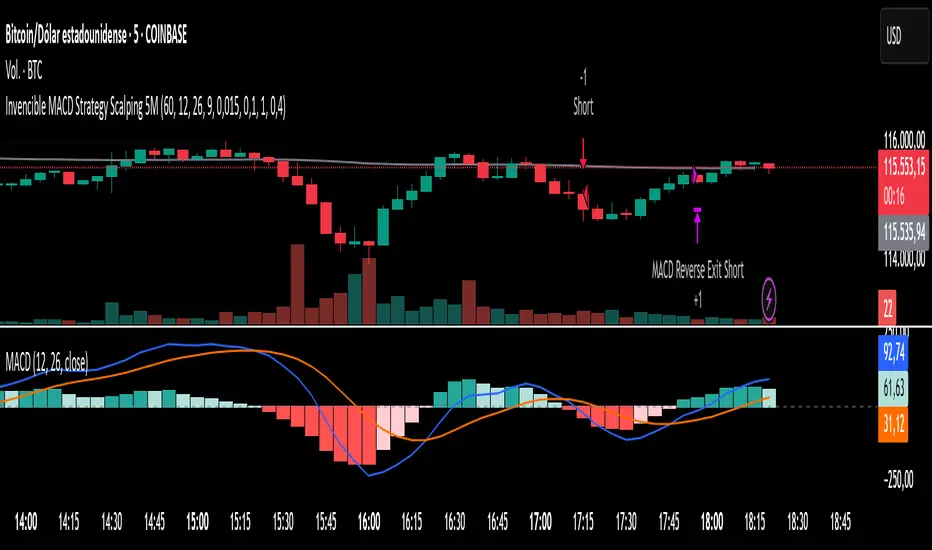
Invencible MACD Strategy Scalping 5MInvencible MACD Strategy Scalping 5M
The Invencible MACD Strategy is a precision scalping system designed for short-term traders who want to capture fast and effective entries on trending moves.
This strategy uses a multi-timeframe MACD combined with a histogram impulse filter, ATR-based volatility filter, and optional EMA200 trend confirmation to identify high-probability trade setups.
Entry Conditions:
Long Entry: When MACD crosses above Signal Line, histogram rises with sufficient impulse, ATR confirms volatility, and price is above EMA200 (optional).
Short Entry : When MACD crosses below Signal Line, histogram falls with sufficient impulse, ATR confirms volatility, and price is below EMA200 (optional).
Exit Conditions:
Take Profit and Stop Loss are calculated as fixed percentages.
A position is also closed immediately if MACD reverses and crosses in the opposite direction.
The strategy does not use trailing stops, allowing trades to fully reach their target when conditions are favorable.
Recommended use:
This strategy is optimized for 5-minute charts and works particularly well with:
XAUUSD (Gold)
BTCUSD (Bitcoin)
If you find this strategy helpful, please share it, leave a comment, and drop a like. Scalpers, give it a try and let us know how it works for you.
Los 7 Capitales