EMA Cross Approach ScreenerWorks best on D/4H. Signals when the price of a stock is below the 200ema and the 9 and 20 are sloping up approaching the 200 while being 5% or less than from the 200. Helps the trader find a good buying point while keeping risk minimum.
Chart patterns

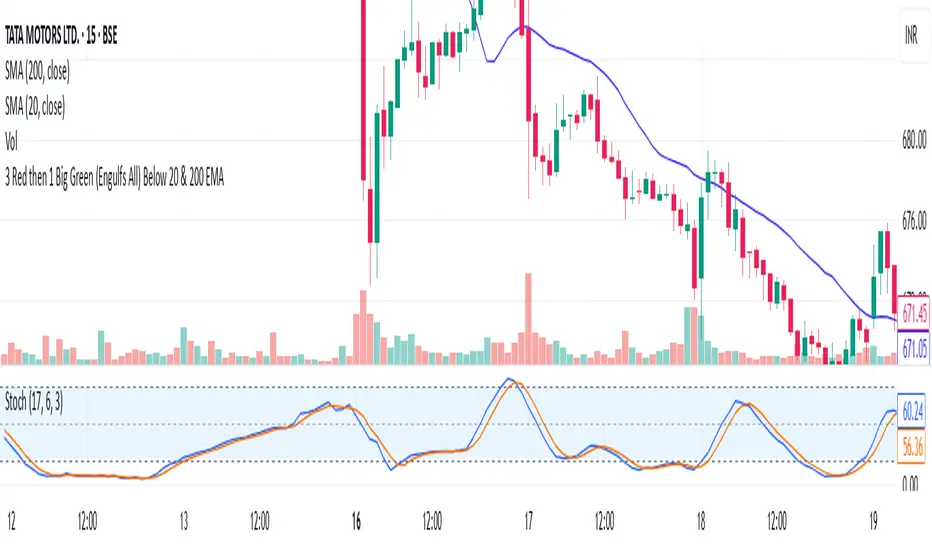
3 Red then 1 Big Green (Engulfs All) Below 20 & 200 EMAIt will tell if green canlde is big enough to engulf 3 red
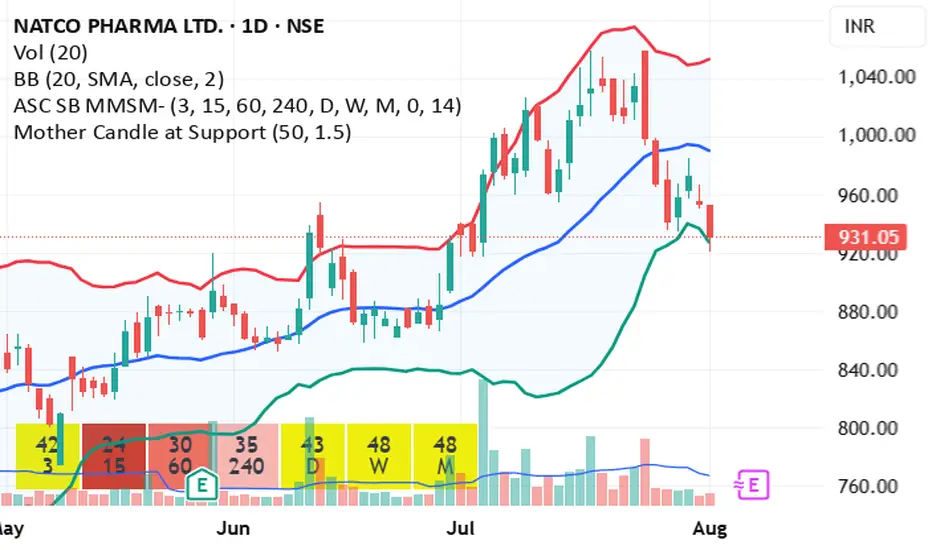
Mother Candle at Support//@version=5
indicator("Mother Candle at Support", overlay=true)
length = input.int(50, title="Support Lookback")
bodyRatio = input.float(1.5, title="Body vs Avg Body Ratio")
// Calculate body size and average
candleSize = high - low
avgBody = ta.sma(high - low, 10)
// Identify Mother Candle (large range)
mother = candleSize > (avgBody * bodyRatio)
// Inside candles (1 or 2)
inside1 = high < high and low > low
inside2 = high < high and low > low
// Price near recent support (swing low)
swingLow = ta.lowest(low, length)
nearSupport = close <= swingLow * 1.03
// Combine all
signal = mother and (inside1 or inside2) and nearSupport
// Plot signal on chart
plotshape(signal, title="Mother Candle at Support", location=location.belowbar, color=color.green, style=shape.labelup, text="MC-S")
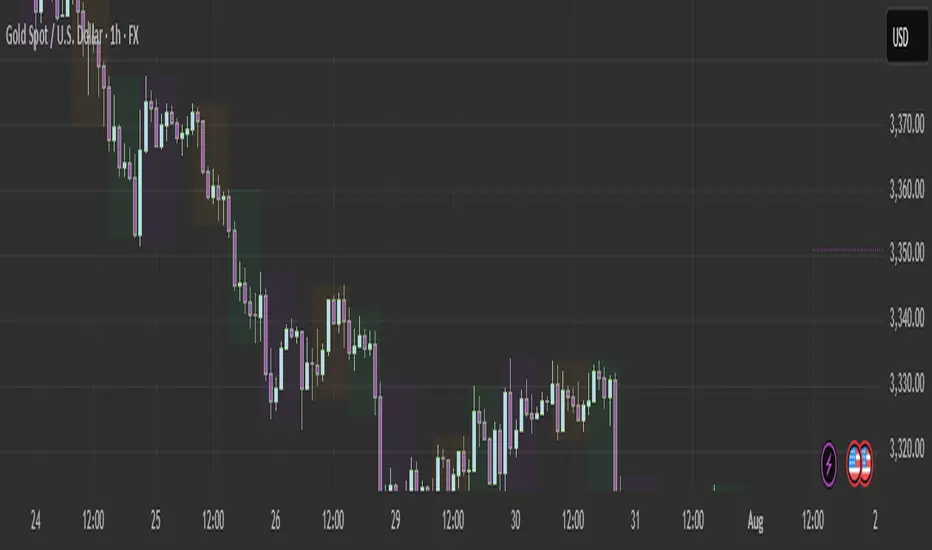
XAUUSD Trendline Breakout + RSI + MA Signal//@version=5
indicator("XAUUSD Trendline Breakout + RSI + MA Signal", overlay=true)
// --- Inputs ---
lengthFast = input.int(10, title="Fast MA Length")
lengthSlow = input.int(30, title="Slow MA Length")
rsiLength = input.int(14, title="RSI Length")
rsiOverbought = input.int(70, title="RSI Overbought Level")
rsiOversold = input.int(30, title="RSI Oversold Level")
// --- Moving Averages ---
fastMA = ta.sma(close, lengthFast)
slowMA = ta.sma(close, lengthSlow)
// --- RSI ---
rsi = ta.rsi(close, rsiLength)
// --- Trendline (Manual input) ---
// Use fixed default price values here, change manually based on your chart.
trend_x1 = input.int(20, title="Trendline Point 1 X (bars ago)")
trend_y1 = input.float(3000.0, title="Trendline Point 1 Y (price)") // constant default
trend_x2 = input.int(2, title="Trendline Point 2 X (bars ago)")
trend_y2 = input.float(3100.0, title="Trendline Point 2 Y (price)") // constant default
bar_idx1 = bar_index - trend_x1
bar_idx2 = bar_index - trend_x2
trendline_y_value(bar) =>
m = (trend_y2 - trend_y1) / (bar_idx2 - bar_idx1)
c = trend_y1 - m * bar_idx1
m * bar + c
trend_y_curr = trendline_y_value(bar_index)
trend_y_prev = trendline_y_value(bar_index - 1)
// --- Signals ---
// Trendline breakout
buyBreakout = (close < trend_y_prev) and (close > trend_y_curr)
sellBreakout = (close > trend_y_prev) and (close < trend_y_curr)
// MA crossover
maBuy = ta.crossover(fastMA, slowMA)
maSell = ta.crossunder(fastMA, slowMA)
// RSI confirmation
rsiBuy = rsi < rsiOversold
rsiSell = rsi > rsiOverbought
// Final buy/sell signal with all conditions
buySignal = buyBreakout and maBuy and rsiBuy
sellSignal = sellBreakout and maSell and rsiSell
// --- Plot ---
plot(fastMA, color=color.blue, title="Fast MA")
plot(slowMA, color=color.orange, title="Slow MA")
plotshape(buySignal, title="Buy Signal", location=location.belowbar, color=color.green, style=shape.labelup, text="BUY")
plotshape(sellSignal, title="Sell Signal", location=location.abovebar, color=color.red, style=shape.labeldown, text="SELL")
// Plot trendline
var line trendLine = na
if barstate.islast
if na(trendLine)
trendLine := line.new(bar_idx1, trend_y1, bar_idx2, trend_y2, color=color.yellow, width=2)
else
line.set_xy1(trendLine, bar_idx1, trend_y1)
line.set_xy2(trendLine, bar_idx2, trend_y2)
// --- Alerts ---
alertcondition(buySignal, title="Buy Alert", message="XAUUSD Buy Signal")
alertcondition(sellSignal, title="Sell Alert", message="XAUUSD Sell Signal")
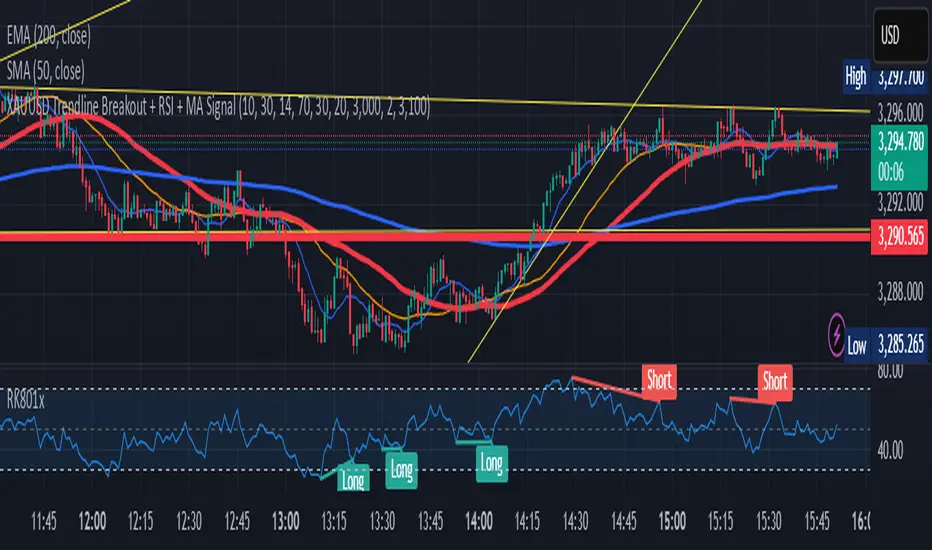
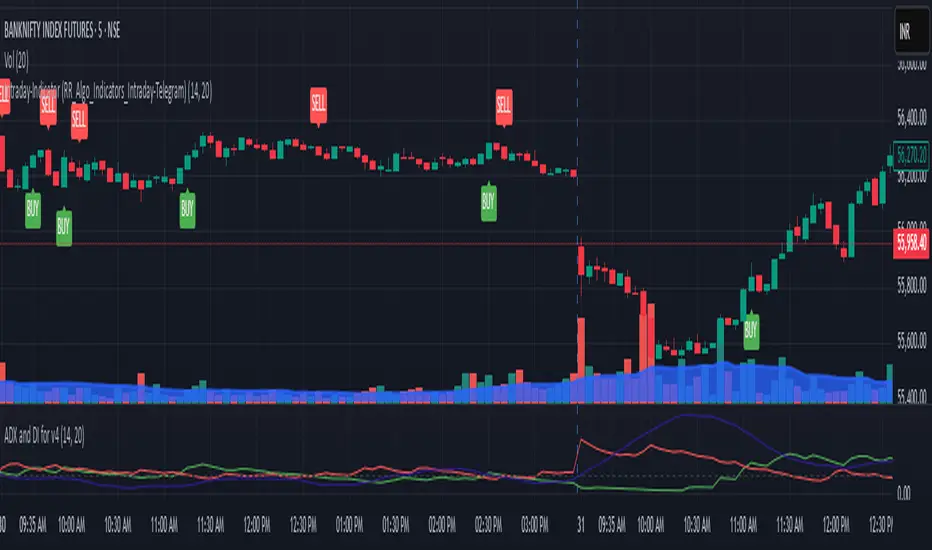
Buy/Sell Labels-RR_AlgoAI (Telegram-RR_Algo_Indicators_Intraday)This indicator uses the Trend Movement to identify shifts in market trend. When the positive movement crosses above the negative, it signals a potential bullish move and marks the chart with a "BUY" label along with a green trend line from the candle's low. Conversely, when Negative movement crosses above Positive Movement, it signals bearish potential, showing a "SELL" label and a red trend line from the candle's high. It also plots the smoothed difference between to show trend strength.
Invencible MACD Strategy Scalping)Invencible MACD Strategy
The Invencible MACD Strategy is a refined scalping system designed to deliver consistent profitability by optimizing the classic MACD indicator with trend and volatility filters. This strategy is built for short-term traders looking for precision entries and favorable risk-to-reward conditions on any asset and lower timeframes such as 1m, 5m, or 15m.
Core Logic
This strategy uses a multi-timeframe (MTF) approach to calculate the MACD, Signal Line, and Histogram. Trades are executed when all of the following conditions are met:
Long Entry:
The MACD crosses above the Signal Line.
The Histogram is rising with a defined impulse threshold.
Price is above the 200 EMA, confirming an uptrend.
Volatility, measured by ATR, is above a configurable minimum.
Short Entry:
The MACD crosses below the Signal Line.
The Histogram is falling with a defined impulse threshold.
Price is below the 200 EMA, confirming a downtrend.
ATR confirms sufficient volatility.
Risk Management
Take Profit is set higher than Stop Loss to ensure that the average winning trade is greater than the average losing trade.
Trailing stop is optional and can be disabled to allow full profit capture on strong moves.
Trade size is fixed to 1 contract, suitable for scalping with low exposure.
Customizable Parameters
MACD Fast, Slow, and Signal EMAs
Histogram impulse threshold
Minimum ATR filter
Take Profit and Stop Loss percentage
Trailing Stop activation and size
Timeframe resolution (can be customized or synced with chart)
Visual Aids
MACD and Signal Line are plotted below price.
Histogram bars help visualize momentum strength.
200 EMA is plotted on the main chart to show trend direction.
This strategy was designed to prioritize quality over quantity, avoiding weak signals and improving both the win rate and profit factor. It is especially effective on assets like gold (XAUUSD), indices, cryptocurrencies, and high-liquidity stocks.
Feel free to test and optimize parameters based on your trading instrument and timeframe.
Los 7 Capitales


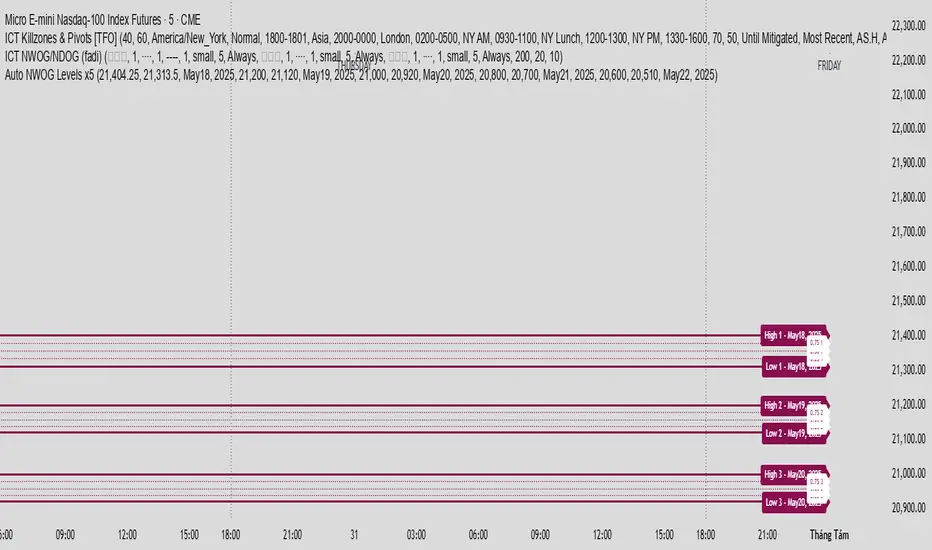
Auto NWOG Levels x5Indicator Name: Auto NWOG Levels with Labels
Description:
This indicator automatically plots the NWOG (Naked Weekly Open Gap) price levels on your chart. It includes:
NWOG High & Low: Solid maroon lines representing the high and low boundaries of the NWOG zone.
Intermediate Levels: Dotted maroon lines at 25%, 50%, and 75% levels within the NWOG range, providing visual guidance for possible support/resistance zones.
Labels: Each level is labeled on the right side of the chart, including a customizable date label for context.
Extendable Lines: All lines extend horizontally for a customizable number of bars (default: 500 bars) for better visibility over time.
Inputs:
NWOG High: Price level of the NWOG high.
NWOG Low: Price level of the NWOG low.
Date Label: Text to be displayed on the labels (e.g., the week of the NWOG).
This tool is useful for traders who monitor weekly price gaps and want clear, persistent levels drawn automatically on their charts.
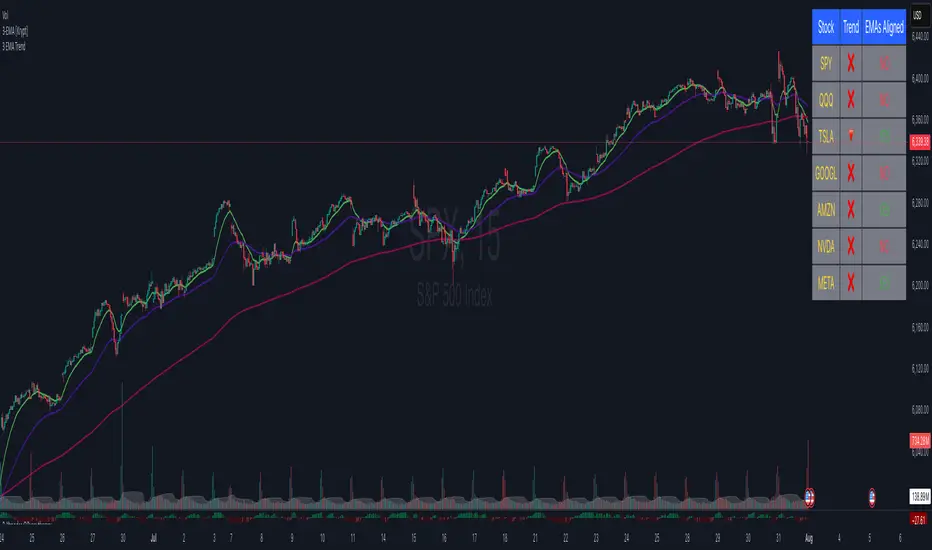
3 EMA cross overThis Pine Script displays the 3 EMA trend status for a list of popular stocks in a dynamic table. It calculates and monitors 13 EMA, 48 EMA, and 200 EMA for each ticker to detect bullish or bearish alignment.
Best Use:
Use this script to quickly scan market trends across multiple stocks and identify potential trade opportunities based on EMA alignment.
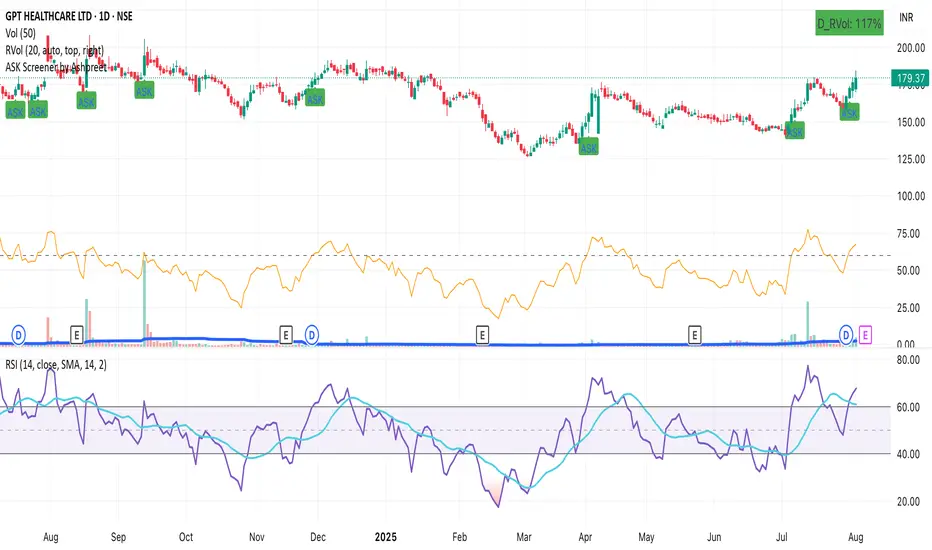
ASK Screener by AshpreetThe ASK Indicator is a custom-built breakout and trend continuation system designed for swing traders seeking high-probability entries with strong risk-reward ratios. Built using a combination of moving averages, momentum filters, volume confirmation, and price structure, this indicator helps identify stocks poised for explosive moves.
It uses three key moving averages: the 44-period SMA (medium trend), 20-period DEMA (short-term strength, custom-coded), and 50-period WEMA (institutional trendline). Trades are only triggered when the price is above 50 WEMA, and the 20 DEMA is above the 44 SMA.
Momentum is confirmed using RSI(14) within a healthy zone of 40–60, ensuring the stock is not overbought or oversold. To focus on breakout candidates, the stock must be trading within 10% of its 52-week high, and the weekly candle range must be under 10%, signaling compression before expansion.
A valid ASK Signal occurs when these conditions are met along with a breakout above the previous day’s high and volume exceeding 1.5× the 20-day average. Once triggered, the indicator auto-plots the stop-loss (1× ATR) and two profit targets: 1:2 (TP1) and 1:4 (TP2).
Additionally, the system detects a narrow range setup, where the last 3 daily candles are inside the previous 3-day range — a powerful consolidation signal. Alerts for both ASK entries and narrow ranges are included.
This system is ideal for positional and short-term swing traders who want to combine structure, momentum, and volume in one powerful tool.

RSI Z‑Score + TableRSI Z-Score + Table
This script calculates the Z-Score of the RSI (Relative Strength Index), which standardizes RSI based on its own recent history.
What It Shows:
RSI Z-Score = (Current RSI - Mean RSI) / Standard Deviation
This tells you how extreme the current RSI is compared to its historical values.
A table displays:
Current RSI
Rolling Mean
RSI Z-Score
How to Use:
Z-Score > +2 = Statistically overbought
Z-Score < -2 = Statistically oversold
Use it to time reversals or overextension in RSI behavior.
🔒 Based on rolling lookback window — fully customizable.
Author:
Tags: #RSI #ZScore #Momentum #StatisticalEdge #MeanReversion #Crypto

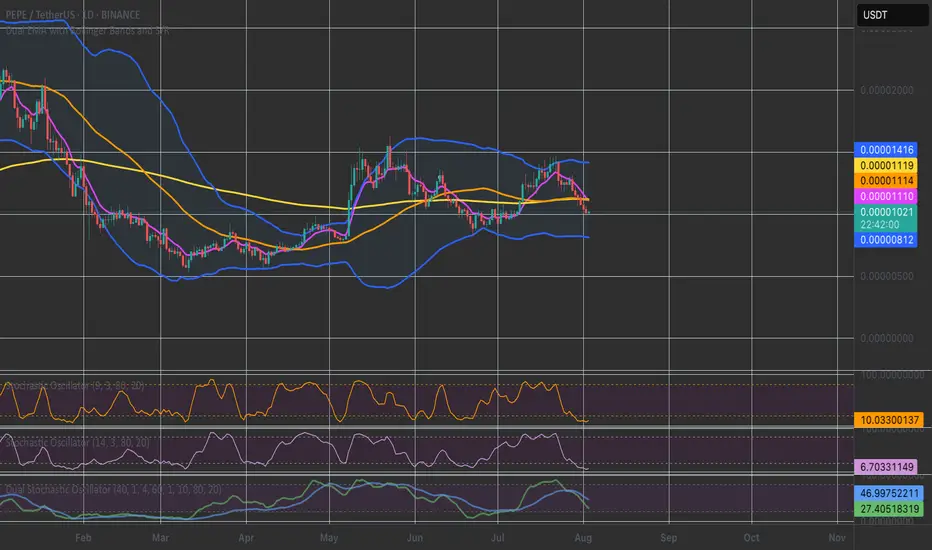
EMA9, EMA200 with Bollinger BandsThe indicator includes the EMA9 line, the EMA200 line and the Bollinger Bands into a single indicator plot.
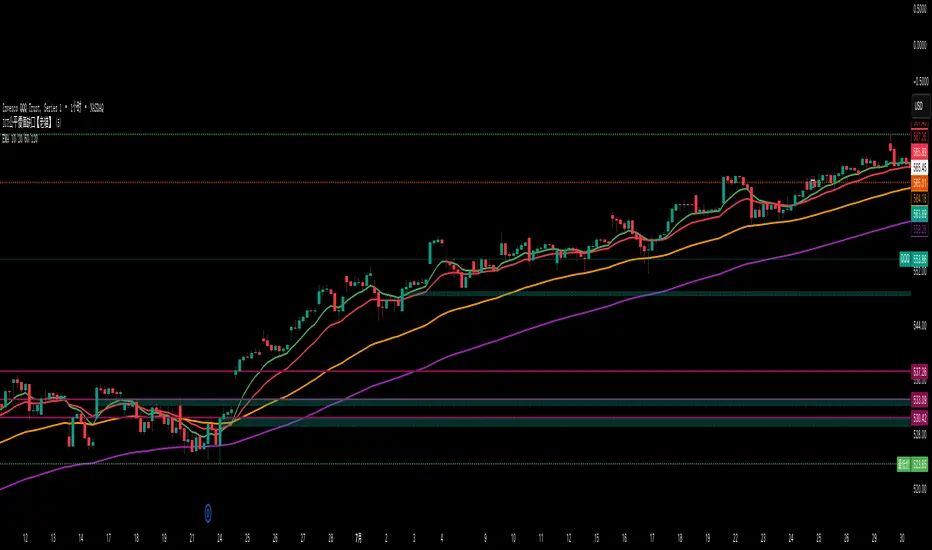
EMA 10/20/60/120// This script plots four Exponential Moving Averages (10, 20, 60, 120)
// for trend-following analysis. Crossovers and the order of the EMAs can
// help identify the strength and direction of the trend.
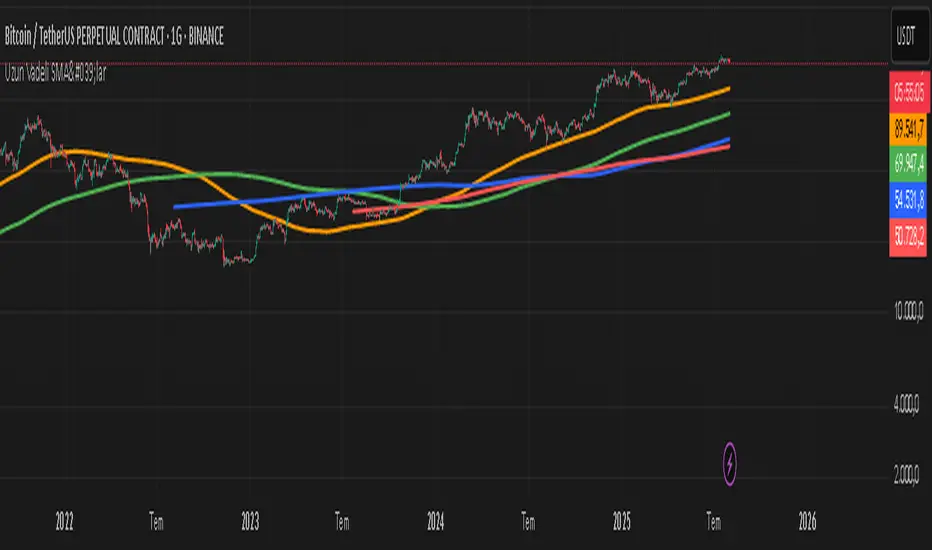
ercometiUzun Vadeli SMA'lar354 708 1062 1414 diaries for friends who want to make money in the long term
ASK Indicator by AshpreetThe ASK Indicator is a custom-built breakout and trend continuation system designed for swing traders seeking high-probability entries with strong risk-reward ratios. Built using a combination of moving averages, momentum filters, volume confirmation, and price structure, this indicator helps identify stocks poised for explosive moves.
It uses three key moving averages: the 44-period SMA (medium trend), 20-period DEMA (short-term strength, custom-coded), and 50-period WEMA (institutional trendline). Trades are only triggered when the price is above 50 WEMA, and the 20 DEMA is above the 44 SMA.
Momentum is confirmed using RSI(14) within a healthy zone of 40–60, ensuring the stock is not overbought or oversold. To focus on breakout candidates, the stock must be trading within 10% of its 52-week high, and the weekly candle range must be under 10%, signaling compression before expansion.
A valid ASK Signal occurs when these conditions are met along with a breakout above the previous day’s high and volume exceeding 1.5× the 20-day average. Once triggered, the indicator auto-plots the stop-loss (1× ATR) and two profit targets: 1:2 (TP1) and 1:4 (TP2).
Additionally, the system detects a narrow range setup, where the last 3 daily candles are inside the previous 3-day range — a powerful consolidation signal. Alerts for both ASK entries and narrow ranges are included.
This system is ideal for positional and short-term swing traders who want to combine structure, momentum, and volume in one powerful tool.

ombs- PONY Breakout Alert
🧠 תקציר הסקריפט: **PONY Breakout Alert 📈
🔍 **מטרה**:
לזהות **פריצה מעלה של רמת 14.15** תוך כדי **מחזור מסחר גבוה מהממוצע**, כדי לאתר **הזדמנות מסחר שורית**.
---
⚙️ רכיבי הסקריפט:
* 📌 **רמת כניסה**:
`entryLevel = 14.15`
* 📊 **תנאי כניסה**:
* סגירת מחיר **מעל 14.15**
* נפח מסחר **גבוה ב־20% מהממוצע ל־20 הימים האחרונים**
* 🔔 **התראה ויזואלית**:
* סמל ירוק "Entry" מופיע מתחת לנר על הגרף
* קווים קבועים לרמות יעד וסטופלוס
* 🎯 **יעדי רווח**:
* Target 1 – 15.15
* Target 2 – 16.00
* Target 3 – 17.00
* 🛑 **סטופלוס**:
* שמרני: 13.20
* אגרסיבי: 12.80
* 🔔 **התראה אוטומטית** (`alertcondition`):
תשלח הודעה:
*"PONY פרצה מעל 14.15 עם מחזור גבוה – שקול כניסה לעסקה."*
---
📝 מתאים עבור:
* סוחרי ניתוח טכני 🧮
* מי שמחפש כניסה מבוססת על פריצה + נפח 📊
* שימוש על גרף יומי בלבד 📅
---
🧠 Script Summary: PONY Breakout Alert 📈
🔍 Objective:
Detect a breakout above the 14.15 level accompanied by high trading volume, in order to identify a bullish trading opportunity.
⚙️ Script Components:
📌 Entry Level:
entryLevel = 14.15
📊 Entry Conditions:
Price closes above 14.15
Volume is 20% higher than the 20-day average
🔔 Visual Alert:
A green "Entry" label appears below the bar on the chart
Static horizontal lines mark targets and stop-loss levels
🎯 Profit Targets:
Target 1 – 15.15
Target 2 – 16.00
Target 3 – 17.00
🛑 Stop Loss:
Conservative: 13.20
Aggressive: 12.80
🔔 Automated Alert (alertcondition):
Sends a message:
"PONY has broken above 14.15 with high volume – consider a long position."
📝 Ideal For:
Technical traders 🧮
Those seeking breakouts confirmed by volume 📊
Daily chart setups only 📅

ICT OTE Market MakerICT OTE Market Maker
Implementing ICT and automatically identifies OTE zones to minimize drawdowns.
Trailing TP Bot • Crossover-based Trend Strategy using two simple moving averages (SMAs)
• Includes Take Profit and optional Trailing Take Profit
• Trades both long and short
• No pyramiding, i.e., one position at a time

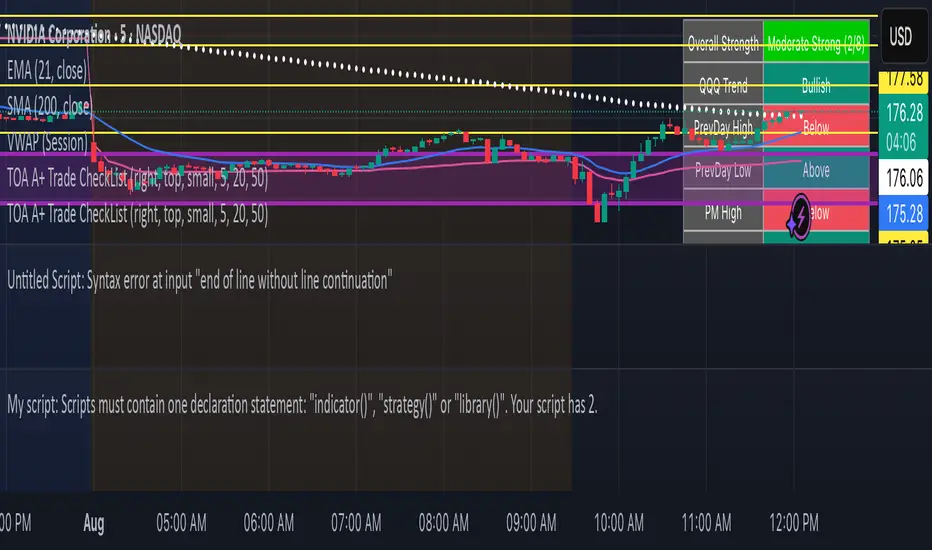
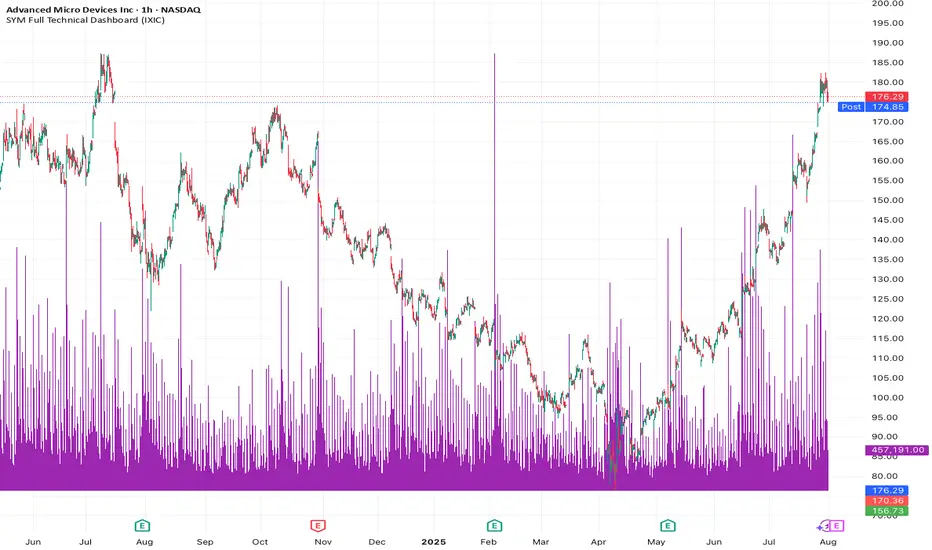
X1 newbie code trying to create
✅ Script Behavior on Other Stocks
• If you’re on a chart for SYM, it calculates indicators using SYM’s data.
• If you switch to NVDA, AVGO, CRDO, etc., it will automatically update to reflect that ticker’s:
• Price
• 50-day moving average
• Volume
• MACD
• RSI
• Index comparison
with 1. 📊 Volume shows in its own pane
2. ✅ MACD and RSI are included in separate panes (as promised)
3. 🎯 Script works cleanly with any ticker
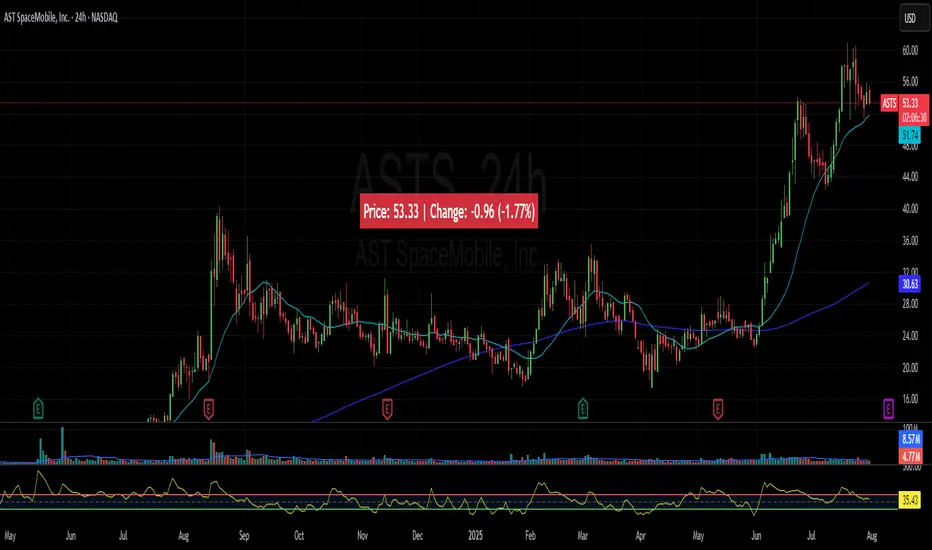
Price Widget on ScreenSimple yet useful script, to see the PRICE/CHANGE of the chart you are on. I use it in my 6/8 charts screen, so you can see the graph and the price.