Wx2 Treasure Box Buy- Above the Box and Protect Below the Box
Sell- Below the Box Protect Above the Box
Go for Trigger Order
RRR: 1:2
Best Location is near 200SMA
Time Frame 2Min, 3Min, 5Min, & 15Min
Watch My Video
youtu.be
Chart patterns
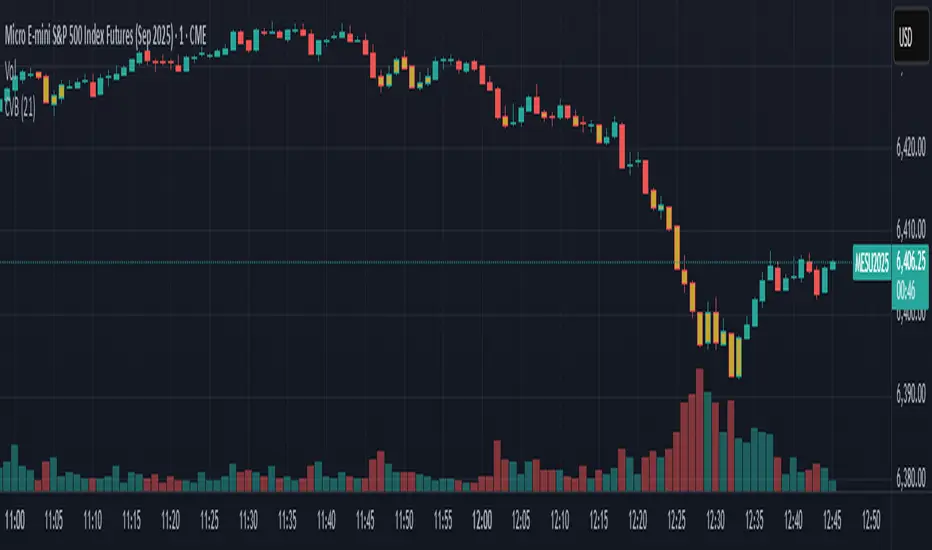
Coefficient of Variance BarsThe script calculates the Coefficient of Variance (CV), which is the standard deviation (a measure of volatility) divided by the average price over a set period. In simple terms, it tells you how volatile the market is in relation to its current price level.
• Highlighting Volatility Increase: By default, the script colors the bars when this relative volatility makes a new high. This suggests that the market is "waking up" and that a significant price move could be starting.
• Highlighting Low Volatility (Inverse Mode): When you uncheck the box in the settings, it highlights periods where volatility is not making a new high. This is useful for spotting quiet, consolidating markets.
________________________________________
How to Use It in Trading
This indicator is a complementary tool and should be used with other forms of analysis, like price action or trend indicators.
1. Spotting Potential Breakouts
The most common use is to anticipate breakouts. When the price is moving in a tight range (consolidation) and you suddenly see a highlighted bar, it signals a surge in volatility. This is often the catalyst that pushes the price out of the range.
• Strategy: Look for a period of price consolidation. When a bar is colored, indicating a volatility spike, look for a confirmation of a breakout (e.g., a candle closing above resistance or below support) and consider entering a trade in that direction.
2. Identifying Ranging Markets
By switching to the inverse mode, you can easily see when the market is quiet and range-bound.
• Strategy: When the bars are consistently highlighted in inverse mode, it confirms a ranging market. This is the ideal environment for strategies that capitalize on sideways movement, such as using oscillators (like RSI or Stochastics) to trade between support and resistance levels.
3. Gauging Trend Strength and Exhaustion
In a strong, ongoing trend, you'll likely see intermittent volatility spikes confirming the momentum. However, a sudden, massive spike in volatility after a very long trend might signal a "climax," potentially indicating the trend is exhausted and a reversal could be near.
MTF Clean Panelsit is bigger model of a earlier model then i have made earlier it helps you see multiple timeframes together and includes more daily timeframe and have also been introduced a new 4 hours candle structure

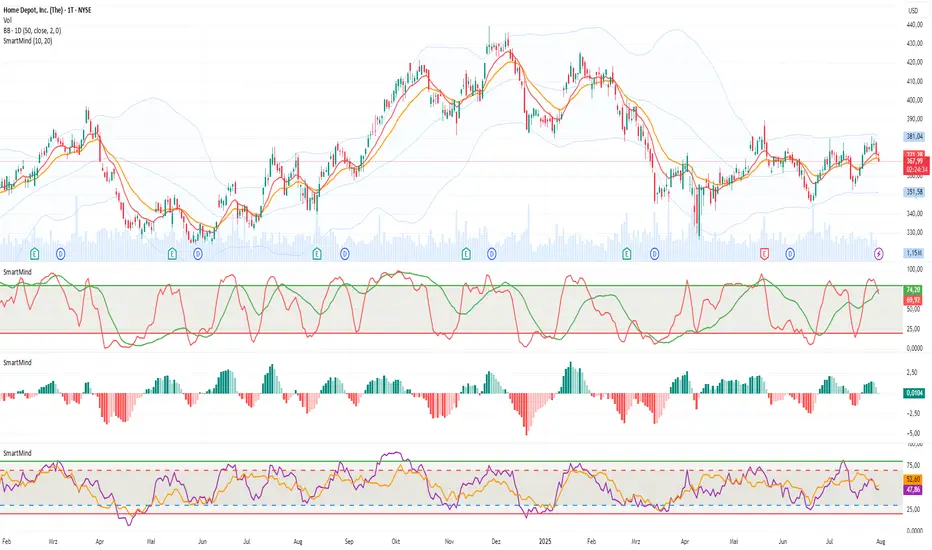
SmartMind2The MACD (Moving Average Convergence Divergence) is a popular technical indicator in trading, primarily used to detect trends and possible reversal points.
How is the MACD structured?
The MACD indicator consists of three components:
MACD Line:
Calculated as the difference between two exponential moving averages (EMAs), commonly 12 and 26 periods.
Formula:
MACD Line
=
𝐸
𝑀
𝐴
12
(
Price
)
−
𝐸
𝑀
𝐴
26
(
Price
)
MACD Line=EMA
12
(Price)−EMA
26
(Price)
Signal Line:
An exponential moving average (usually 9 periods) of the MACD line.
Formula:
Signal Line
=
𝐸
𝑀
𝐴
9
(
MACD Line
)
Signal Line=EMA
9
(MACD Line)
Histogram:
Graphically represents the difference between the MACD line and the Signal line.
Formula:
Histogram
=
MACD Line
−
Signal Line
Histogram=MACD Line−Signal Line
Interpretation of MACD:
Buy Signal: Occurs when the MACD line crosses above the signal line (bullish signal).
Sell Signal: Occurs when the MACD line crosses below the signal line (bearish signal).
Trend Reversal: A divergence between price movements and the MACD indicates a potential reversal (e.g., rising prices with a falling MACD).
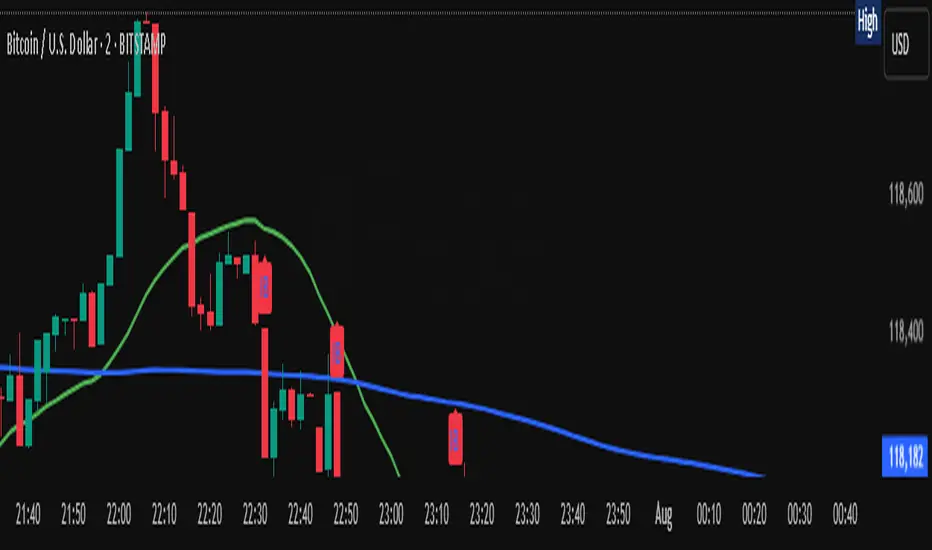
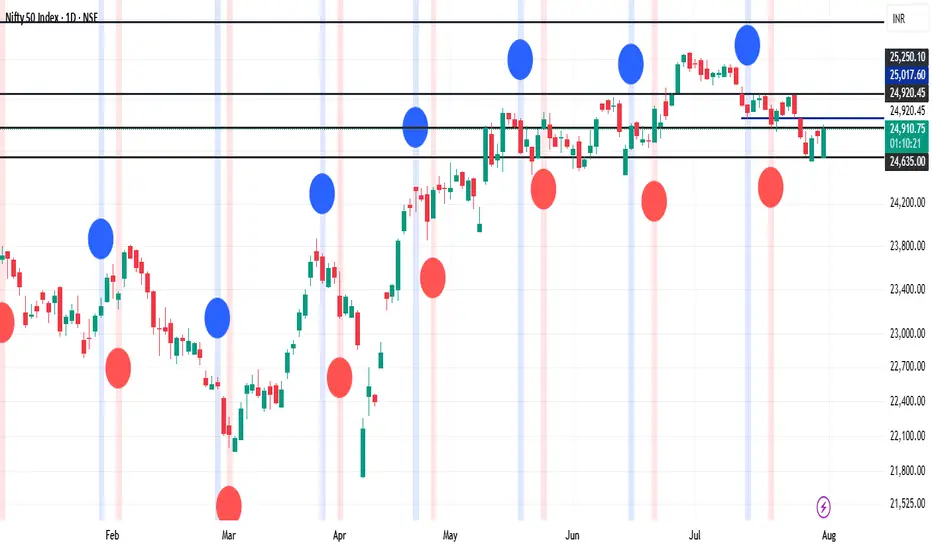
BTC Fractal Momentum ExtremesDescription – BTC Fractal Momentum Extremes (BTCFME)
BTC Fractal Momentum Extremes (BTCFME) is a multi-factor, multi-method technical indicator designed to detect potential top and bottom reversal points in Bitcoin price action by integrating a confluence of unconventional signals. It combines fractals, adaptive momentum, volume dynamics, price velocity convergence, and market structure shifts — all filtered through real-time volatility and contextualized by temporal market conditions.
This tool is best used by traders looking to spot high-confidence turning points on intraday or swing timeframes, and works particularly well in volatile, momentum-driven environments.
Key Components & Methodology
BTCFME utilizes five independent signal-generation methods:
1. Fractal Volume Divergence
Detects reversal fractals in price (5-bar patterns) and validates them with volume anomalies:
Volume spikes (e.g., climax moves) or
Volume exhaustion (e.g., waning participation)
2. Adaptive Momentum Oscillator
Calculates momentum normalized by ATR-adjusted volatility, filtering out noise in choppy markets. It spots directional shifts when momentum inflects from extreme levels.
3. Market Structure Breaks
Identifies dynamic support and resistance using a configurable lookback, and flags potential breakouts or breakdowns from those levels.
4. Price Velocity Convergence
Analyzes the rate of change (velocity) and its acceleration. When both compress within a narrow volatility range, it signals a potential inflection zone.
5. Temporal Confluence Filter
Signals are only considered valid during active market hours (9 AM – 4 PM, excluding weekends) to reduce false positives during illiquid or inefficient trading periods.
Signal Logic & Sensitivity
Signals are generated when at least 3 out of 4 core methods agree, controlled by the Signal Sensitivity setting:
1 (High Sensitivity) = Trigger signals with fewer confirmations
5 (Low Sensitivity) = Require stronger multi-factor confluence
🔹 Buy (Bottom) Signals trigger when:
Bullish fractals appear
Momentum is deeply negative but improving
Price tests structure support
Velocity compresses below average
🔺 Sell (Top) Signals trigger when:
Bearish fractals with volume spikes appear
Momentum peaks and starts to decline
Price tests resistance
Velocity compresses near highs
Visual Features
Arrows: Buy signals = green arrow below candle. Sell signals = red arrow above candle.
Background Color: Indicates overall momentum regime (green = bullish bias, red = bearish, gray = neutral).
Dynamic Support & Resistance Lines: Based on recent swing highs/lows.
Signal Table (top-right): Shows real-time stats on:
Momentum value
Volatility factor
Volume strength (vs. 20-SMA)
Market structure status
Alerts
You can set alerts using the built-in conditions:
BTC Bottom Alert → Fires on potential market bottoms.
BTC Top Alert → Fires on potential market tops.
These alerts are filtered to avoid whipsaw conditions, by checking that opposite signals did not trigger in the last 2 candles.
How to Use
Timeframes: Best suited for 1H–4H and Daily BTC charts, but adaptable to others with parameter tuning.
Confirm with Price Action: Use BTCFME signals in conjunction with candlestick patterns or S/R zones for best results.
Adjust Sensitivity: Lower values catch more signals (good for scalping), higher values filter for stronger reversals (ideal for swing trades).
Use in Trending or Reversing Markets: BTCFME performs best during trending environments or volatile reversals — avoid during prolonged flat/ranging zones.
Notes & Recommendations
BTCFME is not a standalone buy/sell signal; combine it with risk management and trend confirmation tools.
Avoid using it during extremely low-volume sessions (e.g., late weekends).
Adjust parameters based on BTC's evolving volatility and your trading style.

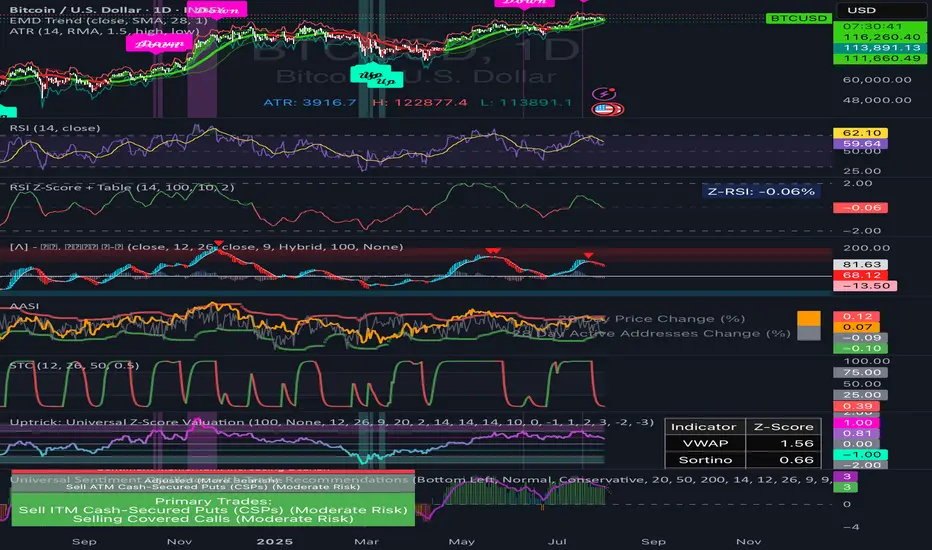
RSI Z‑Score + TableRSI Z-Score + Table
This script calculates the Z-Score of the RSI (Relative Strength Index), which standardizes RSI based on its own recent history.
What It Shows:
RSI Z-Score = (Current RSI - Mean RSI) / Standard Deviation
This tells you how extreme the current RSI is compared to its historical values.
A table displays:
Current RSI
Rolling Mean
RSI Z-Score
How to Use:
Z-Score > +2 = Statistically overbought
Z-Score < -2 = Statistically oversold
Use it to time reversals or overextension in RSI behavior.
🔒 Based on rolling lookback window — fully customizable.
Author:
Tags: #RSI #ZScore #Momentum #StatisticalEdge #MeanReversion #Crypto
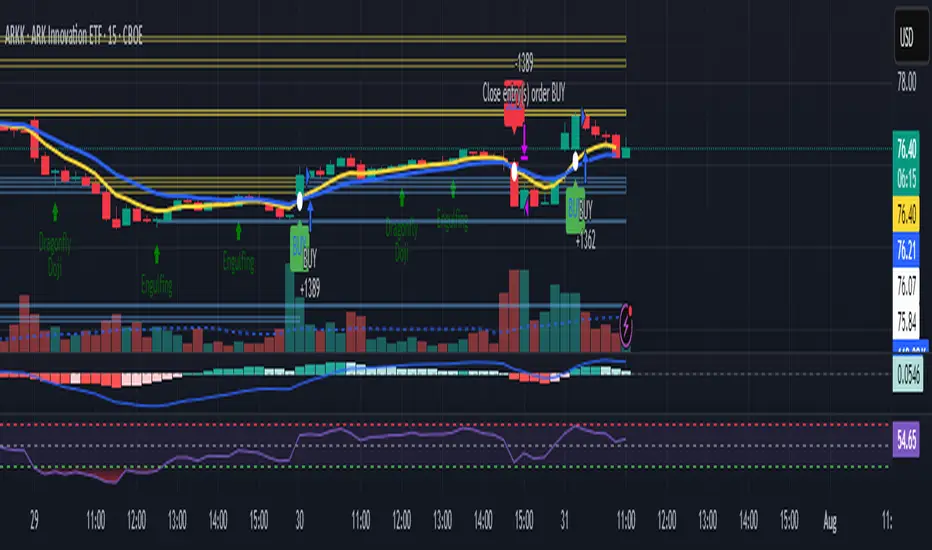
Intra Bullish Strategy - Profit Ping v4.0ProfitPing 4.0 is a high-precision intraday swing trading strategy designed for global equity markets, including the US, South Africa, and Australia. The system identifies high-probability BUY and EXIT signals using a confluence of technical indicators and real-time volume dynamics.
🧠 Key Features:
Dual EMA Crossover (7 & 14) for short-term trend confirmation
Volume Spike Detection based on 20-period moving average
RSI Momentum Filter (ideal zone: 55–65) to avoid overbought entries
MACD Histogram & Signal Line Sync for trend momentum validation
Candlestick Pattern Filtering (e.g. bullish engulfing, flags, breakout candles)
Multi-Timeframe Confirmation (optional) for intraday trend alignment
Dynamic Risk-to-Reward Logic built into alert framework
Webhook-compatible JSON alerts for automation to Google Sheets, Power BI, and IBKR
🛠️ Alert System:
BUY alert triggers when all bullish conditions align
EXIT alert triggers only if a previous BUY exists for that ticker
Trade status is updated live in Google Sheets and integrated with Power BI dashboards
Orphaned EXITs (no matched BUY) are tracked separately for accuracy review
🔄 Ideal For:
Traders seeking 1:2 to 1:5 risk/reward setups
Automation-focused workflows (via TradingView → Google Sheets → Power BI)
Swing traders wanting clean visual logs, automated P&L tracking, and optional IBKR execution
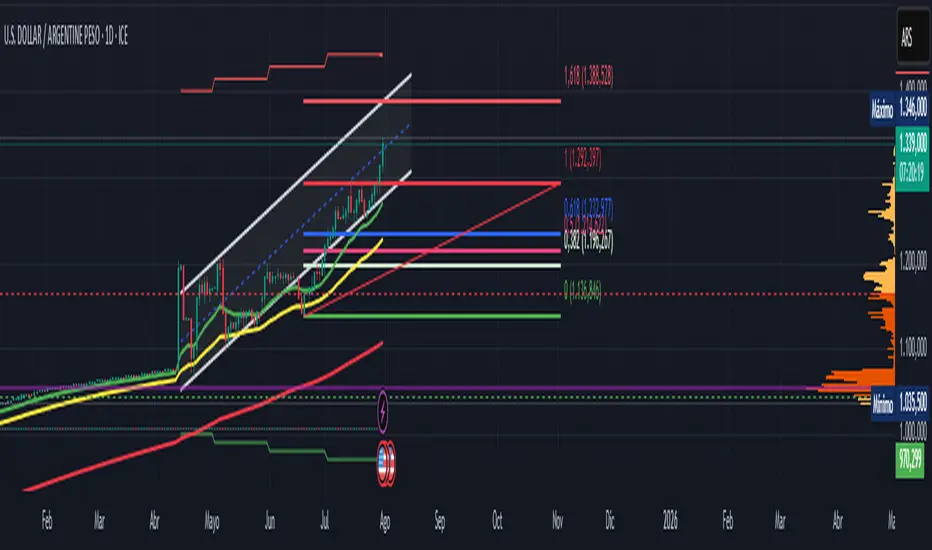
Official USD Staggered Bands - ArgentinaOfficial USD Staggered Bands - Argentina
The Central Bank, under the administration of Javier Milei (La Libertad Avanza), announced on Friday, April 11, 2025, a series of measures to eliminate the so-called "exchange rate restriction."
In this new phase, the dollar's exchange rate on the Free Exchange Market (MLC) will be able to fluctuate within a band between $1,000 and $1,400 , the limits of which will be expanded at a rate of 1% monthly.
The lines evolve daily, increasing as the public administration predicts. This way, you can know the likelihood of a Central Bank intervention to correct the variation and return the peso to a price within the band.
The script runs under the ticker USDARS
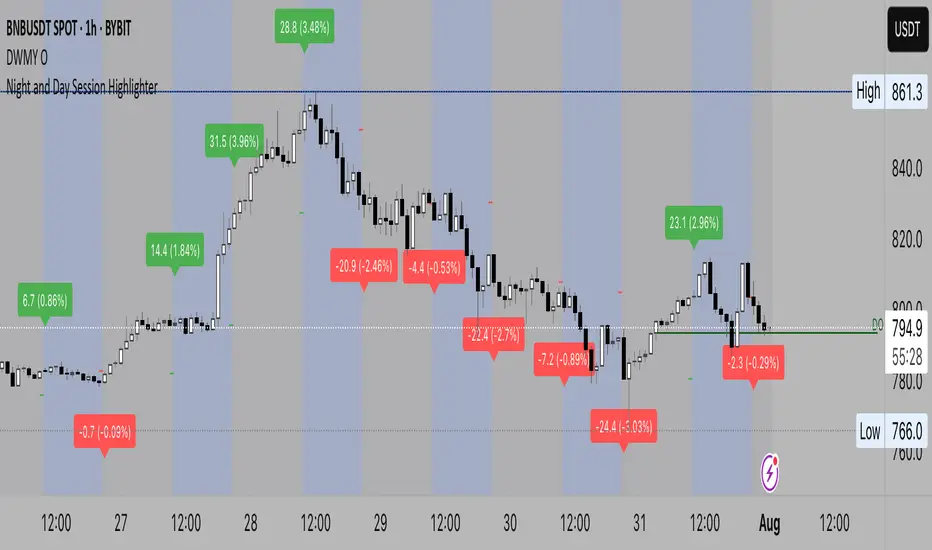
Night Session Highlight with Timezone (Valehson)Highlights this time range from 21:00 to 09:00 with a gray background with 90% transparency.
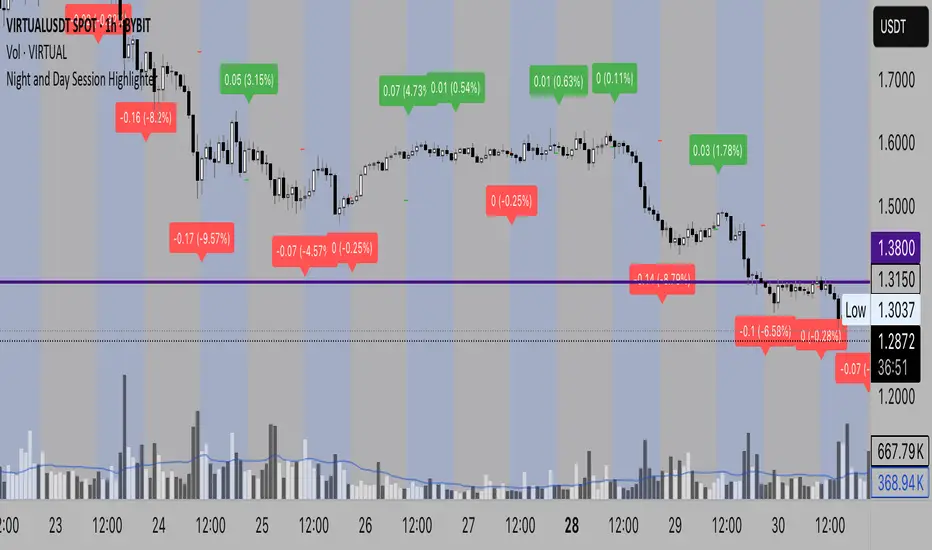
Night Session Highlight (Valehson)Highlights time range from 21:00 to 09:00 with a gray background with 90% transparency.
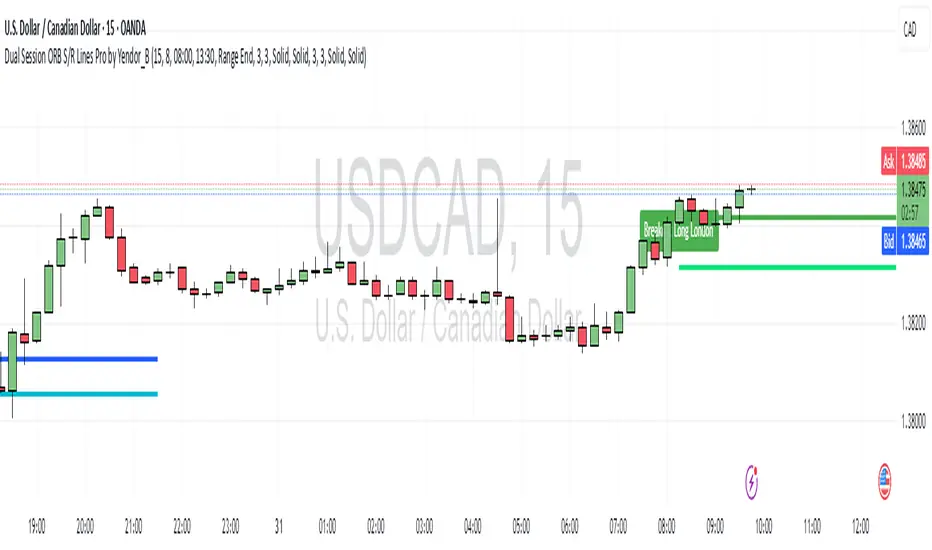
Dual Session ORB S/R Lines Pro by Yendor_BShort description:
Clean opening-range breakout support/resistance lines for London and US sessions with confirmed breakout labels and alert-ready signals. UTC-based, adjustable start point, customizable styling, minimal clutter.
Detailed description:
What it does:
Captures the Opening Range (default first 15 minutes) for London and New York (US) sessions in UTC, plots the high and low as support/resistance lines, and marks confirmed breakouts when price closes beyond those levels. Lines can begin at either the range end or session start and persist for the configured session length.
Key Features:
ORB defined over the first N minutes after session open (configurable, default 15).
Two sessions: London and US (New York) with separate start times.
High/low support & resistance lines per session:
Selectable start point: Range End or Session Start.
Independently customizable color, width, and style (solid/dashed/dotted) for each high and low.
Confirmed breakout labels: only on the first candle that closes beyond the ORB high or low after the range completes (prior close must be inside).
Alerts and alertconditions for breakout long/short per session, usable in TradingView’s alert dialog.
Fully UTC-based. Works on any timeframe; 1-minute or 5-minute recommended for precision.
Minimal visual clutter; no persistent shaded boxes in this version.
Inputs explained:
ORB Duration (minutes): Length of the opening range used to calculate session high and low.
Session Length (hours): How long the S/R lines remain active (typically full session).
London / US Start (UTC): Session open times in UTC.
Line Start Point: Choose whether the lines begin at the range end or at the session start.
High/Low Styling: Independent color, thickness, and style for each session’s high and low.
Breakout Labels: Toggle one-time confirmed breakout annotations.
Alerts: Enable breakout alert messages.
Example workflows:
Monitor the first 15 minutes of the London session.
After the range, wait for a candle to close beyond the high or low for a confirmed breakout.
Use the label or alert to trigger entry logic (retest, continuation, etc.).
Repeat for the US session; compare overlaps for higher conviction.
Alert setup:
Open the Alerts panel. Choose one of the built-in alertconditions: London Breakout Long, London Breakout Short, US Breakout Long, US Breakout Short. Set frequency to Once Per Bar Close. Customize notification/webhook payload if automating.
Preset suggestions:
Standard London ORB: 15 minute range, lines from range end, green high / lime low.
Standard US ORB: 15 minute range, lines from range end, blue high / aqua low.
Overlap Bias: Both sessions active, lines start from session start, differentiated styles.
Tips & best practices:
Combine with external volume or volatility filters to reduce false breakouts. Use on correlated pairs to observe consistent session structure. Treat broken ORB levels as flipped support/resistance on revisit. Prefer confirmed closes beyond lines rather than wick touches.
Limitations / disclaimer:
Provides structural visualization and breakout signaling; does not guarantee profitability. Always apply proper risk management and confirm with additional context. Backtest settings before live use.
Tags:
#ORB #OpeningRangeBreakout #SessionTrading #LondonSession #NewYorkSession #SupportResistance #Breakout #Intraday #Pinev6 #TradingView #Forex #TrendStructure #Alerts #USD #EURUSD #TradingSignals #UTCBased #PriceAction #MarketStructure #IntradayBreakouts
ALPHA 999This indicator is designed to provide traders with clear and reliable signals by combining essential technical tools into one simplified framework. Whether you’re trading crypto, stocks, or forex, this tool helps identify potential entry and exit points using . It is well-suited for both intraday and swing traders, offering customizable inputs, multi-timeframe compatibility, and real-time alerts. The indicator displays intuitive visual cues directly on the chart, making it easy to interpret market conditions and respond quickly. Ideal for traders who prefer clean charts with actionable signals, this tool enhances decision-making without overwhelming complexity. While powerful on its own, it can be paired with other indicators for greater confirmation and accuracy. Please note: this indicator is for educational purposes only and should be used with proper risk management and backtesting before applying to live trades.
ALPHA 999This script is a custom-built indicator designed to enhance your trading strategy by providing . It is optimized for and suitable for both intraday and swing traders.

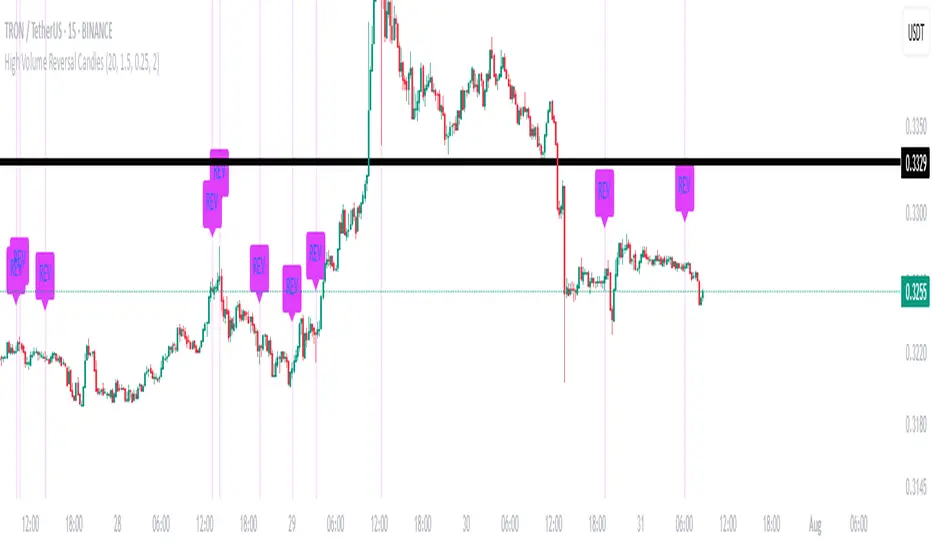
High Volume Reversal CandlesIdentifies candles which display reversal patterns (mainly hammers, inverted hammers, spinning top) on unusually high volume.
This makes the candlestick pattern more likely to fulfil.
Remember to always wait for confirmation; should only be used as an entry locator, not entry trigger.
Dynamic Gap Probability Tool with N-Bar Decay📌 How It Works
1. Moving Average (MA) Reference
o The indicator plots a moving average (SMA, EMA, WMA, etc.) on the chart.
o Price can be above or below this moving average.
2. Probability Tracking
o Every time a bar closes, the script records:
Whether the next candle closed up (green) or down (red).
Whether within the next N bars (e.g., 3 bars ahead) the price moved higher or lower than the current close.
3. N Bar Lookahead
o Instead of only caring about the very next candle, it looks forward several bars to see if the market eventually moves in your favor.
o Example: If N = 3, it answers:
"Within the next 3 bars, what’s the chance price will go higher/lower from here?"
4. Results Table
o At the edge of your chart, the table shows:
✅ Next Green % – Probability next candle is bullish.
❌ Next Red % – Probability next candle is bearish.
📈 N Bar Bull % – Probability that within N bars, price goes higher.
📉 N Bar Bear % – Probability that within N bars, price goes lower.
💡 Why It’s Useful for Traders
• Removes Guesswork – Instead of relying on “gut feeling,” you see historical probabilities for how price reacts when above/below the MA.
• Better Trade Timing – If N Bar Bullish Probability is high, it suggests waiting for confirmation and holding longer than just 1 candle.
• Adapts to Style –
o Scalpers: Use N = 1 to see immediate probabilities.
o Swing Traders: Use N = 3, 5, or 10 to see longer-term reaction probabilities.
• Trend Awareness – Works differently above and below the moving average, giving you a bias toward long or short trades.
• Confidence in Decisions – Probabilities are based on real past data from the chart’s history.

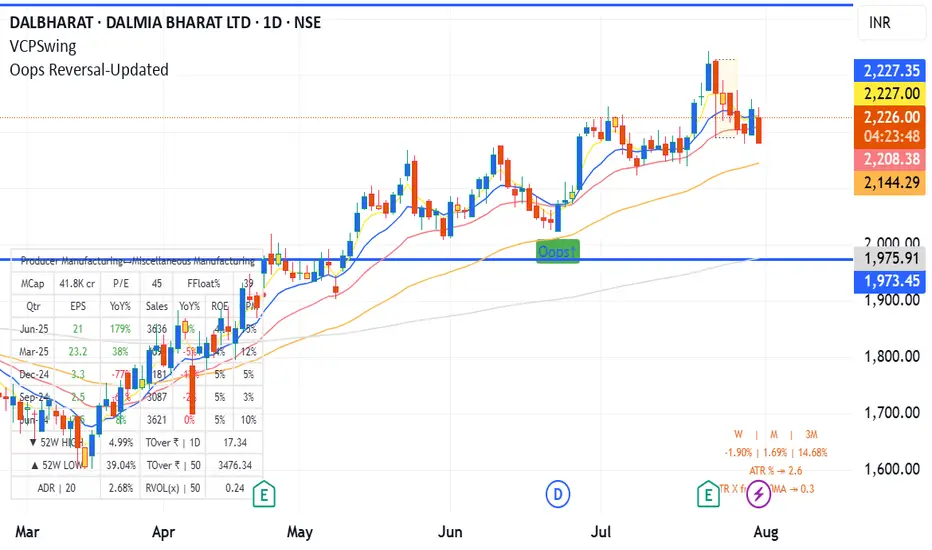
Oops Reversal-Updatedoops reversal - manas arora updated to cover only if it closes above previous day high
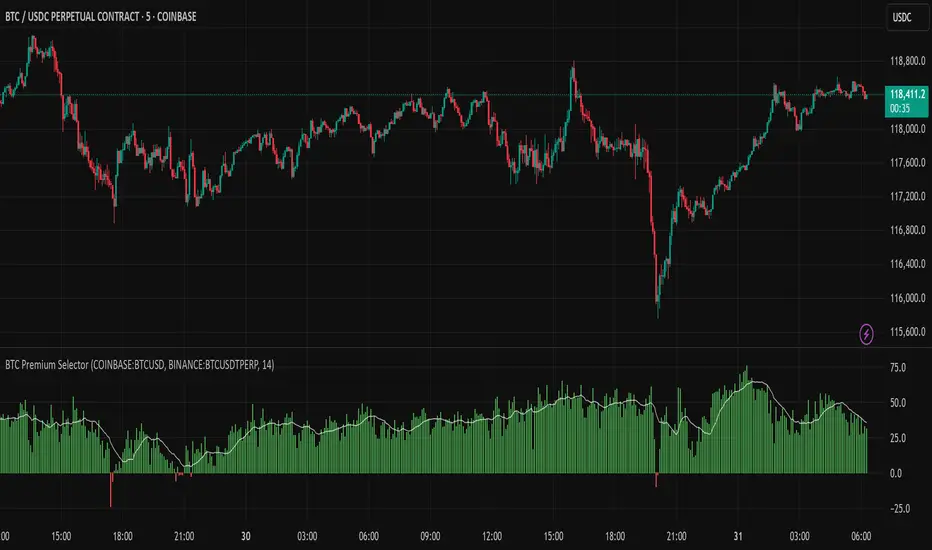
Multi CEX BTC Spot vs Perpetual PremiumThis Indicator shows the BTC Spot vs Perpetual premium across different CEX.
Combined Time and Price IndicatorCammjayyy THis is a time frame indicator that changes the colors based on day highs and lows. really good for swings and hedging

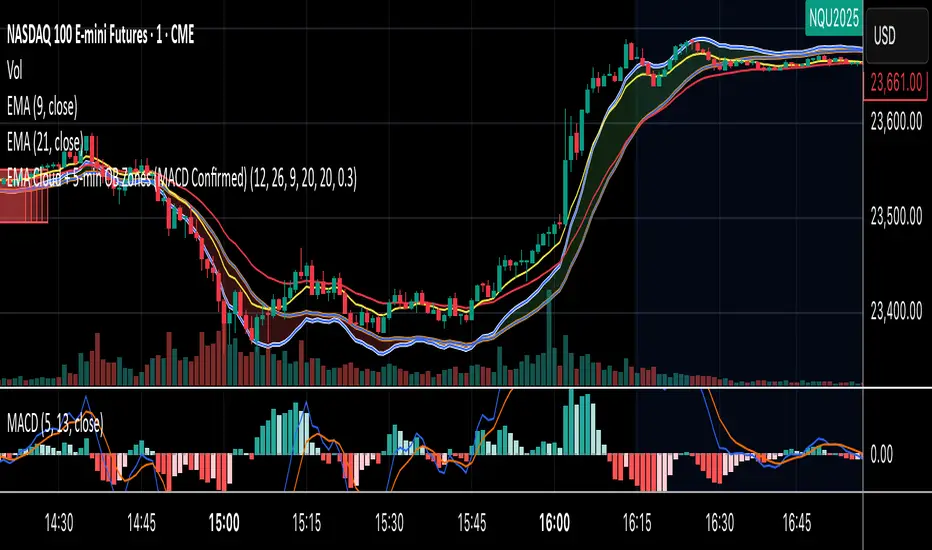
EMA Cloud + 5-min OB Zones (MACD Confirmed)What This Does:
OB detection runs only on 5-minute candles
Script works perfectly even if you're on a 1-minute chart
You’ll still see clean 5-min OB boxes extending into your execution zone
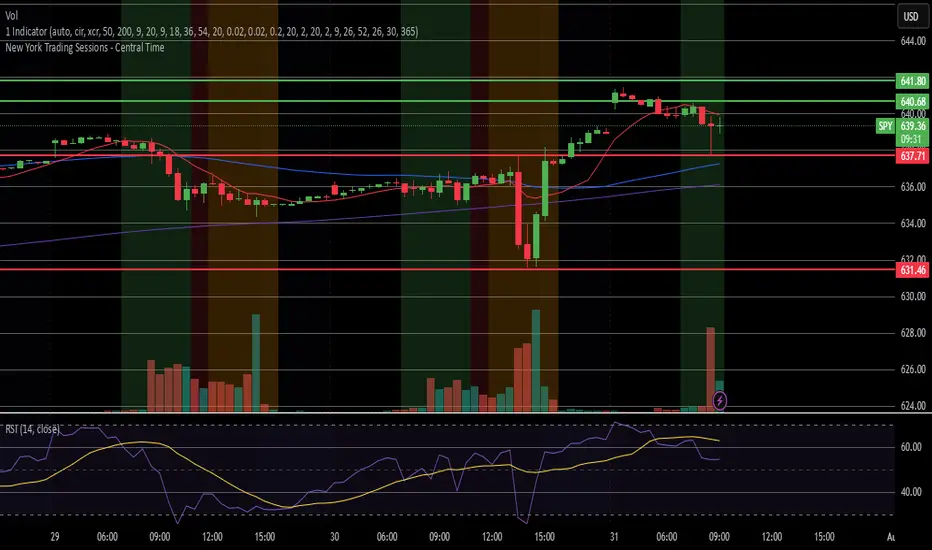
Previous RTH Levels (RTH Only)Previous RTH Levels on current session (RTH Only)
This indicator calculates key volume profile levels from the previous Regular Trading Hours (RTH) session and projects them onto the current RTH session. It is designed to provide traders with significant historical price levels—Point of Control (POC), Value Area High (VAH), and Value Area Low (VAL)—to use as potential support, resistance, and pivot points for intraday trading.
Instead of just plotting lines, this script highlights the entire Value Area (VA) between the VAH and VAL, offering a clear visual reference for the prior day's zone of price agreement.