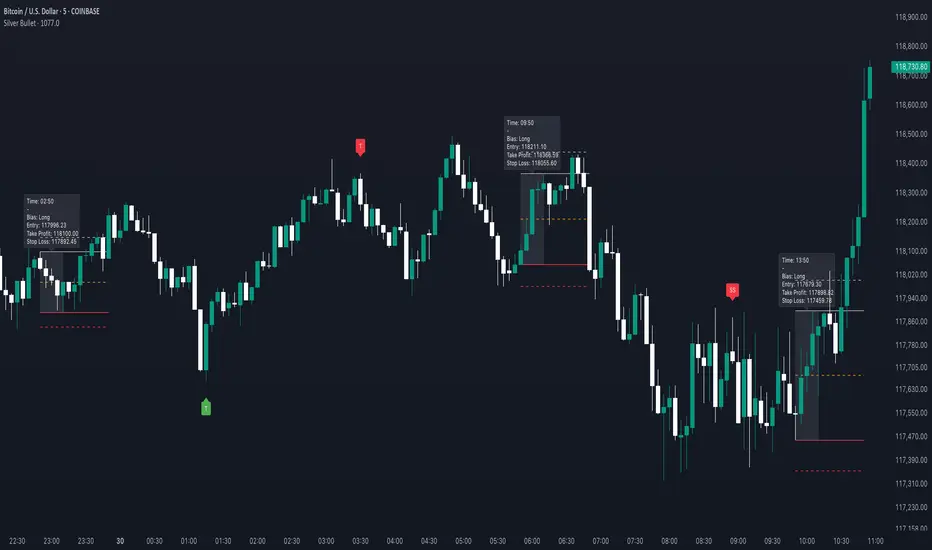
Silver BulletSilver Bullet is a trading tool built for finding cleaner, higher-probability setups. It focuses on key windows of market movement and adds helpful tools like daily range levels and candlestick patterns.
Whether you’re trading breakouts or reversals, Silver Bullet gives you a clearer view of the market and more confidence in your setups.
⸻
🔹 Trading Setup #1: Macro Time
The Macro Time setting offers two modes: Macro Bullet and Silver Bullet. Both help traders focus on specific times when the market tends to deliver clean moves.
• Macro Bullet is based on the high and low of a full macro session. It automatically detects the session’s range and bias, then offers optimal entries for either Long or Short setups. Once the session resolves, it provides Fibonacci-based levels for entry, target, and stop loss.
• Silver Bullet is based on ICT concepts and focuses on the hourly range for London, NY AM, and NY PM sessions. It’s designed for quick time blocks and highlights key levels as the session unfolds.
To use this setup, set Macro Time to “ICT Sessions” and select your preferred mode under Bullet Mode.
⸻
🔹 Trading Setup #2: Daily Range
Enable Daily Range to draw Fibonacci levels based on either the previous day’s candle or the current day’s developing range. These levels help you identify potential support, resistance, and midpoint zones throughout the day.
With the current day’s range, levels automatically update in real time as new highs or lows form — keeping your chart aligned with evolving price action.
⸻
🔹 Trading Setup #3: Candlestick Patterns
Turn on Candlestick Patterns to automatically highlight clean reversal signals such as Hammers, Hanging Men, Shooting Stars, and Tweezers. Each pattern is detected using specific criteria and trend filters to reduce noise and improve reliability. They work especially well as confirmation signals around key levels or session zones.
Silver Bullet brings structure, clarity, and precision to your intraday trading. By combining time-based bias, price action levels, and pattern recognition, it helps you trade with purpose — not guesswork. Use one setup or combine all three for a complete view of the market, tailored to your style and session of choice.
Chart patterns
Elliott Wave Auto Detector (Simplified)How to Use the Detector
Identify Structure: Look for sequences like 1-2-1-2...
These may show a forming or ongoing Elliott wave pattern.
Validate Trend: Multiple red 2’s at lower highs suggests a bearish trend; the reverse with blue 1’s at higher lows is bullish.
Trading Zones:
Consider buying near clusters of blue 1’s (support zones).
Consider selling or shorting near clusters of red 2’s (resistance zones).
Look for Breakouts: If price breaks out of the descending channel, trend may reverse or accelerate.

Order Block Finder (5-min Demand Zones)This highlights potential bullish order blocks on a 5-min chart when:
Candle is bullish
Small body (suggesting accumulation or absorption)
Lowest low in last X bars


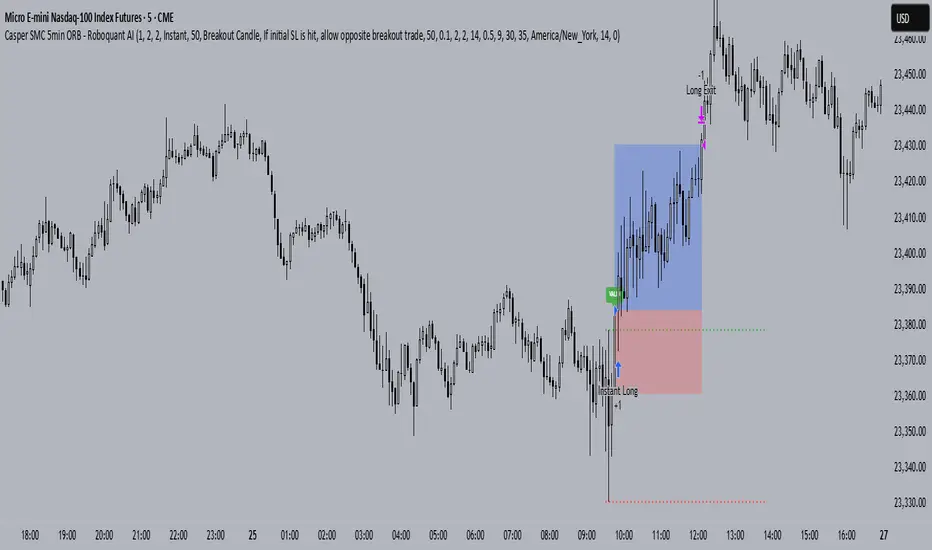
Casper SMC 5min ORB - Roboquant AI🚀 Key Features:
Opening Range (09:30–09:35 EST) breakout detection
Configurable entry type: Instant or Retracement
Adjustable Risk:Reward multiplier and contract sizing
Optional Trailing Stop Loss using ATR
Second-Chance trades if the first breakout fails
Visual markers for entries, SL/TP, trade status, and breakout validation
Day filter: Trade only on selected weekdays
Session management with configurable close time
Breakout validation using:
Wick percentage filters
Distance filters based on OR range size
🧠 AI-Style Logic Enhancements:
Smart filters for avoiding overextended or noisy breakouts
Full support for lookahead-safe logic via barstate.isconfirmed
Clean box-style trade visualization (entry, SL, TP zones)
Custom alerts for long and short entries
⚙️ Recommended Settings:
Use on 5-minute chart
Best for US indices/ Futures
📌 Note:
This script is for educational purposes only.
Performance preview on Tradingview is not accurate
Yoou need to adjust the settings and run a 1 year report
Always backtest thoroughly and consult your financial advisor before live trading.
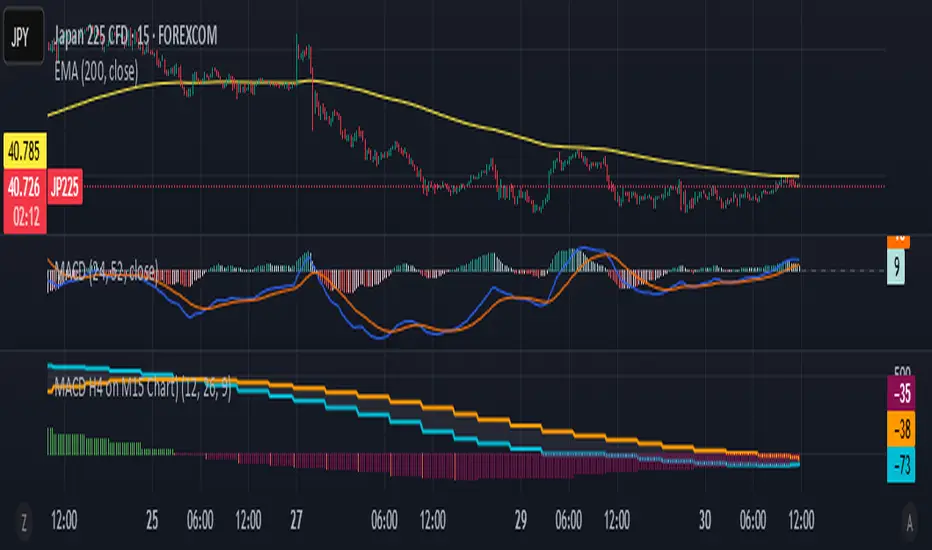
MACD H4 on M15 ChartThis script displays the MACD from the H4 (4-hour) timeframe while viewing the chart in M15 (15-minute). It shows the H4 MACD line, signal line, and histogram for multi-timeframe (MTF) analysis. Use it to anticipate trend shifts on lower timeframes with confirmation from the higher timeframe MACD structure.
BTC vs MSTR PerformanceBTC vs MSTR Performance - BULL
• Green: MSTR has outperformed BTC over the selected time period.
• Red: BTC has outperformed MSTR during the same time period.
• Horizontal line at 0: Separates positive from negative outperformance.


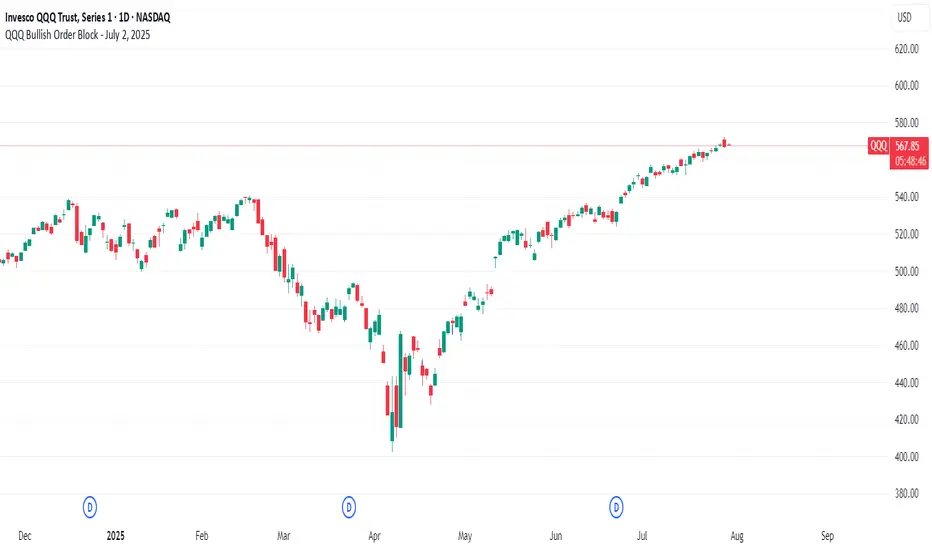
QQQ Bullish Order Block - July 2, 2025//@version=6
indicator("QQQ Bullish Order Block - July 2, 2025", overlay=true)
// Define the OB candle manually (July 2, 2025)
ob_date = timestamp("2025-07-02T00:00:00")
// Conditions: Bullish order block from last bearish candle before rally
is_ob_candle = time == ob_date
// Get OB candle open and close
ob_open = request.security(syminfo.tickerid, "D", open, lookahead=barmerge.lookahead_on)
ob_close = request.security(syminfo.tickerid, "D", close, lookahead=barmerge.lookahead_on)
// Use min/max to draw OB zone correctly (in case of red candle)
ob_high = math.max(ob_open, ob_close)
ob_low = math.min(ob_open, ob_close)
// Only show zone if price is at or above it (optional filter)
show_zone = close >= ob_high
// Draw the OB zone as a filled box
if is_ob_candle and show_zone
var box ob_box = box.new(left = bar_index, right = bar_index + 30, top = ob_high, bottom = ob_low,
border_color = color.green, bgcolor = color.new(color.green, 85))
box.set_extend(ob_box, extend = extend.right)
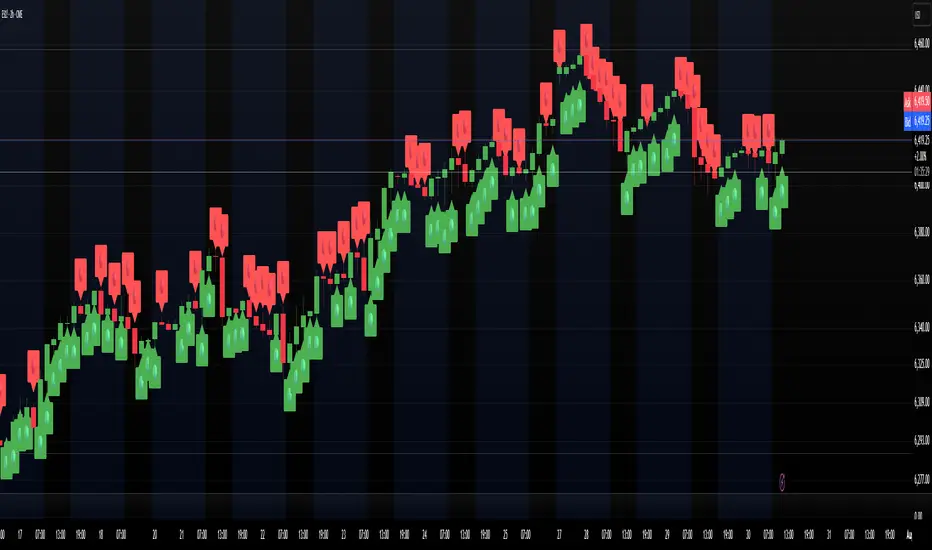
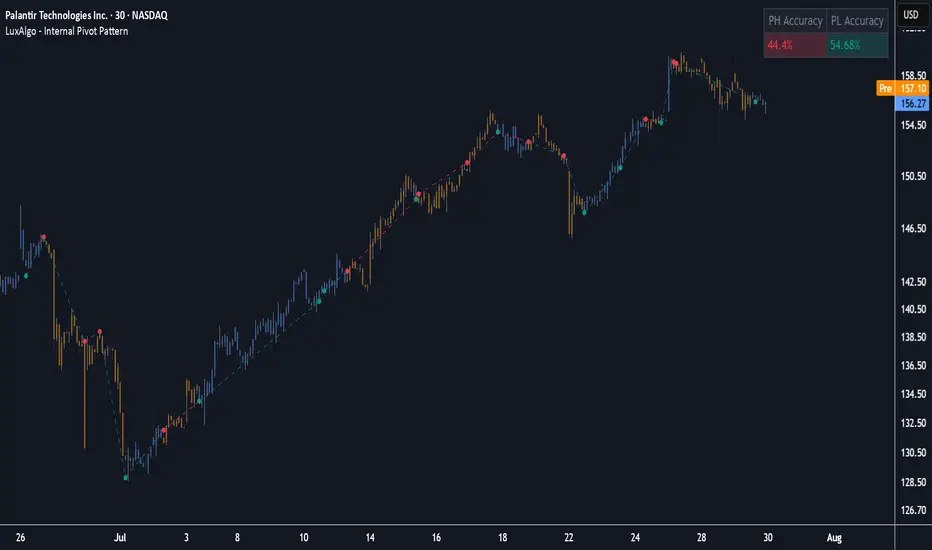
Internal Pivot Pattern [LuxAlgo]The Internal Pivot Pattern indicator is a novel method allowing traders to detect pivots without excessive delay on the chart timeframe, by using the lower timeframe data from a candle.
It features custom colors for candles and zigzag lines to help identify trends. A dashboard showing the accuracy of the pattern is also included.
🔶 USAGE
We define a pivot as the occurrence where the middle candle over a specific interval (for example, the most recent 21 bars) is the highest (pivot high) or the lowest (pivot low). This method commonly allows for identifying swing highs/lows on a trader's chart; however, this pattern can only be identified after a specific number of bars has been formed, rendering this pattern useless for real-time detection of swing highs/lows.
This indicator uses a different approach, removing the need to wait for candles to form on the user chart; instead, we check the lower timeframe data of the current candle and evaluate for the presence of a pivot given the internal data, effectively providing pivot confirmation at the candle close.
An internal pivot low pattern is indicative of a potential uptrend, while an internal pivot high is indicative of a potential downtrend.
Candles are colored based on the last internal pivot detected, with blue candle colors indicating that the most recent internal pivot is a pivot low, indicating an uptrend, while an orange candle color indicates that the most recent internal pivot is a pivot high, indicating a downtrend.
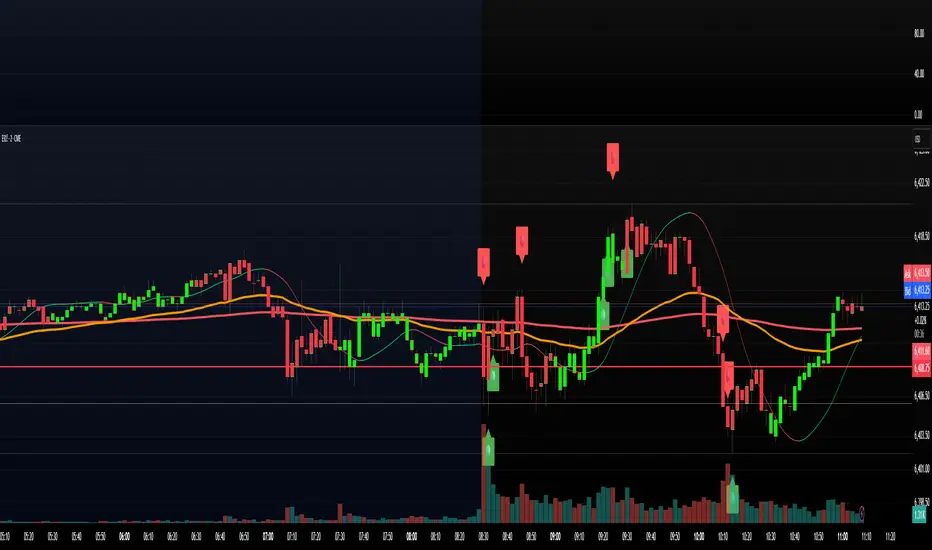
🔹 Timeframes
The timeframe setting allows controlling the amount of lower timeframe data to consider for the internal pivot detection. This setting must be lower than the user's chart timeframe.
Using a timeframe significantly lower than the user chart timeframe will evaluate a larger amount of data for the pivot detection, making it less frequent, while using a timeframe closer to the chart timeframe can make the internal pivot detection more frequent, and more prone to false positives.
🔹 Accuracy Dashboard
The Accuracy Dashboard allows evaluating how accurate the detected patterns are as a percentage, with a pattern being judged accurate if subsequent patterns are detected higher or lower than a previous one.
For example, an internal pivot low is judged accurate if the following internal pivot is higher than it, indicating that higher highs have been made.
This dashboard can be useful to determine the timeframe setting to maximize the respective internal pivot accuracy.
🔶 SETTINGS
Timeframe: Timeframe for detecting internal swings
Accuracy Dashboard: Enable or disable the Accuracy Dashboard.
🔹 Style
Internal Pivot High: Color of the dot displayed upon the detection of an internal pivot high
Internal Pivot Low: Color of the dot displayed upon the detection of an internal pivot low
Zig-Zag: Color of the zig-zag segments connecting each internal pivot
Candles: Enable candle coloring, with control over the color of the candles highlighting the detected trend
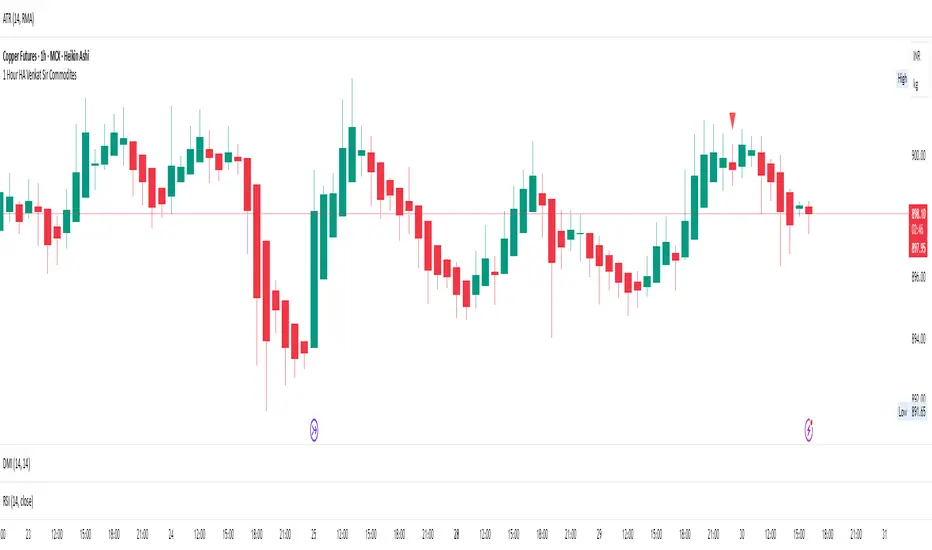
1 Hour HA Venkat Sir CommoditiesHere’s a clear and professional description you can use for your TradingView script:
---
### **Script Name:**
**1 Hour HA Venkat Sir Commodities**
### **Description:**
This indicator is designed for identifying potential **buy and sell signals** in commodity markets using **Heikin Ashi candlestick patterns** combined with a **Relative Strength Index (RSI) filter**. It works on the **1-hour timeframe** and aims to capture early trend reversals or momentum shifts.
### **Key Features:**
* ✅ **Heikin Ashi Pattern Detection:**
Detects the following reversal candlestick patterns on calculated Heikin Ashi candles:
* **Bullish Engulfing**
* **Bullish Harami**
* **Bearish Engulfing**
* **Bearish Harami**
* ✅ **RSI Confirmation Filter:**
Adds an extra layer of confirmation using the standard 14-period RSI on regular price candles:
* **Buy signals** trigger only when RSI < 40 (oversold zone).
* **Sell signals** trigger only when RSI > 60 (overbought zone).
* ✅ **Visual Signals:**
* **Green upward triangles** below candles for buy signals.
* **Red downward triangles** above candles for sell signals.
* ✅ **Alert Conditions:**
Built-in alerts to notify users when valid buy or sell conditions are met.
### **Usage Tip:**
Best used on commodities charts set to the **1-hour timeframe**. Ensure you're not using Heikin Ashi chart mode, as the script calculates its own Heikin Ashi values for accuracy and consistency.
---
Let me know if you’d like a shorter version or want this translated into Hindi or another language.
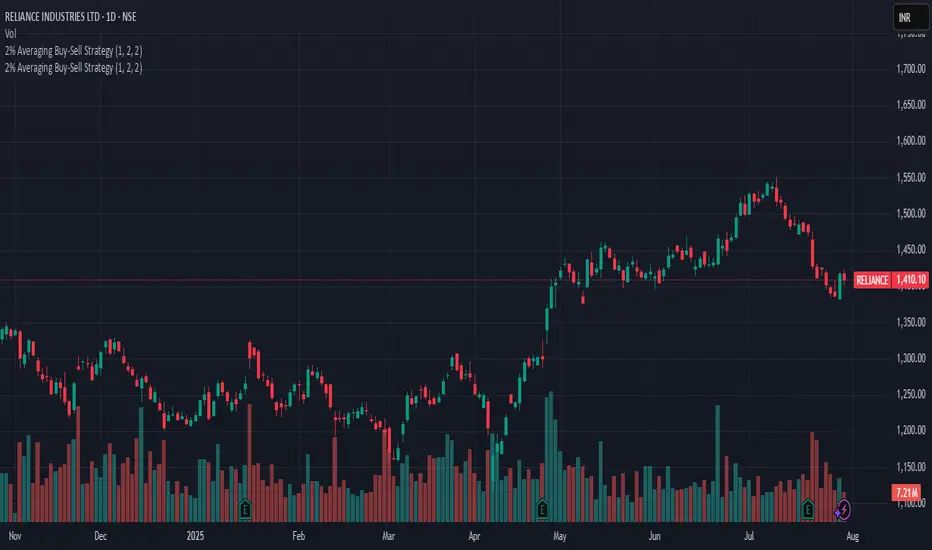
2% Averaging Buy-Sell Strategy📘 Strategy Description: 2% Averaging Buy-Sell Strategy
This strategy is designed to simulate an averaging-down and scaling-out approach based on percentage-based price movements.
Entry Logic (Buy):
Initial buy of 1 lot is triggered at the start of the strategy.
Every time the price drops by 2% from the last executed buy level, the strategy adds 2 more lots.
Exit Logic (Sell):
When the price rises 2% from the last buy level, the strategy sells 2 lots.
Selling continues in batches of 2 lots as long as the upward movement continues and lots are available.
Core Idea:
This is a dynamic averaging system that increases exposure during drawdowns and reduces it during rallies, aiming to capture mean reversion or trend reversals.
Customizable Inputs:
Initial lot size
Additional lot size
Percentage threshold (default 2%)
⚠️ Note: This strategy is for simulation/backtesting purposes. It does not account for slippage, fees, or real-world order execution conditions.
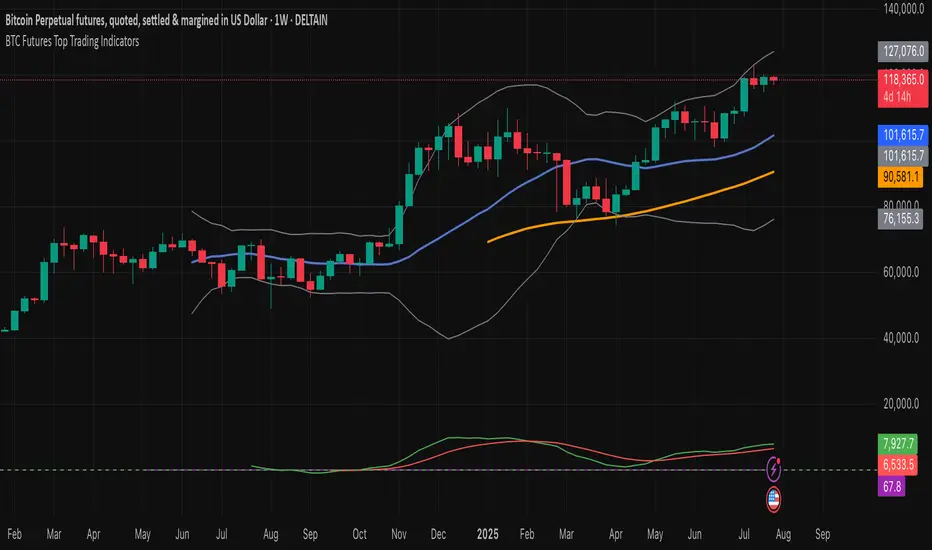
BTC Futures Top Trading Indicators//@version=5
indicator("BTC Futures Top Trading Indicators", overlay=true)
// Moving Averages
fast_ma = ta.sma(close, 20)
slow_ma = ta.sma(close, 50)
// RSI
rsi = ta.rsi(close, 14)
// MACD
= ta.macd(close, 12, 26, 9)
// Bollinger Bands
bb_middle = ta.sma(close, 20)
bb_upper = bb_middle + 2 * ta.stdev(close, 20)
bb_lower = bb_middle - 2 * ta.stdev(close, 20)
// Plot Moving Averages
plot(fast_ma, color=color.blue, linewidth=2, title="20 SMA")
plot(slow_ma, color=color.orange, linewidth=2, title="50 SMA")
// Plot Bollinger Bands
plot(bb_upper, color=color.gray, title="Upper BB")
plot(bb_lower, color=color.gray, title="Lower BB")
plot(bb_middle, color=color.gray, title="Middle BB")
// Plot RSI in a separate window
rsi_plot = rsi
hline(70, "Overbought", color=color.red, linestyle=hline.style_dashed)
hline(30, "Oversold", color=color.green, linestyle=hline.style_dashed)
plot(rsi_plot, title="RSI", color=color.purple)
// Plot MACD
plot(macdLine, color=color.green, title="MACD Line")
plot(signalLine, color=color.red, title="Signal Line")
// Entry and Exit signals
buy_signal = ta.crossover(fast_ma, slow_ma) and rsi < 30 and macdLine > signalLine and close > bb_lower
sell_signal = ta.crossunder(fast_ma, slow_ma) and rsi > 70 and macdLine < signalLine and close < bb_upper
// Plot signals on chart
plotshape(buy_signal, title="Buy Signal", location=location.belowbar, color=color.green, style=shape.labelup, size=size.small)
plotshape(sell_signal, title="Sell Signal", location=location.abovebar, color=color.red, style=shape.labeldown, size=size.small)
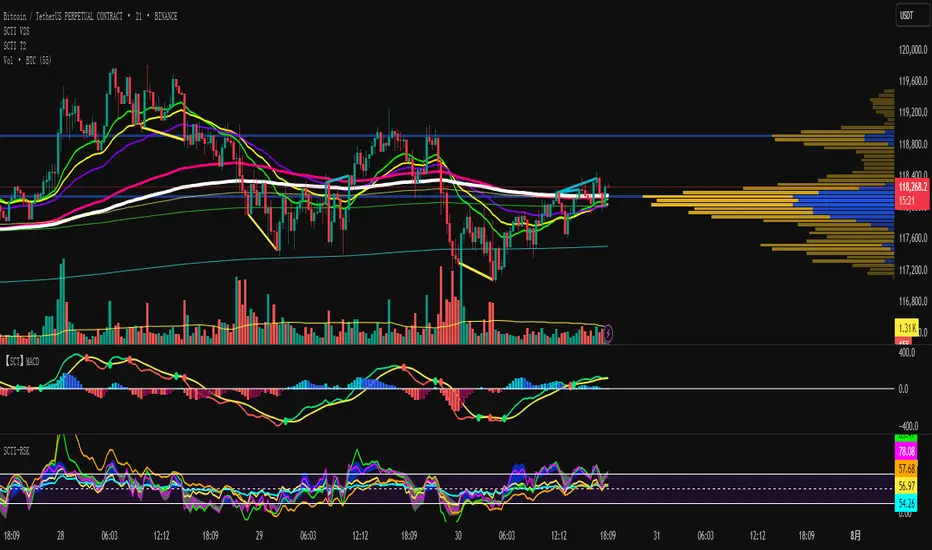
SCTI-MACDEnglish Description
SCTI-MACD is an advanced multi-feature MACD indicator that combines traditional MACD analysis with divergence detection and flexible display options. This enhanced version offers:
Key Features:
Customizable MACD parameters (fast EMA, slow EMA, signal line periods)
Multi-timeframe capability - analyze MACD from different timeframes on your current chart
Visual customization:
Toggle MACD line, signal line, and histogram visibility
Color-changing MACD line based on signal line crossovers
4-color histogram for better trend visualization
Signal cross markers
Advanced divergence detection:
Regular and hidden divergences for both histogram and MACD line
Configurable lookback periods and price reference (wicks or bodies)
Visual labels for easy identification
Flexible display options to show only the elements you need
The indicator helps identify trend direction, momentum shifts, and potential reversal points through its comprehensive divergence detection system.
中文描述
SCTI-MACD 是一个集成了多种功能的高级MACD指标,结合了传统MACD分析与背离检测功能,并提供灵活的显示选项。这个增强版本提供:
主要功能:
可定制的MACD参数(快EMA、慢EMA、信号线周期)
多时间周期功能 - 在当前图表上分析不同时间周期的MACD
可视化定制:
可切换显示MACD线、信号线和直方图
根据信号线交叉变化颜色的MACD线
四种颜色的直方图,提供更好的趋势可视化
信号交叉标记点
高级背离检测:
直方图和MACD线的常规背离和隐藏背离
可配置的回溯周期和价格参考(影线或实体)
视觉标签便于识别
灵活的显示选项,只显示您需要的元素
该指标通过其全面的背离检测系统,帮助识别趋势方向、动量变化和潜在反转点。
Publishing Notes
When uploading to the community, you may want to include:
Suggested Settings: Recommend your preferred parameter combinations
Usage Tips: Explain how to interpret the different divergence signals
Screenshots: Include images showing the indicator in action with different features enabled
Version Info: Note that it requires Pine Script v5
The indicator name "SCTI-MACD" suggests it may be part of a trading system or methodology - you may want to explain what "SCTI" stands for if it's meaningful to your approach.

SCTI V28Indicator Overview | 指标概述
English: SCTI V28 (Smart Composite Technical Indicator) is a multi-functional composite technical analysis tool that integrates various classic technical analysis methods. It contains 7 core modules that can be flexibly configured to show or hide components based on traders' needs, suitable for various trading styles and market conditions.
中文: SCTI V28 (智能复合技术指标) 是一款多功能复合型技术分析指标,整合了多种经典技术分析工具于一体。该指标包含7大核心模块,可根据交易者的需求灵活配置显示或隐藏各个组件,适用于多种交易风格和市场环境。
Main Functional Modules | 主要功能模块
1. Basic Indicator Settings | 基础指标设置
English:
EMA Display: 13 configurable EMA lines (default shows 8/13/21/34/55/144/233/377/610/987/1597/2584 periods)
PMA Display: 11 configurable moving averages with multiple MA types (ALMA/EMA/RMA/SMA/SWMA/VWAP/VWMA/WMA)
VWAP Display: Volume Weighted Average Price indicator
Divergence Indicator: Detects divergences across 12 technical indicators
ATR Stop Loss: ATR-based stop loss lines
Volume SuperTrend AI: AI-powered super trend indicator
中文:
EMA显示:13条可配置EMA均线,默认显示8/13/21/34/55/144/233/377/610/987/1597/2584周期
PMA显示:11条可配置移动平均线,支持多种MA类型(ALMA/EMA/RMA/SMA/SWMA/VWAP/VWMA/WMA)
VWAP显示:成交量加权平均价指标
背离指标:12种技术指标的背离检测系统
ATR止损:基于ATR的止损线
Volume SuperTrend AI:基于AI预测的超级趋势指标
2. EMA Settings | EMA设置
English:
13 independent EMA lines, each configurable for visibility and period length
Default shows 21/34/55/144/233/377/610/987/1597/2584 period EMAs
Customizable colors and line widths for each EMA
中文:
13条独立EMA均线,每条均可单独配置显示/隐藏和周期长度
默认显示21/34/55/144/233/377/610/987/1597/2584周期的EMA
每条EMA可设置不同颜色和线宽
3. PMA Settings | PMA设置
English:
11 configurable moving averages, each with:
Selectable types (default EMA, options: ALMA/RMA/SMA/SWMA/VWAP/VWMA/WMA)
Independent period settings (12-1056)
Special ALMA parameters (offset and sigma)
Configurable data source and plot offset
Support for fill areas between MAs
Price lines and labels can be added
中文:
11条可配置移动平均线,每条均可:
选择不同类型(默认EMA,可选ALMA/RMA/SMA/SWMA/VWAP/VWMA/WMA)
独立设置周期长度(12-1056)
设置ALMA的特殊参数(偏移量和sigma)
配置数据源和绘图偏移
支持MA之间的填充区域显示
可添加价格线和标签
4. VWAP Settings | VWAP设置
English:
Multiple anchor period options (Session/Week/Month/Quarter/Year/Decade/Century/Earnings/Dividends/Splits)
3 configurable standard deviation bands
Option to hide on daily and higher timeframes
Configurable data source and offset settings
中文:
多种锚定周期选择(会话/周/月/季/年/十年/世纪/财报/股息/拆股)
3条可配置标准差带
可选择在日线及以上周期隐藏
支持数据源选择和偏移设置
5. Divergence Indicator Settings | 背离指标设置
English:
12 detectable indicators: MACD, MACD Histogram, RSI, Stochastic, CCI, Momentum, OBV, VWmacd, Chaikin Money Flow, MFI, Williams %R, External Indicator
4 divergence types: Regular Bullish/Bearish, Hidden Bullish/Bearish
Multiple display options: Full name/First letter/Hide indicator name
Configurable parameters: Pivot period, data source, maximum bars checked, etc.
Alert functions: Independent alerts for each divergence type
中文:
检测12种指标:MACD、MACD柱状图、RSI、随机指标、CCI、动量、OBV、VWmacd、Chaikin资金流、MFI、威廉姆斯%R、外部指标
4种背离类型:正/负常规背离,正/负隐藏背离
多种显示选项:完整名称/首字母/不显示指标名称
可配置参数:枢轴点周期、数据源、最大检查柱数等
警报功能:各类背离的独立警报
6. ATR Stop Loss Settings | ATR止损设置
English:
Configurable ATR length (default 13)
4 smoothing methods (RMA/SMA/EMA/WMA)
Adjustable multiplier (default 1.618)
Displays long and short stop loss lines
中文:
可配置ATR长度(默认13)
4种平滑方法(RMA/SMA/EMA/WMA)
可调乘数(默认1.618)
显示多头和空头止损线
7. Volume SuperTrend AI Settings | Volume SuperTrend AI设置
English:
AI Prediction:
Configurable neighbors (1-100) and data points (1-100)
Price trend length and prediction trend length settings
SuperTrend Parameters:
Length (default 3)
Factor (default 1.515)
5 MA source options (SMA/EMA/WMA/RMA/VWMA)
Signal Display:
Trend start signals (circle markers)
Trend confirmation signals (triangle markers)
6 Alerts: Various trend start and confirmation signals
中文:
AI预测功能:
可配置邻居数(1-100)和数据点数(1-100)
价格趋势长度和预测趋势长度设置
SuperTrend参数:
长度(默认3)
因子(默认1.515)
5种MA源选择(SMA/EMA/WMA/RMA/VWMA)
信号显示:
趋势开始信号(圆形标记)
趋势确认信号(三角形标记)
6种警报:各类趋势开始和确认信号
Usage Recommendations | 使用建议
English:
Trend Analysis: Use EMA/PMA combinations to determine market trends, with long-period EMAs (e.g., 144/233) as primary trend references
Divergence Trading: Look for potential reversals using price-indicator divergences
Stop Loss Management: Use ATR stop loss lines for risk management
AI Assistance: Volume SuperTrend AI provides machine learning-based trend predictions
Multiple Timeframes: Verify signals across different timeframes
中文:
趋势分析:使用EMA/PMA组合判断市场趋势,长周期EMA(如144/233)作为主要趋势参考
背离交易:结合价格与指标的背离寻找潜在反转点
止损设置:利用ATR止损线管理风险
AI辅助:Volume SuperTrend AI提供基于机器学习的趋势预测
多时间框架:建议在不同时间框架下验证信号
Parameter Configuration Tips | 参数配置技巧
English:
For short-term trading: Focus on 8-55 period EMAs and shorter divergence detection periods
For long-term investing: Use 144-2584 period EMAs with longer detection parameters
In ranging markets: Disable some EMAs, mainly rely on VWAP and divergence indicators
In trending markets: Enable more EMAs and SuperTrend AI
中文:
对于短线交易:可重点关注8-55周期的EMA和较短的背离检测周期
对于长线投资:建议使用144-2584周期的EMA和较长的检测参数
在震荡市:可关闭部分EMA,主要依靠VWAP和背离指标
在趋势市:可启用更多EMA和SuperTrend AI
Update Log | 更新日志
English:
V28 main updates:
Added Volume SuperTrend AI module
Optimized divergence detection algorithm
Added more EMA period options
Improved UI and parameter grouping
中文:
V28版本主要更新:
新增Volume SuperTrend AI模块
优化背离检测算法
增加更多EMA周期选项
改进用户界面和参数分组
Final Note | 最后说明
English: This indicator is suitable for technical traders with some experience. We recommend practicing with demo trading to familiarize yourself with all features before live trading.
中文: 该指标适合有一定经验的技术分析交易者使用,建议先通过模拟交易熟悉各项功能后再应用于实盘。

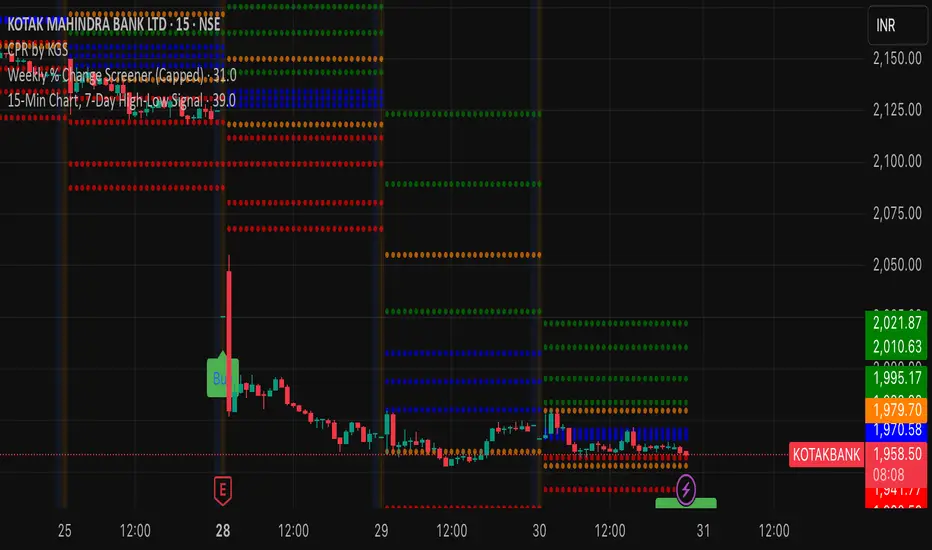
15-Min Chart, 7-Day High-Low SignalThis is a updated script to check for variances above 5% on buy and sell signals. This will help with mean reversion. Test before buying.
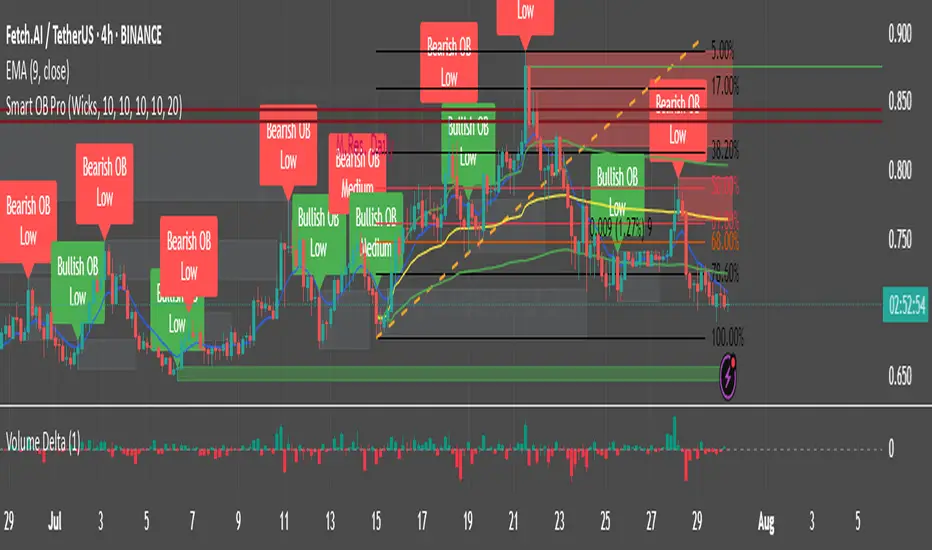
Smart Order Blocks [Pro Version]Here’s a **clear, detailed "How It Works" explanation** for this indicator:
---
## ✅ **Smart Order Blocks \ – How It Works**
### **Purpose**
This indicator detects **Order Blocks (OBs)** based on **pivot highs and lows**, and automatically marks **Bullish** and **Bearish OB zones** on the chart with optional extensions and alerts. It is designed to help traders identify **institutional price levels** where liquidity is often engineered for future price moves.
---
### **Customization Options**
✔ **Source** → Choose between Wicks or Bodies for OB calculation.
✔ **Pivot Settings** → Adjust sensitivity for detecting pivots.
✔ **Extend OBs** → Keep zones visible until tapped, or fix a specific width.
✔ **Show Labels** → Displays OB type and strength on chart.
✔ **Colors** → Configure Bullish, Bearish, and Invalid OB colors.
---
### **Practical Usage**
* **Entry Strategy**:
* Wait for price to **revisit a Bullish OB** in an uptrend → Long entry.
* Wait for price to **revisit a Bearish OB** in a downtrend → Short entry.
* Combine with:
* **Market Structure (HH/HL or LH/LL)**.
* **Confirmation signals** (e.g., candlestick pattern, break of structure).
* **Risk Management** → Stop loss outside OB zone.
---
### ✅ **Summary in One Sentence**
The indicator automatically identifies **institutional OB zones**, shows their strength, extends them until mitigated, and alerts you when price interacts with these key liquidity levels, helping you trade like Smart Money.
---
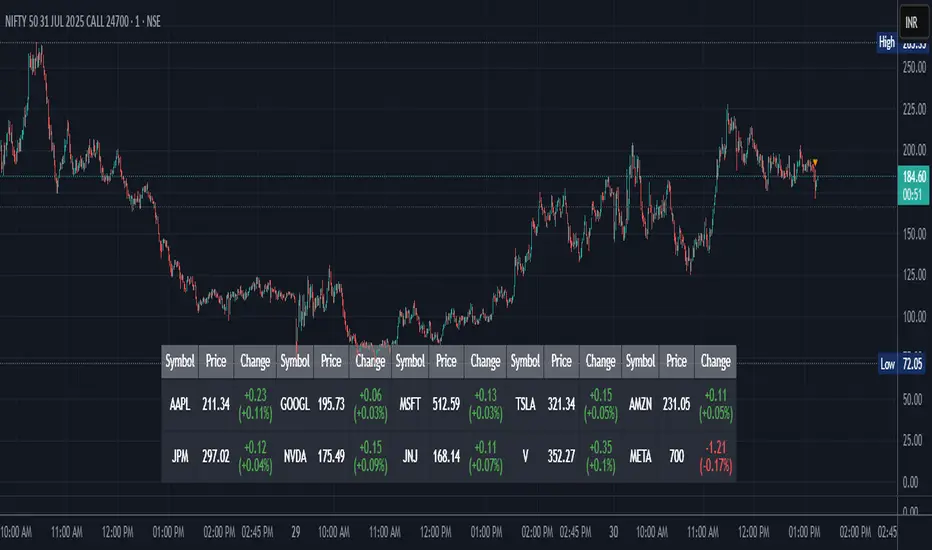
Stock Table aiTrendviewProfessional Stock Market Monitoring Table (Pine Script v5)
This indicator is a real-time multi-asset monitoring table designed for professional traders, analysts, and portfolio managers using TradingView. Built with Pine Script v5, it enables users to track up to 10 instruments (stocks, indices, forex pairs, cryptocurrencies, or commodities) in a unified table embedded directly into the chart. It is intended to streamline portfolio monitoring, cross-market analysis, and rapid visual comparison of asset performance.
The core logic of this script involves retrieving live price data through TradingView’s request.security() function for each of the selected symbols. It calculates both absolute price change and percentage price change relative to the previous bar close. This ensures users can see real-time movements in each asset’s price. These calculations are updated at the close of every bar to optimize performance and reduce processing load using the barstate.islast condition.
The display structure is dynamically generated using table.new() and related functions. Internally, the script stores symbol and price data in arrays for efficient processing. Symbols are cleaned to remove exchange prefixes (e.g., "NASDAQ:", "BINANCE:") so only the ticker name is displayed. Based on the selected layout (1 to 5 columns), the table auto-adjusts its row structure to maintain clarity and symmetry. Each cell reflects the ticker symbol, current price, and changes, with conditional formatting applied to indicate price movement direction using green (positive), red (negative), or neutral colors.
Users can customize many visual elements including text size, color themes, transparency, table position, and whether headers are shown. The script includes built-in fallbacks for invalid symbols or empty data, ensuring robustness and uninterrupted performance during live market hours.
Use cases include:
Intraday traders monitoring multiple instruments simultaneously.
Swing traders assessing relative strength and correlation.
Portfolio managers scanning asset performance without switching charts.
Analysts preparing multi-asset presentations or watchlists.
To use the tool:
Paste the Pine Script into the Pine Editor.
Add the script to the chart.
Enter your desired symbols via the input fields.
Customize table position, layout, size, and color to suit your workspace.
This script does not provide trade signals or financial advice. It is purely a market visualization and data presentation tool. All calculations are based on live chart data and are synchronized with the chart’s timeframe.
Disclaimer from aiTrendview:
This script is a visual tool developed for market awareness and comparative observation. It does not constitute financial advice or guarantee trading results. aiTrendview and its affiliates are not responsible for any losses arising from decisions made based on this tool. All trading involves risk, and past performance is not indicative of future results. Always consult with a qualified financial advisor before making trading decisions.