Average True Range with MAATR + Smoothing (SMA or EMA)
Default :
- 9 SMA
What is it for ?
- change of ATR to check sideway or trend
Chart patterns

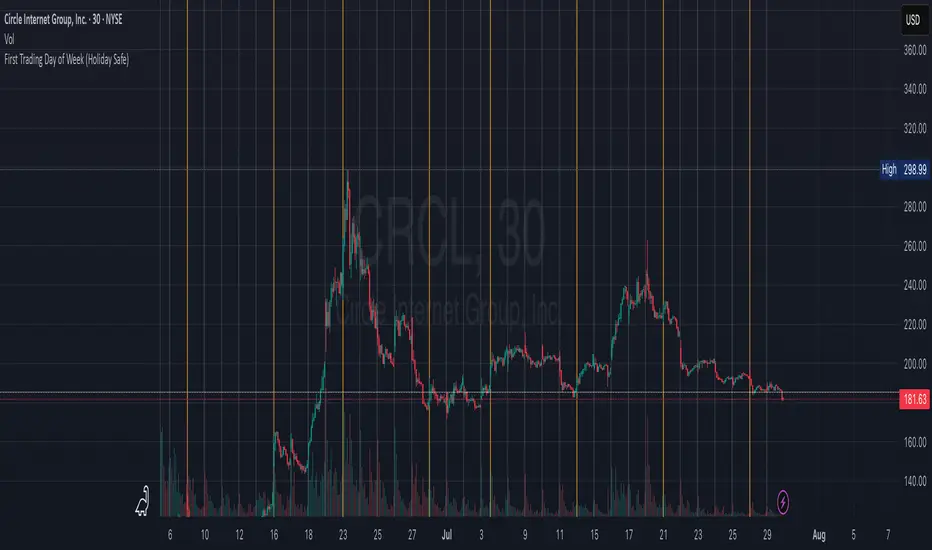
First Trading Day of Week (Holiday Safe)Highlights the first Monday of each trading week to help visualize weekly trend shifts.
Key Session LevelsKey Session Levels - Indicator Guide
Created by: MecarderoAurum
Why This Indicator Exists: An Overview
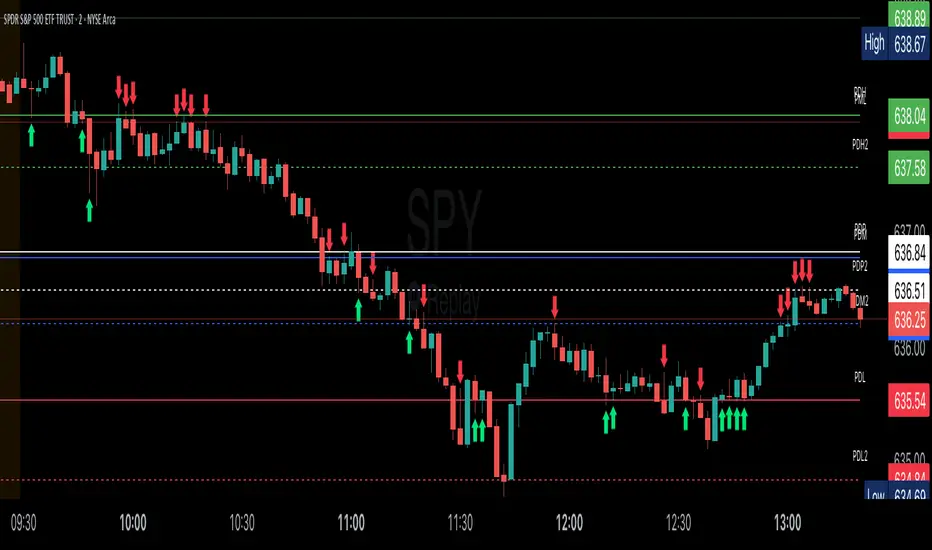
The "Key Session Levels" indicator is a comprehensive tool for day traders that automatically plots the most critical price levels from the current premarket and the previous two full trading days. These levels are watched by countless traders and often act as significant areas of support and resistance.
This indicator provides a clear, objective map of these key zones, helping traders anticipate potential turning points, identify areas of confluence, and make more informed trading decisions without having to manually draw and manage these lines every day.
Features & How to Use Them
This indicator plots several types of important historical levels on your chart. Each one is fully customizable.
1. Premarket Levels (PMH / PML)
What they are: The highest (PMH) and lowest (PML) prices reached during the current day's premarket session (04:00 - 09:30 ET).
Why they matter: The premarket high and low are the first significant levels established for the trading day. They often act as initial support or resistance once the market opens.
How to use them: In the settings under "Premarket Levels," you can toggle the visibility of the PMH and PML, and customize their color, line style, and width.
2. Prior Day Levels (PDH / PDL / PDM / PDP)
What they are: The key price points from the previous full trading day.
PDH: Prior Day High
PDL: Prior Day Low
PDM: Prior Day Midpoint (the exact middle of the PDH and PDL)
PDP: Prior Day Pivot (a classic pivot point calculation)
Why they matter: These are often the most important levels for the current trading day. The market frequently tests the previous day's high and low.
How to use them: Under the "Prior Day" settings, you can enable or disable each of these four levels and customize their appearance.
3. 2-Day Prior Levels (PDH2 / PDL2 / etc.)
What they are: The same set of key levels (High, Low, Mid, Pivot) from two trading days ago.
Why they matter: These levels can still be highly relevant, especially if the market is trading within a multi-day range or returning to test a significant prior level.
How to use them: Under the "2-Day Prior" settings, you can customize the visibility and style of these levels. They are styled with more transparency by default to distinguish them from the more recent prior day's levels.
4. General Settings
Days of History: This setting allows you to control how many past days of historical lines are kept on your chart. This is excellent for back-testing strategies and seeing how price has reacted to these levels in the past.
Label Settings: You can customize the color and size of the on-chart labels (e.g., "PDH," "PML") for better visibility.
Sample Strategy: The Key Level Rejection
This strategy focuses on using the indicator's levels to identify potential reversals at key areas of support or resistance.
Identify a Key Level: Watch as the price approaches a significant level plotted by the indicator, such as the Prior Day High (PDH) or the Premarket Low (PML).
Look for Rejection: Do not trade simply because the price touches the level. Wait for a price action signal that confirms the level is holding. This could be a bearish engulfing candle or a shooting star pattern at a resistance level like PDH, or a bullish hammer or morning star pattern at a support level like PML.
Entry: Once you see a clear rejection candle, enter a trade in the direction of the rejection. For a bearish rejection at the PDH, you would enter a short position.
Stop-Loss: A logical place for a stop-loss is just above the high of the rejection candle (for a short trade) or just below the low of the rejection candle (for a long trade). This defines your risk clearly.
Profit Target: Your first profit target could be the next key level plotted by the indicator. For example, if you shorted a rejection at the PDH, your first target might be the Premarket High (PMH) or the day's opening price.
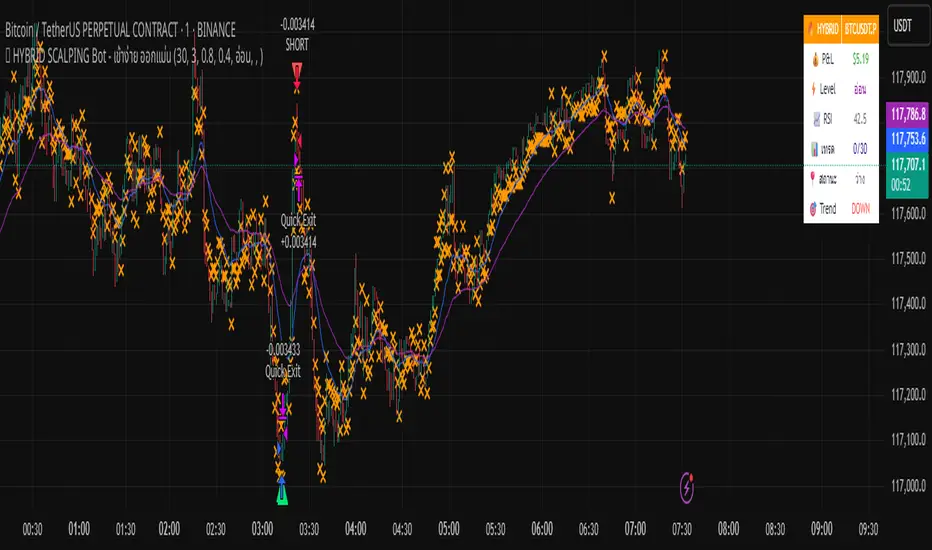
🔥 HYBRID SCALPING Bot - เข้าง่าย ออกแม่นA tool bot that helps analyze charts accurately, focusing on profits.
Harmonic BloomHarmonic Bloom - Advanced Geometric Analysis
Building upon my previous Fibonacci inspired indicator "TrendZone", Harmonic Bloom is a sophisticated geometric trading indicator inspired by W.D. Gann's legendary market geometry principles. It reveals market structure through three key pivot points and dynamic angular analysis, creating powerful harmonic intersections for precision trading.
🎯 Core Features:
📍 Three-Point Gann System:
Set 3 custom pivot points to define your analysis timeframe
Automatic trend detection (bullish/bearish) between pivots
Dynamic geometric box construction following Gann's square principles
📐 Gann-Style 45° Angle Projections:
Pivot 2 Line: Follows trend direction (up if bullish, down if bearish)
Pivot 3 Line: Creates opposition (opposite direction to Pivot 2)
Corner Line: Mirrors Pivot 2 from appropriate box corner
All angles project forward using Gann's 1x1 (45°) methodology for future price targets
⚡ POWER OF HARMONIC INTERSECTIONS:
Confluence Zones: Where multiple 45° angles intersect create the strongest support/resistance
Geometric Harmony: Intersections represent natural market turning points
Time-Price Balance: Following Gann's principle that time and price must be in harmony
Multiple Timeframe Resonance: Intersection points often align across different timeframes
High-Probability Reversals: Markets frequently respect these geometric intersection levels
📊 Customizable Retracement Levels:
8 fully configurable levels (default: 0.0, 0.25, 0.5, 0.75, 1.0, 1.25, 1.5, 1.75)
Choose between 25% or 50% trendline alignment
Individual style controls for each level
🔢 Advanced Gann Analytics:
Fibonacci sequence detection in bar counts (Gann studied natural number sequences)
Numerology sum analysis on pivot prices (Gann's mystical number approach)
Special highlighting for significant numbers
Optional on-chart labels for key metrics
📈 Trading Applications:
✅ Support/Resistance: Use retracement levels for entry/exit points
✅ Gann Angles: 45° lines show momentum direction and strength following Gann's time-price theory
✅ Intersection Trading: Most powerful signals occur at harmonic intersections where multiple angles converge
✅ Price Targets: Forward projections provide future price objectives using Gann's geometric principles
✅ Market Geometry: Identify harmonic patterns and geometric confluences
✅ Time Analysis: Fibonacci-based bar counting for timing decisions (Gann emphasized time cycles)
🌟 Why Harmonic Intersections Are So Powerful:
Gann believed that markets move in geometric harmony, and when multiple angles intersect, they create "magnetic price levels" where:
Maximum Energy Convergence: Multiple geometric forces meet at one point
Natural Turning Points: Markets respect these intersections as natural support/resistance
Time-Price Synchronicity: Intersections often coincide with significant time cycles
Multi-Dimensional Confirmation: Price, time, and geometry align simultaneously
⚙️ Highly Customizable:
All colors, widths, and styles adjustable
Toggle any feature on/off independently
Extend projections beyond the analysis box
Choose your preferred visual presentation
Perfect for traders who use Gann theory, geometric analysis, harmonic patterns, and mathematical market structure. The true power lies in trading the intersection points where multiple harmonic angles converge - these represent the market's most significant geometric turning points.

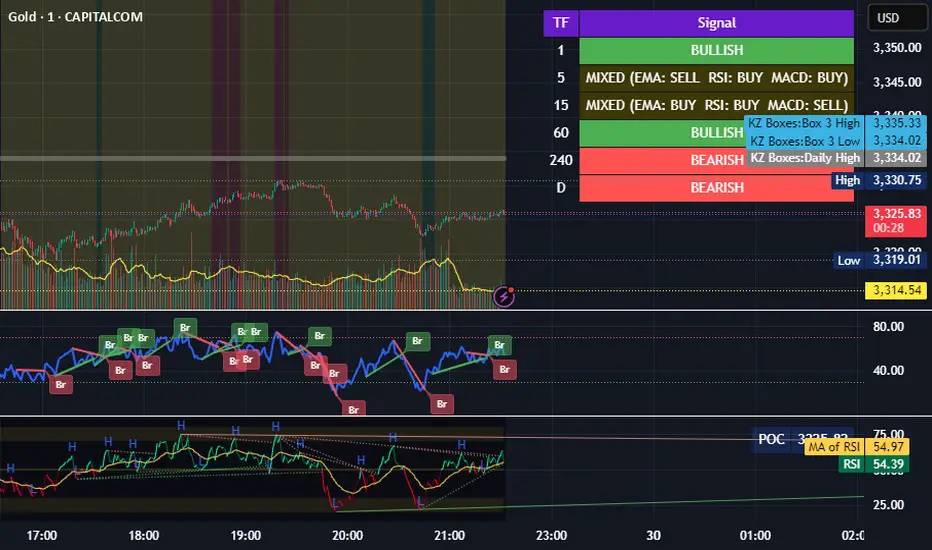
TF Alignment - Multi TF EMA/MACD/RSIThis is my first special indicator that aligns multiple timeframes.
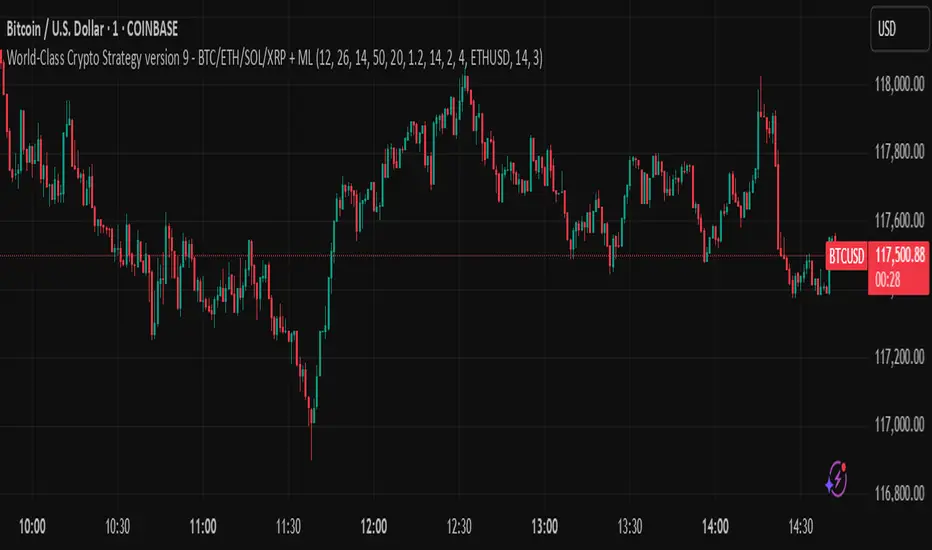
World-Class Crypto Strategy version 9 - BTC/ETH/SOL/XRP + MLScript intended to mirror BlackRock strategies and be used with fully integrated trading bot
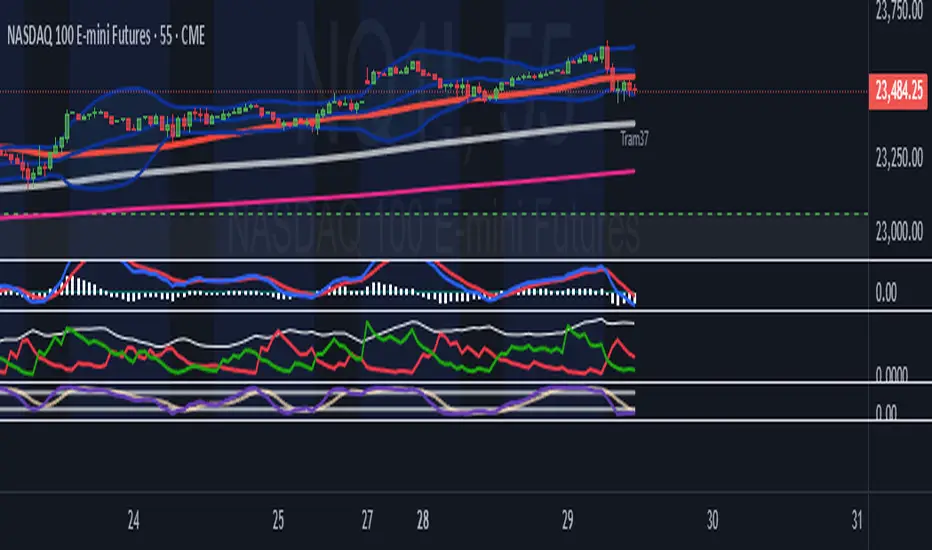
Tram37This indicator calculates and plots a 377-day Simple Moving Average (SMA) based on the closing price, designed for long-term trend analysis. The fixed 377-day period helps smooth out short-term fluctuations, providing a clear view of the underlying trend for long-term trading or investment strategies.
Volume Footprint Anomaly Scanner [PhenLabs]📊 PhenLabs - Volume Footprint Anomaly Scanner (VFAS)
Version: PineScript™ v6
📌 Description
The PhenLabs Volume Footprint Anomaly Scanner (VFAS) is an advanced Pine Script indicator designed to detect and highlight significant imbalances in buying and selling pressure within individual price bars. By analyzing a calculated "Delta" – the net difference between estimated buy and sell volume – and employing statistical Z-score analysis, VFAS pinpoints moments when buying or selling activity becomes unusually dominant. This script was created not in hopes of creating a "Buy and Sell" indicator but rather providing the user with a more in-depth insight into the intrabar volume delta and how it can fluctuate in unusual ways, leading to anomalies that can be capitalized on.
This indicator helps traders identify high-conviction points where strong market participants are active, signaling potential shifts in momentum or continuation of a trend. It aims to provide a clearer understanding of underlying market dynamics, allowing for more informed decision-making in various trading strategies, from identifying entry points to confirming trend strength.
🚀 Points of Innovation
● Z-Score for Delta Analysis : Utilizes statistical Z-scores to objectively identify statistically significant anomalies in buying/selling pressure, moving beyond simple, arbitrary thresholds.
● Dynamic Confidence Scoring : Assigns a multi-star confidence rating (1-4 stars) to each signal, factoring in high volume, trend alignment, and specific confirmation criteria, providing a nuanced view of signal strength.
● Integrated Trend Filtering : Offers an optional Exponential Moving Average (EMA)-based trend filter to ensure signals align with the broader market direction, reducing false positives in ranging markets.
● Strict Confirmation Logic : Implements specific confirmation criteria for higher-confidence signals, including price action and a time-based gap from previous signals, enhancing reliability.
● Intuitive Info Dashboard : Provides a real-time summary of market trend and the latest signal's direction and confidence directly on the chart, streamlining information access.
🔧 Core Components
● Core Delta Engine : Estimates the net buying/selling pressure (bar Delta) by analyzing price movement within each bar relative to volume. It also calculates average volume to identify bars with unusually high activity.
● Anomaly Detection (Z-Score) : Computes the Z-score for the current bar's Delta, indicating how many standard deviations it is from its recent average. This statistical measure is central to identifying significant anomalies.
● Trend Filter : Utilizes a dual Exponential Moving Average (EMA) cross-over system to define the prevailing market trend (uptrend, downtrend, or range), providing contextual awareness.
● Signal Processing & Confidence Algorithm : Evaluates anomaly conditions against trend filters and confirmation rules, then calculates a dynamic confidence score to produce actionable, contextualized signal information.
🔥 Key Features
● Advanced Delta Anomaly Detection : Pinpoints bars with exceptionally high buying or selling pressure, indicating potential institutional activity or strong market conviction.
● Multi-Factor Confidence Scoring : Each signal comes with a 1-4 star rating, clearly communicating its reliability based on high volume, trend alignment, and specific confirmation criteria.
● Optional Trend Alignment : Users can choose to filter signals, so only those aligned with the prevailing EMA-defined trend are displayed, enhancing signal quality.
● Interactive Signal Labels : Displays compact labels on the chart at anomaly points, offering detailed tooltips upon hover, including signal type, direction, confidence, and contextual information.
● Customizable Bar Colors : Visually highlights bars with Delta anomalies, providing an immediate visual cue for strong buying or selling activity.
● Real-time Info Dashboard : A clean, customizable dashboard shows the current market trend and details of the latest detected signal, keeping key information accessible at a glance.
● Configurable Alerts : Set up alerts for bullish or bearish Delta anomalies to receive real-time notifications when significant market pressure shifts occur.
🎨 Visualization
Signal Labels :
* Placed at the top/bottom of anomaly bars, showing a "📈" (bullish) or "📉" (bearish) icon.
* Tooltip: Hovering over a label reveals detailed information: Signal Type (e.g., "Delta Anomaly"), Direction, Confidence (e.g., "★★★☆"), and a descriptive explanation of the anomaly.
* Interpretation: Clearly marks actionable signals and provides deep insights without cluttering the chart, enabling quick assessment of signal strength and context.
● Info Dashboard :
* Located at the top-right of the chart, providing a clean summary.
* Displays: "PhenLabs - VFAS" header, "Market Trend" (Uptrend/Downtrend/Range with color-coded status), and "Direction | Conf." (showing the last signal's direction and star confidence).
* Optional "💡 Hover over signals for details" reminder.
* Interpretation: A concise, real-time summary of the market's pulse and the most recent high-conviction event, helping traders stay informed at a glance.
📖 Usage Guidelines
Setting Categories
⚙️ Core Delta & Volume Engine
● Minimum Volume Lookback (Bars)
○ Default: 9
○ Range: Integer (e.g., 5-50)
○ Description: Defines the number of preceding bars used to calculate the average volume and delta. Bars with volume below this average won't be considered for high-volume signals. A shorter lookback is more reactive to recent changes, while a longer one provides a smoother average.
📈 Anomaly Detection Settings
Delta Z-Score Anomaly Threshold
○ Default: 2.5
○ Range: Float (e.g., 1.0-5.0+)
○ Description: The number of standard deviations from the mean that a bar's delta must exceed to be considered a significant anomaly. A higher threshold means fewer, but potentially stronger, signals. A lower threshold will generate more signals, which might include less significant events. Experiment to find the optimal balance for your trading style.
🔬 Context Filters
Enable Trend Filter
○ Default: False
○ Range: Boolean (True/False)
○ Description: When enabled, signals will only be generated if they align with the current market trend as determined by the EMAs (e.g., only bullish signals in an uptrend, bearish in a downtrend). This helps to filter out counter-trend noise.
● Trend EMA Fast
○ Default: 50
○ Range: Integer (e.g., 10-100)
○ Description: The period for the faster Exponential Moving Average used in the trend filter. In combination with the slow EMA, it defines the trend direction.
● Trend EMA Slow
○ Default: 200
○ Range: Integer (e.g., 100-400)
○ Description: The period for the slower Exponential Moving Average used in the trend filter. The relationship between the fast and slow EMA determines if the market is in an uptrend (fast > slow) or downtrend (fast < slow).
🎨 Visual & UI Settings
● Show Info Dashboard
○ Default: True
○ Range: Boolean (True/False)
○ Description: Toggles the visibility of the dashboard on the chart, which provides a summary of market trend and the last detected signal.
● Show Dashboard Tooltip
○ Default: True
○ Range: Boolean (True/False)
○ Description: Toggles a reminder message in the dashboard to hover over signal labels for more detailed information.
● Show Delta Anomaly Bar Colors
○ Default: True
○ Range: Boolean (True/False)
○ Description: Enables or disables the coloring of bars based on their delta direction and whether they represent a significant anomaly.
● Show Signal Labels
○ Default: True
○ Range: Boolean (True/False)
○ Description: Controls the visibility of the “📈” or “📉” labels that appear on the chart when a delta anomaly signal is generated.
🔔 Alert Settings
Alert on Delta Anomaly
○ Default: True
○ Range: Boolean (True/False)
○ Description: When enabled, this setting allows you to set up alerts in TradingView that will trigger whenever a new bullish or bearish delta anomaly is detected.
✅ Best Use Cases
Early Trend Reversal / Continuation Detection: Identify strong surges of buying/selling pressure at key support/resistance levels that could indicate a reversal or the continuation of a strong move.
● Confirmation of Breakouts: Use high-confidence delta anomalies to confirm the validity of price breakouts, indicating strong conviction behind the move.
● Entry and Exit Points: Pinpoint precise entry opportunities when anomalies align with your trading strategy, or identify potential exhaustion signals for exiting trades.
● Scalping and Day Trading: The indicator’s sensitivity to intraday buying/selling imbalances makes it highly effective for short-term trading strategies.
● Market Sentiment Analysis: Gain a real-time understanding of underlying market sentiment by observing the prevalence and strength of bullish vs. bearish anomalies.
⚠️ Limitations
Estimated Delta: The script uses a simplified method to estimate delta based on bar close relative to its range, not actual order book or footprint data. While effective, it’s an approximation.
● Sensitivity to Z-Score Threshold: The effectiveness heavily relies on the `Delta Z-Score Anomaly Threshold`. Too low, and you’ll get many false positives; too high, and you might miss valid signals.
● Confirmation Criteria: The 4-star confidence level’s “confirmation” relies on specific subsequent bar conditions and previous confirmed signals, which might be too strict or specific for all contexts.
● Requires Context: While powerful, VFAS is best used in conjunction with other technical analysis tools and price action to form a comprehensive trading strategy. It is not a standalone “buy/sell” signal.
💡 What Makes This Unique
Statistical Rigor: The application of Z-score analysis to bar delta provides an objective, statistically-driven way to identify true anomalies, moving beyond arbitrary thresholds.
● Multi-Factor Confidence Scoring: The unique 1-4 star confidence system integrates multiple market dynamics (volume, trend alignment, specific follow-through) into a single, easy-to-interpret rating.
● User-Friendly Design: From the intuitive dashboard to the detailed signal tooltips, the indicator prioritizes clear and accessible information for traders of all experience levels.
🔬 How It Works
1. Bar Delta Calculation:
● The script first estimates the “buy volume” and “sell volume” for each bar. This is done by assuming that volume proportional to the distance from the low to the close represents buying, and volume proportional to the distance from the high to the close represents selling.
● How this contributes: This provides a proxy for the net buying or selling pressure (delta) within that specific price bar, even without access to actual footprint data.
2. Volume & Delta Z-Score Analysis:
● The average volume over a user-defined lookback period is calculated. Bars with volume less than twice this average are generally considered of lower interest.
● The Z-score for the calculated bar delta is computed. The Z-score measures how many standard deviations the current bar’s delta is from its average delta over the `Minimum Volume Lookback` period.
● How this contributes: A high positive Z-score indicates a bullish delta anomaly (significantly more buying than usual), while a high negative Z-score indicates a bearish delta anomaly (significantly more selling than usual). This identifies statistically unusual levels of pressure.
3. Trend Filtering (Optional):
● Two Exponential Moving Averages (Fast and Slow EMA) are used to determine the prevailing market trend. An uptrend is identified when the Fast EMA is above the Slow EMA, and a downtrend when the Fast EMA is below the Slow EMA.
● How this contributes: If enabled, the indicator will only display bullish delta anomalies during an uptrend and bearish delta anomalies during a downtrend, helping to confirm signals within the broader market context and avoid counter-trend signals.
4. Signal Generation & Confidence Scoring:
● When a delta Z-score exceeds the user-defined anomaly threshold, a signal is generated.
● This signal is then passed through a multi-factor confidence algorithm (`f_calculateConfidence`). It awards stars based on: high volume presence, alignment with the overall trend (if enabled), and a fourth star for very strong Z-scores (above 3.0) combined with specific follow-through candle patterns after a cooling-off period from a previous confirmed signal.
● How this contributes: Provides a qualitative rating (1-4 stars) for each anomaly, allowing traders to quickly assess the potential significance and reliability of the signal.
💡 Note:
The PhenLabs Volume Footprint Anomaly Scanner is a powerful analytical tool, but it’s crucial to understand that no indicator guarantees profit. Always backtest and forward-test the indicator settings on your chosen assets and timeframes. Consider integrating VFAS with your existing trading strategy, using its signals as confirmation for entries, exits, or trend bias. The Z-score threshold is highly customizable; lower values will yield more signals (including potential noise), while higher values will provide fewer but potentially higher-conviction signals. Adjust this parameter based on market volatility and your risk tolerance. Remember to combine statistical insights from VFAS with price action, support/resistance levels, and your overall market outlook for optimal results.

🔫 10:00 AM Candle Range – Bhavishya Sniper ScriptMarks the 10:00 AM candle high and low for intraday breakout trading. Designed for Bhavishya’s sniper entry system during Trading Reset 3.0."

Elite 30 Min Pivot - by TenAM Trader.🔍 How It Works
Trend Detection:
A trend is defined when a configurable number (default: 3) of same-colored candles (green or red) appear in a row.
The pivot is marked by the first opposite-color candle after the trend.
Signal Logic:
After the pivot forms, the script watches the next few candles (default: 2) for a breakout or close beyond the pivot high/low.
A BUY signal is triggered when price breaks/closes above a pivot high from a downtrend.
A SELL signal is triggered when price breaks/closes below a pivot low from an uptrend.
Entry & Risk Tools:
Optional features include:
Pivot Line – dashed level showing pivot entry point.
Stop Loss Line – opposite side of the pivot candle.
Labels – toggle labels for clarity on entry and risk.
Time Filter – exclude signals during specific hours (e.g. 11 AM–2 PM) to avoid lunchtime chop.
Alerts:
Enable alerts for automated notifications when buy or sell conditions are met.
⚙️ Customizable Settings
Consecutive candles required before pivot
Max bars allowed after pivot for signal
Signal trigger: Break or Close
Toggle visibility of pivot lines, stop loss, and labels
Set excluded time blocks
Enable/disable real-time alerts
✅ Use Case Example
If you set trend length to 3 and signal trigger to “Break,” the script will look for 3 consecutive red candles, then a green candle (pivot). If price breaks above the pivot high within the next 2 candles, a Buy signal will fire.
⚠️ Legal Note
This script is provided for educational and informational purposes only and does not constitute financial advice. Always do your own research before making trading decisions. Use at your own risk.

Intraday Bullish Scanner - Profit Ping📊 Intraday Bullish Scanner – Profit Ping Only
This custom-built TradingView script identifies high-probability intraday BUY signals on the 15-minute chart, confirmed by volume, momentum, and price action. It uses:
✅ EMA 7/14 crossovers
✅ Bullish candlestick patterns (Engulfing, Piercing, etc.)
✅ Volume spikes above 20-MA
✅ RSI between 55–65
✅ MACD histogram flip from red to green
✅ Cross-confirmation with the 30-minute trend
Once in a trade, it activates a dynamic trailing stop (starting at 2%, tightening to 1% as profit and volume increase). SELL signals are confirmed only with:
❌ MACD turning red
❌ Bearish RSI movement or drop below 50
❌ EMA 7 crossing below EMA 14
❌ A bearish candlestick (Engulfing or Piercing)
❌ Volume spike on a red candle
💰 When all SELL conditions align, a yellow triangle appears. BUYs are marked with a white triangle. Alerts can be connected directly to Python/webhook systems for full automation with IBKR.

Railway Track Pattern - Nifty 50//@version=5
indicator("Railway Track Pattern - Nifty 50", overlay=true)
// Settings
bodyThreshold = input.float(0.8, title="Minimum Body Overlap (%)", minval=0.5, maxval=1.0)
// Candle Body Sizes
bodySize1 = math.abs(close - open )
bodySize2 = math.abs(close - open)
// Candle Directions
isBullishRail = close < open and close > open // Red followed by Green
isBearishRail = close > open and close < open // Green followed by Red
// Overlap Check (at least 80% body overlap)
overlapLow = math.max(open , close )
overlapHigh = math.min(open , close )
overlapLow2 = math.max(open, close)
overlapHigh2 = math.min(open, close)
bodyOverlap = math.min(overlapHigh, overlapHigh2) - math.max(overlapLow, overlapLow2)
minBodySize = math.min(bodySize1, bodySize2)
overlapRatio = bodyOverlap / minBodySize
railwayBullish = isBullishRail and overlapRatio >= bodyThreshold
railwayBearish = isBearishRail and overlapRatio >= bodyThreshold
// Plotting
plotshape(railwayBullish, title="Bullish Railway", style=shape.labelup, location=location.belowbar, color=color.green, text="🚆 Buy")
plotshape(railwayBearish, title="Bearish Railway", style=shape.labeldown, location=location.abovebar, color=color.red, text="🚆 Sell")

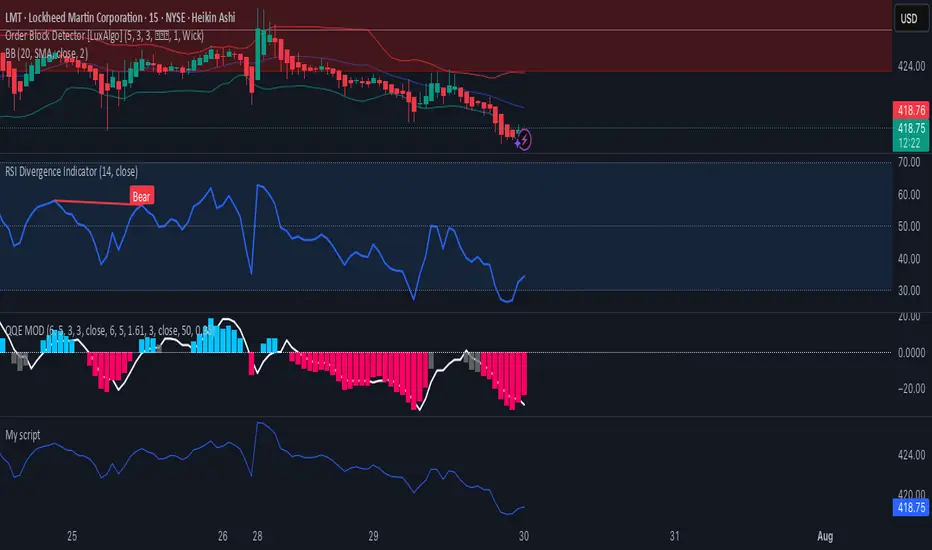
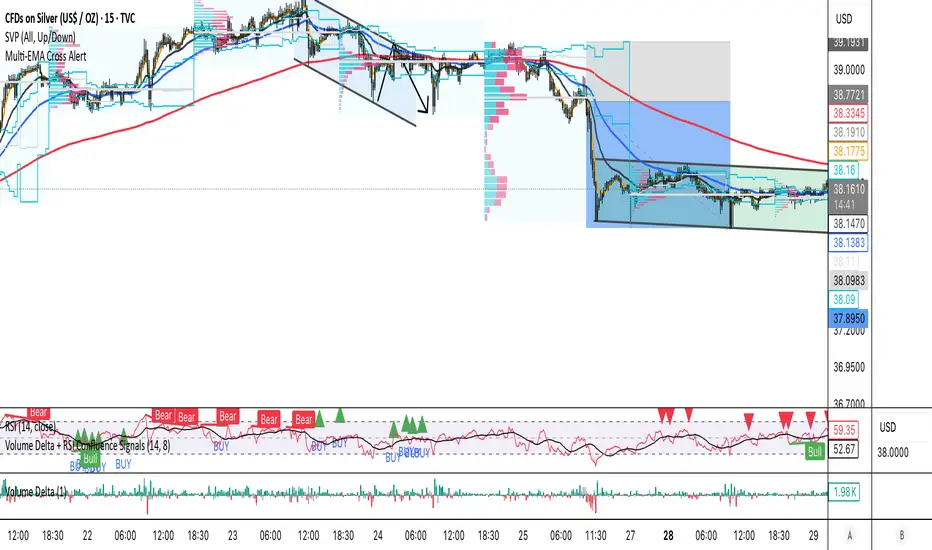
Volume Delta + RSI Confluence SignalsEfficient buy and sell signal scans for real trades using volume delta, rsi rejection and some more.
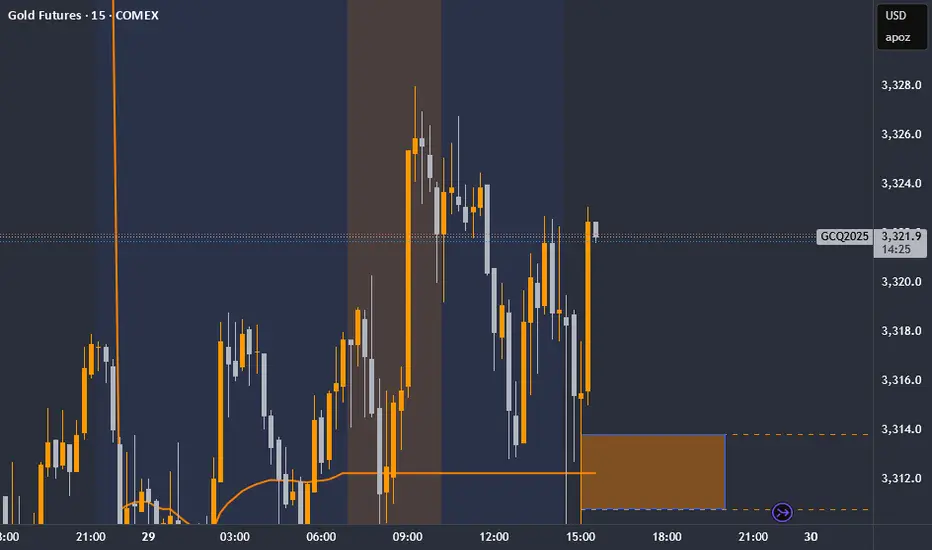
MJBFX-Strategy (Futures Optimized)The MJBFX-Strategy is a complete market mapping tool designed to give traders a clear view of liquidity, session dynamics, and premium/discount levels. It loads automatically on any chart, fully optimized for futures and forex trading.
🔑 Key Features
Asian Session Range
Highlights the previous Asian session with a shaded box
Fixed until London open for precise reference
VWAP from Asian Session
Plots the VWAP of the previous Asian session
Dynamic fair value benchmark for intraday trading
Liquidity Sweeps (Optimized)
Detects sweeps of the Asian session high/low
Shown only on 30m, 1h, and 4h charts to reduce noise
Clean, minimal labels for clarity
Automatic Fibonacci Zone
Draws a shaded retracement zone (38.2%–61.8%) of the Asian range
Transparent fill makes it easy to read price action
Killzones
Highlights London (07:00–10:00) and New York (13:00–16:00) killzones
Semi-opaque shading to keep charts clean
Auto Trade Box (Risk/Reward)
On sweep confirmation, plots a 2R target box
Auto stop loss and take profit levels based on futures tick size
🎯 Why Use It?
The MJBFX-Strategy removes the need for manual drawing.It automatically maps:
Session highs and lows
Liquidity sweeps
VWAP and fib retracement zones
Key killzones
Perfect for session-based intraday trading in both futures and forex.
⚡ No manual settings required.Just load it onto your chart for an instant institutional view of the market.
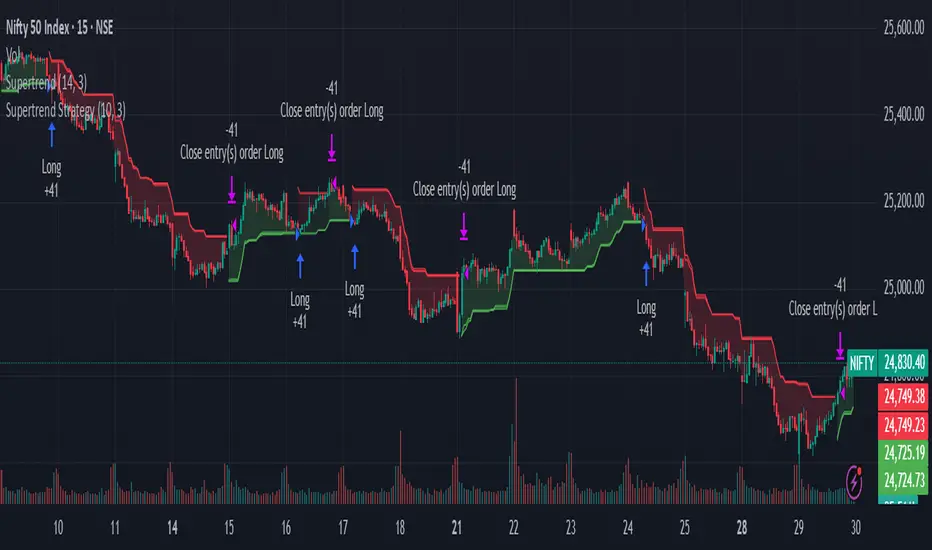
Supertrend Long-Only Strategy for QQQThis strategy is meant to use Micro Momentum to give good Buy and Sell signals in trending markets

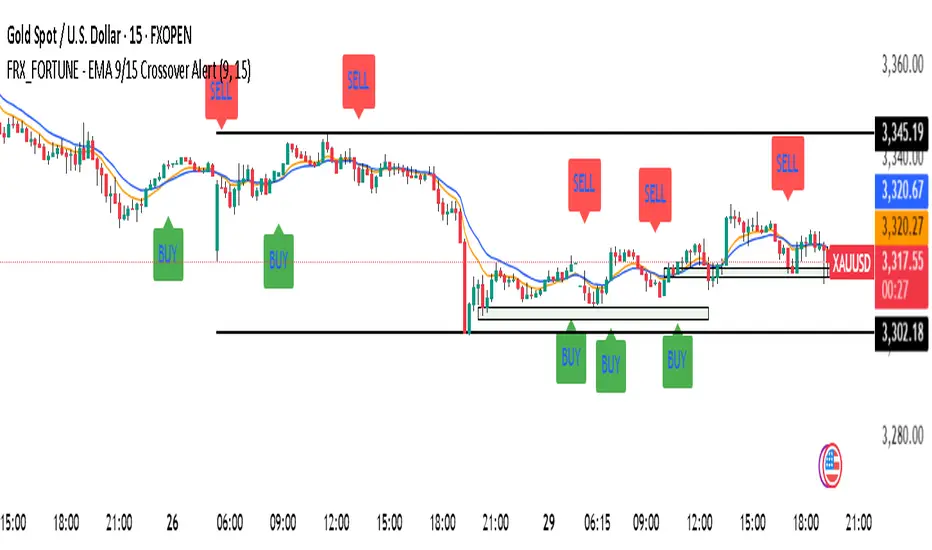
FRX_FORTUNE - EMA 9/15 Crossover Alert//@version=5
indicator("FRX_FORTUNE - EMA 9/15 Crossover Alert", overlay=true)
// === INPUTS ===
fastEmaLength = input.int(9, title="Fast EMA (9)")
slowEmaLength = input.int(15, title="Slow EMA (15)")
showArrows = input.bool(true, title="Show Buy/Sell Arrows")
enableAlerts = input.bool(true, title="Enable Alerts")
// === CALCULATIONS ===
fastEma = ta.ema(close, fastEmaLength)
slowEma = ta.ema(close, slowEmaLength)
bullishCross = ta.crossover(fastEma, slowEma)
bearishCross = ta.crossunder(fastEma, slowEma)
// === PLOT EMA ===
plot(fastEma, title="EMA 9", color=color.orange)
plot(slowEma, title="EMA 15", color=color.blue)
// === DRAW ARROWS ===
plotshape(bullishCross and showArrows, location=location.belowbar, color=color.green, style=shape.labelup, text="BUY", size=size.small)
plotshape(bearishCross and showArrows, location=location.abovebar, color=color.red, style=shape.labeldown, text="SELL", size=size.small)
// === ALERTS ===
alertcondition(bullishCross, title="Buy Alert", message="BUY: EMA 9 crossed above EMA 15")
alertcondition(bearishCross, title="Sell Alert", message="SELL: EMA 9 crossed below EMA 15")
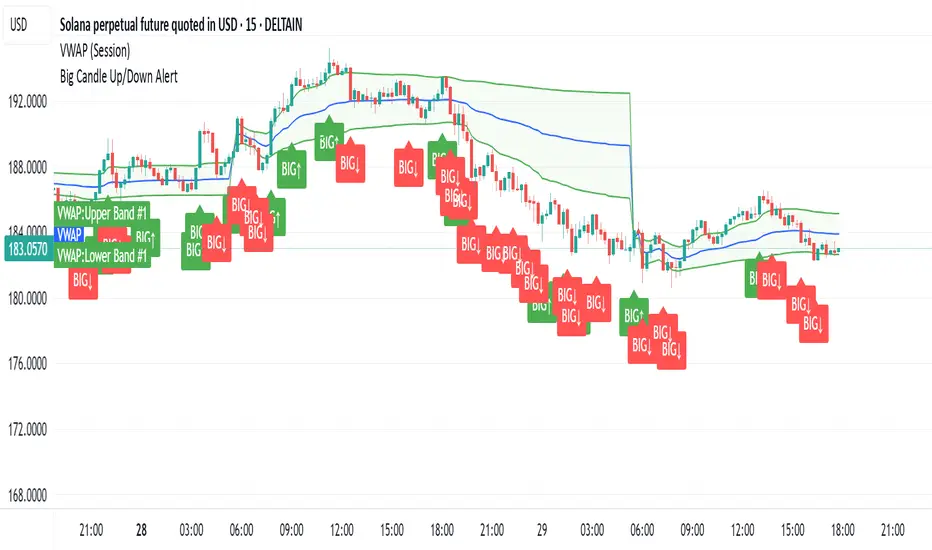
Big CandleBig Candles, most of the times, indicate actions by market makers . Also the candle high and low can be thought of as liquidity zones.
Weekly % Change Screener (5% Sell Threshold)This is a weekly screener for a 5% change in the stock value. If it increases by 5%, we sell and if it decreases by 5% we buy the stock. Good for stable high value stocks. Buy before testing.

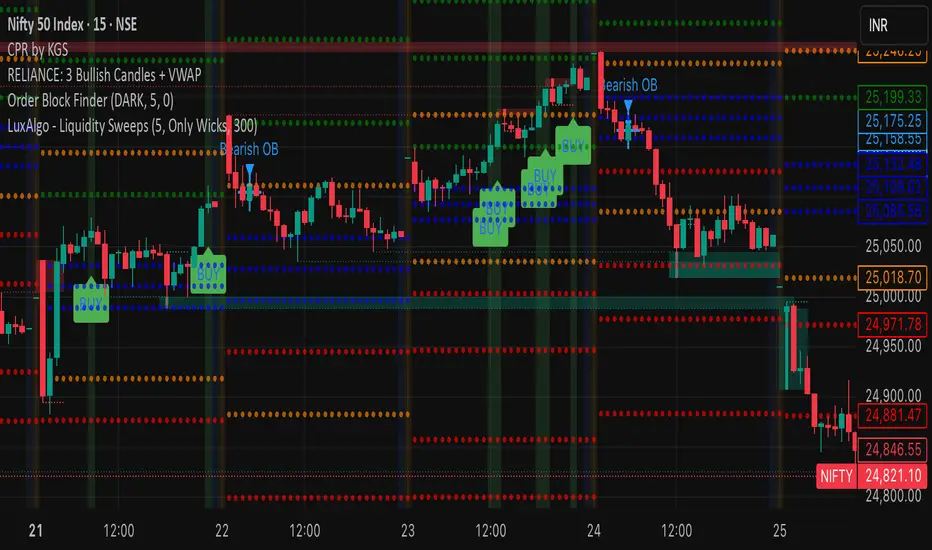
RELIANCE: 3 Bullish Candles + VWAPIts a script to track 3 consecutive candles of any stock. This helps understand the trends and makes up for buy signals. Please test before buying.
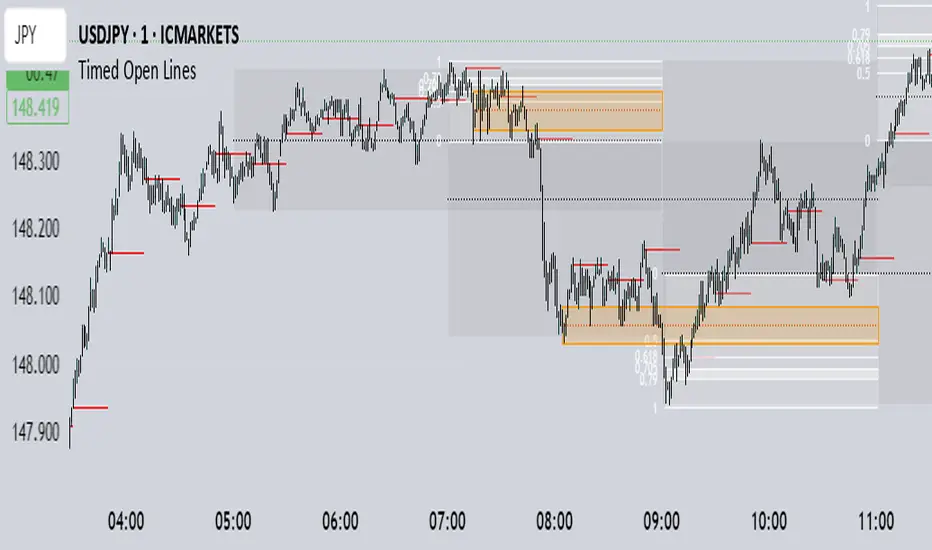
Bill Mensah - 10 / 30 / 50 Minute Open Lines Scientia maledictus sum.
Opening Macro lines extended, 10 / 30 / 50 Minute Open Lines