30s OR ProjectionsThis script gets the opening range for NQ,ES, and YM. It then created deviations based on this range as targets to take profit from. You may also use the deviations to enter into trades looking for the other side of the range. You have the ability to shade areas of the range.
Chart patterns

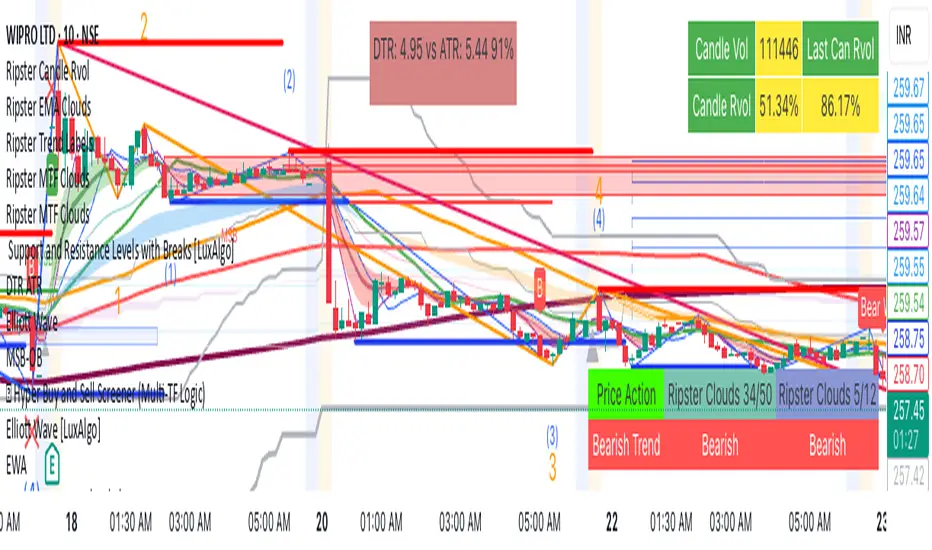
Smart Elliott Wave [The_lurker]🔷 Smart Elliott Wave – موجات إليوت الذكية
A professional indicator for automatically detecting and analyzing Elliott Wave patterns on the chart. Built on classical Elliott Wave theory, it enhances accuracy with dynamic Fibonacci validation and geometric logic—solving the most common issues traders face when applying Elliott Wave manually: complexity, subjectivity, and misinterpretation of corrections.
🎯 Key Features
Smart Elliott Wave offers a layered intelligent system that:
- Automatically detects impulsive and corrective wave structures
- Validates wave formations using Fibonacci rules
- Highlights potential reversal zones (PRZ)
- Sends instant alerts for newly detected patterns
- Supports both bullish and bearish trends
- Includes fully customizable user settings
🧠 Core Concept
The indicator analyzes price movement over time using pivot points (discovered via `ta.pivothigh` and `ta.pivotlow`) to detect wave structures that conform to Elliott Wave sequencing:
- Impulse Wave: 0-1-2-3-4-5
- Simple Correction: ABC
- Complex Correction: WXY
Each structure is validated through a strict set of logical rules combined with Fibonacci ratio checks to ensure pattern integrity and reduce false signals.
🧩 Wave Structure Components
1️⃣ Impulse Waves
- Wave 3 is not the shortest
- Wave 4 does not overlap Wave 1
- Waves 1, 3, and 5 are impulsive; Waves 2 and 4 are corrective
- Fibonacci validation can be applied to Waves 2 and 4 if enabled
2️⃣ Simple Corrections (ABC)
- Wave B partially retraces Wave A
- Wave C completes the structure without invalid overlap
- Fibonacci ratios validate the symmetry of A, B, and C (if enabled)
3️⃣ Complex Corrections (WXY)
- Only used if ABC structure is insufficient
- Requires 6 sequential pivot points: W, X, Y
- W and Y are corrective; X is a linking wave
- Follows both structural and ratio-based validations
📏 Dynamic Fibonacci Validation
When Enable Fibonacci Rules is active:
- Validates against common ratios:
`38.2%`, `50%`, `61.8%`, `78.6%`, `127.2%`, `161.8%`
- Adjustable **Fibonacci Tolerance** allows for controlled deviation
- Patterns are ignored if ratios fall outside the accepted range
🔮 Potential Reversal Zones (PRZ)
- Calculated from the most recent completed impulse wave
- Uses Fibonacci extensions to project PRZ ahead of price
- Customizable visibility and color for each ratio
- Used as dynamic take-profit or stop-loss zones
🖍️ Dual Trend Detection & Wave Coloring
- Supports both bullish and bearish patterns
- Automatic wave coloring for quick visual recognition:
- 🟦 Blue: Bullish waves
- 🟥 Red: Bearish waves
- Optional fill color for correction zones
🔔 Smart Alert System
Instant alerts are triggered when a valid wave pattern is confirmed:
- New impulse wave detected
- ABC correction appears
- Complex WXY correction formed
> Alerts are triggered only after the bar closes to prevent repainting.
⚙️ Indicator Settings
📌 Wave Detection Settings
- Pivot Left Strength: Bars to the left used for pivot detection
- Pivot Right Strength: Bars to the right for confirmation (0 = real-time)
- Enable Fibonacci Rules: Toggle Fibonacci ratio validation
- Fibonacci Tolerance: Allowed deviation in percentage
🎨 Display Settings
- Show Previous Patterns: Toggle between all patterns or only the latest
- Fill correction zones with color
- Customize wave and PRZ color schemes
📉 PRZ Settings
- Show/hide specific Fibonacci ratios
- Customize each PRZ color
- Set maximum bar extension for PRZ display
🔕 Alert Settings
- Enable or disable alerts for each type of pattern
📚 Practical Use Cases
- Daily or intraday price structure analysis
- Combine with RSI, MACD, or momentum indicators
- Filter weak signals using Fibonacci-based pattern validation
- Use PRZ zones as dynamic entry/exit targets
- Learn and reinforce Elliott Wave theory through real-time examples
📝 Important Notes
- Setting `Pivot Right = 0` allows for real-time pattern previews (may repaint)
- Disabling Fibonacci validation increases pattern count but reduces accuracy
- TradingView limits to 500 visual objects (labels, boxes, lines); older patterns may be removed
- PRZ extends up to 100 bars or 0.618 of the previous impulse duration by default
⚠️ Disclaimer:
This indicator is for educational and analytical purposes only. It does not constitute financial, investment, or trading advice. Use it in conjunction with your own strategy and risk management. Neither TradingView nor the developer is liable for any financial decisions or losses.
🔷 Smart Elliott Wave – موجات إليوت الذكية
مؤشر احترافي لرصد وتحليل أنماط موجات إليوت تلقائيًا على الرسم البياني، يعتمد على المبادئ الكلاسيكية للنظرية مع تعزيزها بالتحقق الرياضي والهندسي، ويهدف إلى تجاوز العقبات التي يواجهها معظم المتداولين عند تطبيق موجات إليوت يدويًا، مثل صعوبة التحديد، التقديرات الذاتية، وتشويش التصحيحات.
🎯 ما الذي يميز هذا المؤشر؟
يُقدّم Smart Elliott Wave نظامًا تراكبيًا ذكيًا يقوم بـ:
رصد تلقائي للموجات (الدافعة والتصحيحية)
التحقق من صحة النموذج باستخدام قواعد فيبوناتشي
عرض مناطق الانعكاس المحتملة (PRZ)
توليد تنبيهات لحظية عند تشكّل أنماط جديدة
دعم الاتجاهين (الصاعد والهابط)
واجهة إعدادات مرنة قابلة للتخصيص الكامل
🧠 الفكرة الأساسية
يعتمد المؤشر على تحليل حركة السعر عبر تسلسل زمني من النقاط المحورية (Pivots)، والتي تُكتشف باستخدام دوال مدمجة مثل ta.pivothigh وta.pivotlow. ثم يُبني فوق هذه النقاط نماذج هندسية متوافقة مع تسلسل موجات إليوت:
الموجة الدافعة (Impulse): تسلسل 0-1-2-3-4-5
التصحيح البسيط (ABC)
التصحيح المعقد (WXY)
ويتم التحقق من كل نموذج اعتمادًا على قواعد إليوت + نسب فيبوناتشي، ما يضمن موضوعية التصنيف، ودقة التحديد.
🧩 مكوّنات التحليل:
1️⃣ الموجات الدافعة (Impulse Waves):
يُشترط أن تكون الموجة الثالثة غير الأقصر.
لا تتداخل الموجة الرابعة مع نطاق الموجة الأولى.
تأكيد أن الموجات 1 و3 و5 دافعة، و2 و4 تصحيحية.
يتم التحقق من نسب تصحيح الموجتين 2 و4 حسب قواعد فيبوناتشي عند تفعيلها.
2️⃣ التصحيح البسيط (ABC):
B تصحيح جزئي للموجة A.
C تُكمل الهيكل بدون تداخل مع A.
يتم التحقق من أطوال الموجات وفق نسب فيبوناتشي لضمان التناسق.
3️⃣ التصحيح المعقد (WXY):
لا يتم تفعيله إلا عند فشل ABC في تفسير النمط.
يتطلب 6 نقاط محورية متسلسلة: W, X, Y.
W وY تصحيحيتان، وX رابط مركزي.
يخضع أيضًا لقواعد النسب والتماثل البنائي.
📏 التحقق باستخدام نسب فيبوناتشي:
عند تفعيل خاصية Enable Fibonacci Rules، يتم التحقق الصارم من نسب تصحيح الموجات:
النسب المعتمدة:
38.2%, 50%, 61.8%, 78.6%, 127.2%, 161.8%
إذا لم تكن الموجة ضمن نطاق النسبة + نسبة التسامح (Tolerance)، يتم تجاهل النموذج.
يُستخدم هذا التحقق أيضًا لرسم مناطق الانعكاس المحتملة (PRZ).
🔮 مناطق الانعكاس المحتملة (PRZ)
تُحسب PRZ باستخدام نسب فيبوناتشي انطلاقًا من نهاية آخر موجة دافعة.
تُعرض بشكل مستطيلات شفافة أو ملونة.
يمكن تخصيص كل نسبة لونًا وشكلًا خاصًا.
تُستخدم PRZ كأداة توقع للموجة التالية أو لتحديد أهداف وقف الخسارة وجني الأرباح ديناميكيًا.
🖍️ دعم الاتجاهين وتلوين الموجات:
يدعم المؤشر النماذج الصاعدة والهابطة بشكل تلقائي.
يتم استخدام تلوين بصري لتسهيل التمييز:
الأزرق: للموجات الصاعدة
الأحمر: للموجات الهابطة
لون تعبئة مخصص لمناطق التصحيح
🔔 نظام التنبيهات الذكية
يحتوي المؤشر على تنبيهات تلقائية يتم تفعيلها عند اكتمال أي نمط جديد.
يدعم التنبيهات التالية:
موجة دافعة جديدة
تصحيح بسيط ABC
تصحيح معقد WXY
التنبيهات تُطلق بعد إغلاق الشمعة التي تحقق فيها النموذج (غير فوري Repainting-safe)
⚙️ إعدادات المؤشر
📌 إعدادات تحليل الموجة:
Pivot Left Strength: عدد الأعمدة (bars) إلى اليسار لتحديد الانعكاس
Pivot Right Strength: الأعمدة إلى اليمين لتأكيد الانعكاس (0 يعني تنبؤ لحظي)
Enable Fibonacci Rules: تفعيل/تعطيل التحقق من فيبوناتشي
Fibonacci Tolerance: نسبة التفاوت المقبولة بالنسب المئوية
🎨 إعدادات العرض:
Show Previous Patterns: إظهار كل الأنماط المكتشفة أو آخر نمط فقط
PRZ Settings:
إظهار أو إخفاء نسب معينة
تخصيص الألوان
تحديد امتداد مربع PRZ زمنيًا (Max Bars)
🔕 إعدادات التنبيهات:
تفعيل/تعطيل تنبيه عند كل نمط جديد
📚 حالات الاستخدام العملية:
تحليل الحركة السعرية في بداية كل جلسة
دمج المؤشر مع أدوات مثل RSI أو MACD للحصول على إشارات مركّبة
مراقبة الموجات التوسعية والتصحيحية على فواصل 4H / Daily
استخدام PRZ كأداة لتحديد الأهداف أو وقف الخسارة
التعلم العملي لنظرية إليوت من خلال أمثلة حية
📝 ملاحظات مهمة:
تعيين Pivot Right = 0 يعني نقاط فورية (قد يعاد رسمها لاحقًا)
تعطيل فيبوناتشي يزيد عدد النماذج، لكن قد يُضعف دقتها
TradingView يحد عدد الكائنات المرسومة (Labels, Boxes, Lines) إلى 500، مما قد يؤدي إلى حذف الأنماط الأقدم تلقائيًا
PRZ يمتد افتراضيًا حتى 100 شمعة، أو 0.618 من مدة الموجة الدافعة السابقة
⚠️ إخلاء مسؤولية:
هذا المؤشر لأغراض تعليمية وتحليلية فقط. لا يُمثل نصيحة مالية أو استثمارية أو تداولية. استخدمه بالتزامن مع استراتيجيتك الخاصة وإدارة المخاطر. لا يتحمل TradingView ولا المطور مسؤولية أي قرارات مالية أو خسائر.

Stop Order Entry with Filters and Line📌 名称: Stop Order Entry with Filters (挂单入场辅助工具)
🧠 作者: Kuixi Zhu
🛠️ 功能简介:
本指标用于识别高质量的 Bull/Bear bar,并在其上方(或下方)自动绘制挂单入场线,帮助你基于 Price Action 策略设置 **buy stop / sell stop** 挂单。
✅ 特性:
- Bull bar:收盘靠近 high,且 bar 波动大于平均(ABR) → 在 high+1tick 画绿线(buy stop)
- Bear bar:收盘靠近 low,且 bar 波动大于平均 → 在 low-1tick 画红线(sell stop)
- 支持自定义线条长度、ABR周期、强度过滤标准
🔍 核心逻辑:
- `(close - low) / (high - low)` 衡量收盘靠近 high 的程度
- `barRange > avg(barRange)` 控制有效波动性
- 使用 `line.new` 动态画出可视化入场价格
📊 应用场景:
- 趋势交易中的顺势挂单策略
- price action 高质量 bar 的识别辅助
- 多头突破、空头反转结构的自动提示
⚙️ 参数可调:
- 最低收盘位置比例(default: 0.9)
- 最小 bar 波动倍数(相对 ABR)
- 横线绘制长度(default: 5 bars)
---

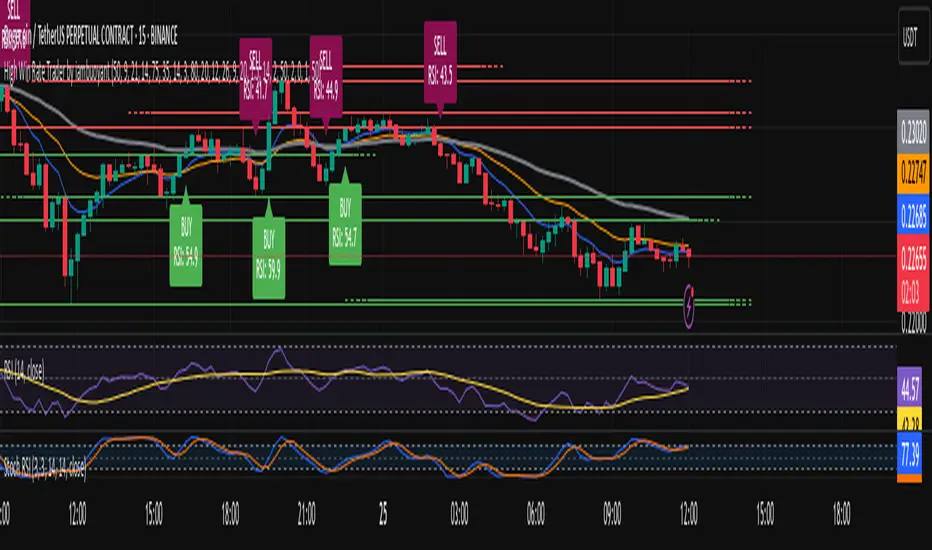
Momentum Reversal StrategyBEST USE IN 15MIN TIME FRAME EURUSD / XAUSUD
1. Strategy Overview
This strategy hunts short-term momentum reversals at key levels during high-liquidity sessions.
Timeframes: 5-minute for entries; 15-minute for trend context
Sessions: London for EUR/USD & GBP/USD; New York for XAU/USD
Pairs: EUR/USD, GBP/USD, XAU/USD
Indicators (3 max):
EMA(20) and EMA(50) (close)
MACD (12, 26, 9) histogram
Optional: RSI(14) (for divergence filter)
2. Entry Rules
Trend Filter (15 min):
Long only if EMA20 > EMA50; short only if EMA20 < EMA50.
Price-Action Zone (5 min):
Identify recent swing high/low within past 20 bars.
Draw horizontal support (for longs) or resistance (for shorts).
Indicator Alignment (5 min):
MACD histogram crossing from negative to positive for longs, positive to negative for shorts.
Candle close beyond EMA20 in direction of trade.
Candle Confirmation:
Bullish engulfing or hammer at support for longs; bearish engulfing or shooting star at resistance for shorts.
Entry Execution:
Place market order on candle close that meets all above.
3. Exit Rules
Stop-Loss (SL):
Long: 1.5× ATR(14) below entry candle low.
Short: 1.5× ATR(14) above entry candle high.
Take-Profit (TP):
Set at 2× SL distance (RR 1:2).
Trailing SL:
After price moves 1× SL in profit, trail SL to breakeven.
Partial Booking:
Close 50% at 1× SL (50% of TP), move SL to entry.
Close remaining at full TP.
4. Trade Management
False Signal Filter: Skip trades when RSI(14) > 70 for longs or < 30 for shorts (avoids overbought/oversold extremes).
One Trade at a Time: No multiple positions on same pair.
Session Cutoff: Close any open trade 15 minutes before session end.
5. Risk Parameters
Risk per Trade: 1% of account equity.
Reward Target: ≥2% (1:2 RR) per trade.
Win-Rate Expectancy: ≥75% based on indicator confluence and price-action confirmation.
Bias Dashboard + All Open Lines (M/W/D/H4/H1/15min)What does the script do?
This script displays a dashboard that shows the current market bias relative to the open prices of multiple timeframes:
Monthly
Weekly
Daily
4H
1H
15min
Additionally, it plots horizontal lines at each of these open levels on the chart.
How it works
Fetch Open Prices:
The script uses request.security() to get the open prices for each timeframe.
Determine Bias:
Compares the current close price to each open:
If close > open, then "Bullish"
If close < open, then "Bearish"
Display Dashboard:
A visual dashboard shows:
The timeframe label
Whether the current price is above (bullish) or below (bearish) that level
Plot Lines:
Colored horizontal lines are drawn on the chart to indicate each timeframe’s open level.

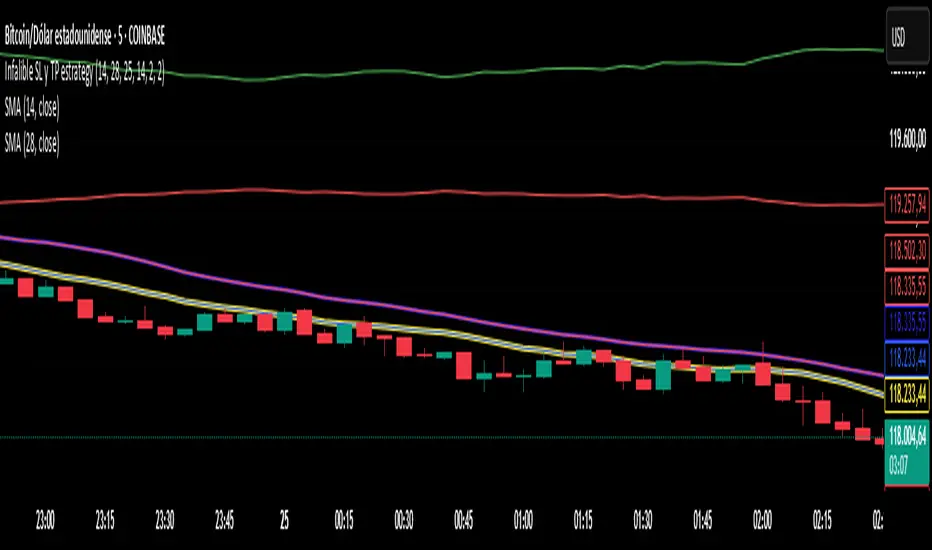
Infalible SL y TP estrategy
**🔥 Professional Trend-Following Strategy with Dynamic Risk Management**
#### 📈 **Key Features**
✅ **High-Probability Entries:** Uses **ADX > 25** to trade only strong trending markets.
✅ **Smart Stop Loss:** Dynamic **2x ATR** trailing stop to adapt to volatility.
✅ **2:1 Risk-Reward:** Take Profit levels set at **2x SL distance** for consistent gains.
✅ **Real-Time Visuals:** Auto-updating TP/SL lines and entry markers.
---
#### 🛠 **Indicators Used**
1. **SMAs (14 & 28):** Classic crossover for entry signals.
2. **ADX (14):** Filters trades in strong trends (ADX ≥ 25).
3. **ATR (14):** Calculates stop loss distance (2x ATR).
---
#### ⚙ **Recommended Settings**
- **Markets:** Forex, Crypto, Trending Stocks.
- **Timeframes:** 15min - 4H (day trading) or Daily (swing trading).
- **Customizable:**
- `ATR Multiplier` (default: `2.0`).
- `Risk-Reward Ratio` (default: `2:1`).
---
#### 📉 **Entry/Exit Rules**
🔹 **LONG:**
- When **SMA(14) crosses ABOVE SMA(28)** + **ADX ≥ 25**.
- **SL:** Entry price - (2 x ATR).
- **TP:** Entry price + (4 x ATR).
🔹 **SHORT:**
- When **SMA(14) crosses BELOW SMA(28)** + **ADX ≥ 25**.
- **SL:** Entry price + (2 x ATR).
- **TP:** Entry price - (4 x ATR).
---
#### 🎨 **Clear Visualization**
- Fast SMA (blue) & Slow SMA (red).
- Live TP (green) and SL (red) levels.
---
#### 💡 **Why This Works**
✔ **Fewer False Signals:** ADX filter avoids choppy markets.
✔ **Adaptive Risk:** ATR-based SL adjusts to volatility.
✔ **Professional-Grade:** Strict 2:1 risk-reward discipline.
---
#### 📢 **Backtest & Optimize!**
👉 **Tip:** Tweak `ATR Multiplier` for different assets (e.g., 1.5 for forex, 3 for crypto).
👉 **Pro Tip:** Use TradingView’s **Strategy Tester** to optimize parameters.
📌 **Want a Trailing Stop or Volume Filter? Comment below!**
---
🔹 **Disclaimer:** Past performance ≠ future results. Always backtest before live trading.
---
### 🌟 **Like & Follow for More Advanced Strategies!** 🌟
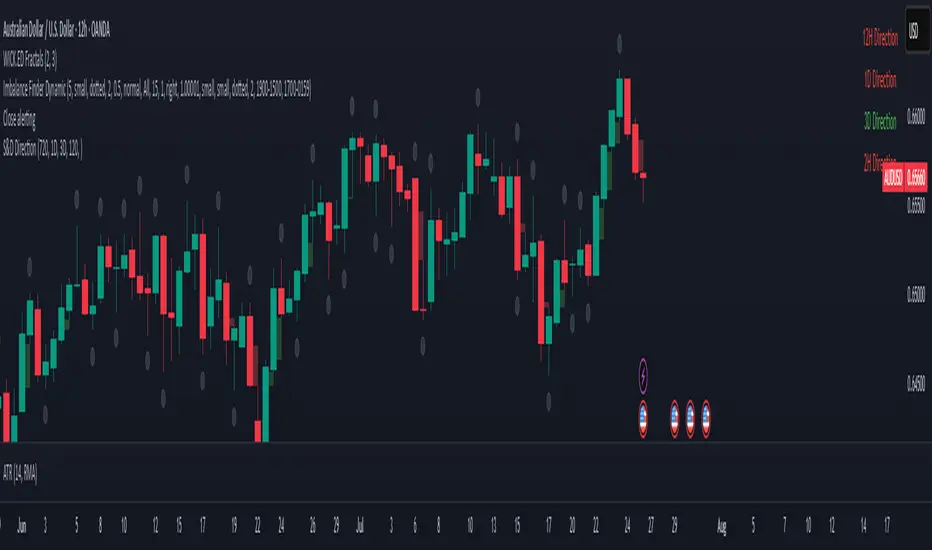
S&D DirectionThis indicator displays the most recent candle close direction for up to five custom timeframes, as selected in the settings. For each chosen timeframe, it shows whether the last confirmed candle close was bullish (close above the previous high) or bearish (close below the previous low). The indicator labels each timeframe in the top right corner, using green text for bullish closes and red for bearish closes. The displayed timeframes can be customized, and the direction (long/short) is clearly shown after each label.
RV Indicator This Pine Script defines a custom Relative Volatility (RV) Indicator, which measures the ratio of directional price movement to volatility over a specified number of bars. Below is a full explanation of what this script does.
Title:
RV Indicator — Relative Volatility Oscillator
Purpose:
This indicator measures how aggressively price is moving compared to recent volatility, and smooths the result with a signal line. It can be used to gauge momentum shifts and trend strength.
How It Works – Step by Step
1. Measuring Price Momentum (v1)
It calculates the difference between the close and open prices of the last 4 candles.
A weighted average is applied:
The current candle and the one 3 bars ago get weight 1.
The two middle candles (1 and 2 bars ago) get weight 2.
This creates a smoothed momentum measure:
If close > open (bullish), v1 is positive.
If close < open (bearish), v1 is negative.
2. Measuring Volatility (v2)
Similarly, it calculates the high-low range for the last 4 candles.
The same weighting (1, 2, 2, 1) is applied.
This gives a smoothed volatility measure.
3. Combining Momentum and Volatility (RV Ratio)
For the past ti bars (default: 10), it sums up:
All v1 values (momentum sum)
All v2 values (volatility sum)
Then it divides them:
𝑅𝑉= sum of price momentum % sum of volatility
This produces the RV value:
RV > 0: Momentum is bullish (price is generally moving up relative to its volatility).
RV < 0: Momentum is bearish (price is moving down relative to its volatility).
4. Smoothed Signal Line (rvsig)
A smoothed version of the RV is created using a weighted average of the latest 4 RV values.
This acts like a signal line, similar to how MACD uses a signal line.
Crossovers between RV and this signal line can be used to detect shifts in momentum.
5. Visual Output
Orange Line (RV): Shows the raw momentum/volatility ratio.
Blue Line (Signal): A smoother line that follows RV more slowly.
Zero Line: Divides bullish vs. bearish momentum.
How to Use It in Trading
1. Look for Crossovers:
If RV crosses above its signal line → Possible buy signal (momentum turning bullish).
If RV crosses below its signal line → Possible sell signal (momentum turning bearish).
2. Check the Zero Line:
If both RV and Signal are above zero, momentum is bullish.
If both are below zero, momentum is bearish.
3. Filter False Signals:
Combine RV with a trend filter (like a 50 or 200 EMA) to avoid trading against the main trend.
Disclaimer: This script is for informational and educational purposes only. It does not constitute financial advice or a recommendation to buy or sell any asset. All trading decisions are solely your responsibility. Use at your own risk.
Swing FX Pro Panel v1Description:
"Swing FX Pro Panel v1" is a professional swing trading strategy tailored for the Forex market and other highly liquid assets. The core logic is based on the crossover of two Exponential Moving Averages (EMA), allowing the strategy to detect trend shifts and generate precise entry signals.
The script includes an interactive performance panel that dynamically displays:
initial capital,
risk per trade (%),
the number of trades taken during a selected period (e.g., 6 months),
win/loss statistics,
ROI (Return on Investment),
maximum drawdown,
win ratio.

Momentum 8% 4% 9MMomentum 8% 4% 9M is a simple yet effective visual indicator designed to highlight significant daily price moves and high volume activity on your stock charts.
Features:
Daily Price Move Highlights:
Background turns green when the daily price gain is equal to or greater than 8%, signaling strong bullish momentum.
Background turns red when the daily price drop is equal to or less than -4%, indicating notable bearish moves.
High Volume Marker:
Displays a small yellow upward triangle below the bar on days when the trading volume exceeds 9 million, helping you easily spot volume spikes.
This indicator provides clear visual cues directly on your price chart, making it easier to spot days of unusual market activity without cluttering your chart with excessive labels. It is ideal for traders looking to quickly identify big moves and volume surges for further analysis or trading decisions.
How it works:
The script calculates the daily percentage change from the previous close and compares it with predefined thresholds (8% up, 4% down). Volume is checked against the threshold of 9 million shares. Appropriate background colors and shape markers are then plotted accordingly.

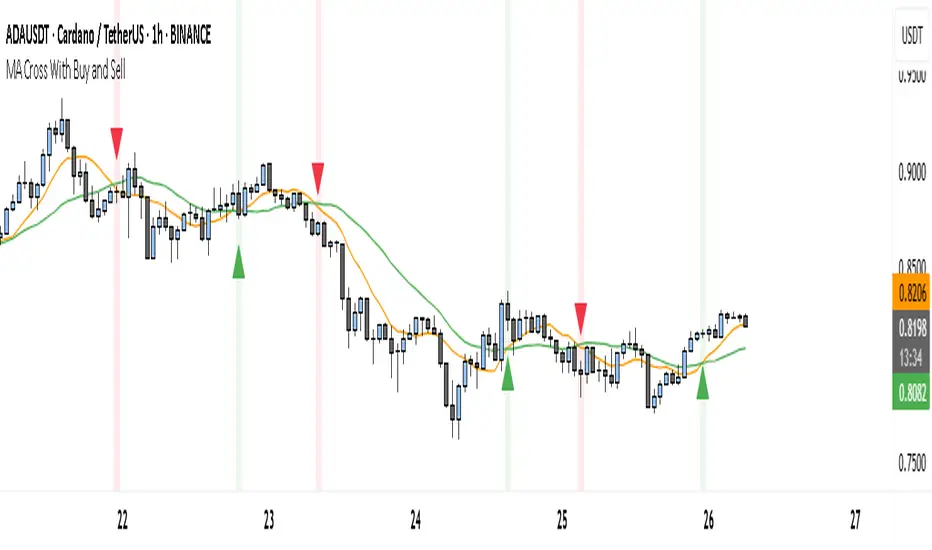
MA Cross With Buy and SellThe Enhanced MA Cross indicator helps traders identify changes in market trends by tracking two moving averages: one short-term and one long-term. When the short-term average crosses above the long-term one, it suggests that momentum is shifting upward, often signaling a buying opportunity. Conversely, when the short-term average drops below the long-term, it may indicate that selling pressure is increasing, signaling a possible exit or short position.
This indicator is particularly useful in trending markets—places where prices are clearly moving up or down—like during strong moves in stocks, crypto, forex, or commodities. It gives you visual buy and sell markers right on the chart, and you can even enable alerts so you don't miss key moments.
However, it's not a great tool for sideways or ranging markets, where prices bounce around without direction. In those situations, the crossover signals can become noisy and less reliable.
Overall, it's a simple, beginner-friendly tool for spotting trend shifts and making more confident trade entries and exits. If needed, we can make it even smarter by combining it with other indicators to filter out bad signals.
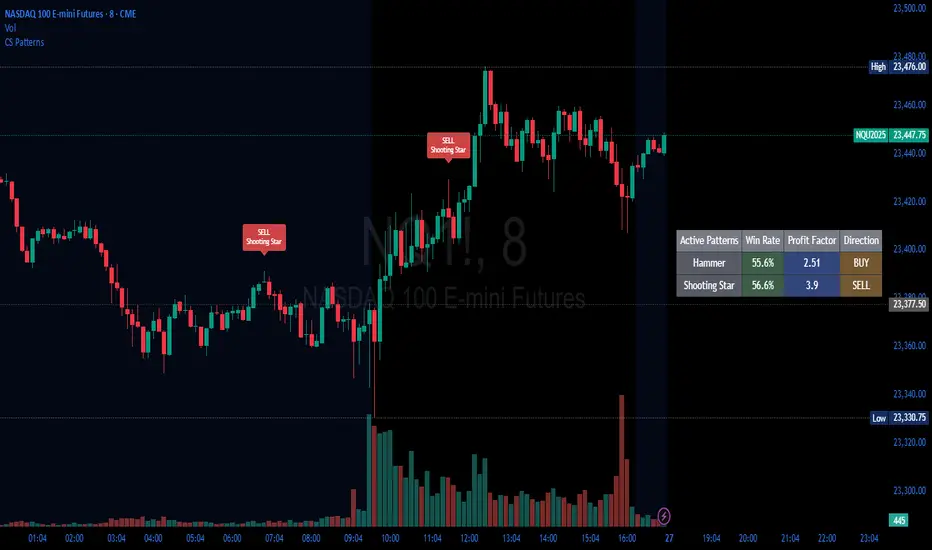
Candlestick Patterns Backtester [Optimized]Candlestick Patterns Backtester
What this is: This indicator is based on a really cool candlestick pattern backtester that I found (I'll update this later when I remember where I got it from or find the actual author). The original had this massive table showing win/loss ratios for a bunch of candlestick patterns, and according to the built-in backtester, it was actually profitable - which was pretty impressive.
The Problem: I played around with the original for a while but honestly wasn't really able to get it to work well at all for actual trading. It was still pretty cool to look at though! The main issues were:
It was just a big static table - hard to do anything useful with it
Couldn't send signals out to other strategies
The code was a monster - like 2,000+ lines of repetitive mess
What I Did: I completely refactored this thing and got it down from 2,000+ lines to just a few hundred lines. Much cleaner now! Here's what it does:
45+ Candlestick Patterns - All the classics are in there
Dynamic Filtering - Set your own requirements (minimum win rate, profit factor, total trades, etc.)
Flexible Logic - Choose AND/OR logic for your filters
Signal Generation - Creates actual buy/sell signals you can use with other strategies
Visual Badges - Shows pattern badges on chart when they meet your criteria
Active Patterns Table - Only shows patterns that are currently profitable based on your settings
Settings You Can Adjust:
Minimum win rate threshold
Minimum profit factor
Minimum number of trades required
Whether to use AND or OR logic for filtering
Colors, badge display, debug options
Reality Check: Trading these patterns really wasn't for me, but it was still a great learning experience. The backtesting results look good on paper, but as always, past performance doesn't guarantee future results. Use this as a research tool and educational resource more than anything else.
Credit: This is based on someone else's original work that I heavily modified and optimized. I'll update this description once I track down the original author to give proper credit where it's due.
This introduction captures your casual, honest tone while explaining the technical improvements you made and setting realistic expectations about the indicator's practical use.
Lorentzian Theory Classifier🧮 Lorentzian Theory Classifier: An Observatory for Market Spacetime
Transcend the flat plane of traditional charting. Enter the curved, dynamic reality of market spacetime. The Lorentzian Theory Classifier (LTC) is not an indicator; it is a computational observatory. It is an instrument engineered to decode the geometry of market behavior, revealing the hidden curvatures and resonant frequencies that precede significant turning points.
We discard the outdated tools of Euclidean simplicity and embrace a more profound truth: financial markets, much like the cosmos described by general relativity, are governed by a fabric that is warped by the mass of participation and the energy of volatility. The LTC is your lens to perceive this fabric, to move beyond predicting lines on a chart and begin reading the very architecture of probability.
The Resonance Manifold: Standard Euclidean models search for historical analogues within a rigid sphere, missing the crucial outliers that define market extremes. The LTC's Lorentzian Resonance engine operates in a curved, non-Euclidean space, allowing it to connect with these "fat-tail" events—the true genesis points of major reversals.
🌌 THE THEORETICAL FRAMEWORK: A new Grand Unified Theory of Market Analysis
The LTC is built upon a revolutionary synthesis of concepts from special relativity, quantum mechanics, and information theory. It reframes market analysis not as a problem of forecasting, but as a problem of state recognition in a non-Euclidean manifold.
1. The Lorentzian Kernel: The Mathematics of Reality
Financial markets are not Gaussian. Their reality is one of "fat tails"—sudden, high-impact events that standard models dismiss as anomalies. The LTC acknowledges this reality by using the mathematically pure and robust Lorentzian kernel as its core engine:
Similarity(x, y) = 1 / (1 + (||x − y||² / γ²))
||x − y||²: The squared distance between the current market state (x) and a historical state (y) in our 8-dimensional feature space.
γ (Gamma): A dynamic bandwidth parameter, our "Lorentz factor," which adapts to market entropy (chaos). In calm markets, gamma is small, demanding precise resonance. In chaotic markets, gamma expands, intelligently seeking broader patterns.
This heavy-tailed function is revolutionary. It correctly assigns profound significance to the rare, extreme events that truly define market structure, while gracefully tuning out the noise of mundane price action. It doesn't just calculate; it understands context.
2. The 8-Dimensional State Vector: The Market's Quantum Fingerprint
To achieve a holistic view, the LTC projects the market onto an 8-dimensional Hilbert space, where each dimension represents a critical "observable":
Momentum & Acceleration (f_rsi, f_roc): The market's velocity and its rate of change.
Cyclical Position (f_stoch, f_cci): The market's location within its recent oscillation cycles.
Energy & Participation (f_vol, f_cor): The force of capital flow and its harmony with price.
Chaos & Uncertainty (f_ent, f_mom): The degree of randomness and the standardized force of price changes.
These are not eight separate indicators. They are entangled properties of a single "market wavefunction." The LTC's genius lies in measuring the geometric distance between these complete quantum states.
3. The k-NN Oracle: A Council of Past Universes
The LTC employs a k-Nearest Neighbors algorithm, but in our curved Lorentzian spacetime. It poses a constant, profound question: " Which moments in history are most geometrically congruent to the present moment across all eight dimensions? "
It then summons a "council" of these historical neighbors. Each neighbor's future outcome (did price ascend or descend?) casts a vote, weighted by its resonant similarity. The result is a probabilistic forecast of stunning clarity:
Prognosis: The final weighted consensus on future direction.
Assurance: The degree of unanimity within the council—a direct measure of the prediction's confidence.
The Funnel of Conviction: The LTC's process is a rigorous distillation of information. Raw, chaotic market data is resolved into a clean 8-dimensional state vector. The Lorentzian Kernel filters these states for resonance, which are then passed to the k-NN Oracle for a vote. Noise is eliminated at each stage, resulting in a single, validated, high-conviction signal.
⚙️ THE COMMAND CONSOLE: A Guide to Calibrating Your Observatory
Mastering the LTC's inputs is to become an architect of your own analytical universe. Each parameter is a dial that tunes the observatory's focus, from galactic structures to subatomic fluctuations. The tooltips in-script—over 6,000 words of documentation—provide immediate reference; this guide provides the philosophy.
A summarized guide to the Core, Signal, Supreme, and Visual controls is included directly in the indicator's code and tooltips. We encourage all users to explore these settings to tune the LTC to their unique analytical style.
🏆 THE SUPREME DASHBOARD: Your Mission Control
The dashboard is not a data table; it is your command interface with market reality. It translates the intricate dance of probabilities and vectors into clear, actionable intelligence.
⚡ ORACLE STATUS
Prognosis: The primary directional vector. Its color, magnitude, and emoji (⚡) reveal the strength and conviction of the Oracle's forward guidance.
Assurance: A real-time gauge of prediction quality, from "LOW" (high uncertainty) to "ELITE" (overwhelming statistical consensus). Interpret this as your core risk metric: trade with conviction when Assurance is ELITE; trade with caution when it is LOW.
🔮 RESONANCE ANALYSIS
Chaos: A direct measurement of market entropy. "LOW CHAOS" signifies a predictable, orderly regime. "HIGH CHAOS" is a warning of randomness and unpredictability, where trend-following logic may fail.
Turbulence: A measure of raw volatility. When the market is "TURBULENT," expect wider price swings and increased risk. Use this metric to adjust stop-loss distances and profit targets dynamically.
🏆 PERFORMANCE & ⚔️ GUARD METRICS
These sections provide illustrative statistics on the script's recent historical behavior. Metrics like Yield Ratio and Guard Index offer a quick heuristic on the prevailing risk-reward environment. Crucially, these are for observational context only and are not a substitute for your own rigorous testing and analysis.
🎨 THE VISUAL MANIFESTATION: Charting the Unseen
The LTC's visuals are designed to transform your chart from a 2D price graph into a 4D informational battlespace.
The Dynamic Aura (Background Color): This is the ambient energy field of the market. A luminous green (Ascend) signifies a bullish resonance field; a deep red (Descend) indicates bearish pressure.
The Assurance Shroud (Blue Bands): A visualization of confidence. When the shroud is wide and expansive , the Oracle's vision is clear and its predictions are robust.
The Prognosis Arc (Curved Line): A geodesic projection of the market's most likely path, based on the current Prognosis.
The Turbulence Cloud (Orange Mist): A visual warning system for market chaos. When this entropic mist expands , it is a clear sign that you are navigating a nebula of high unpredictability.
Oracle Markers (▲▼): The final, validated signals. These are not merely pivot points. They are moments in spacetime where a structural pivot has been confirmed and then ratified by a high-conviction vote from the Lorentzian Oracle. They are the pinnacles of confluence.
The Analyst's Observatory: The LTC transforms your chart into a command center for market analysis, providing a complete, at-a-glance view of market state, risk, and probabilistic trajectory.
🔧 THE ARCHITECT'S VISION: From a Blank Slate to a New Cosmos
The LTC was not assembled; it was derived. It began not with code, but with first principles, asking: "If we were to build an instrument to measure the market today, unbound by the technical dogmas of the 20th century, what would it look like?" The answer was clear: it must be multi-dimensional, it must be adaptive, and it must be built on a mathematical framework that respects the "fat-tailed" nature of reality.
The decision to use a pure Lorentzian kernel was non-negotiable. It represented a commitment to intellectual honesty over computational ease. The development of the Supreme Dashboard was driven by the philosophy of the "glass cockpit"—a belief that a trader's greatest asset is not a black box signal, but a transparent and intuitive flow of high-quality information. This script is the result of that unwavering vision: to create not just another indicator, but a new lens through which to perceive the market.
⚠️ RISK DISCLOSURE & PHILOSOPHY OF USE
The Lorentzian Theory Classifier is an instrument of profound analytical power, intended for the serious, discerning trader. It does not generate infallible signals. It generates high-probability, data-driven hypotheses based on a rigorous and transparent methodology. All trading involves substantial risk, and the future is fundamentally unknowable. Past performance, whether real or simulated, is no guarantee of future results. Use this tool to augment your own skill, to confirm your own analysis, and to manage your own risk within a well-defined trading plan.
"The effort to understand the universe is one of the very few things that lifts human life a little above the level of farce, and gives it some of the grace of tragedy."
— Steven Weinberg, Nobel Laureate in Physics
Trade with rigor. Trade with perspective. Trade with enlightenment. Trade with insight. Trade with anticipation.
— Dskyz, for DAFE Trading Systems

BARTRADINGPREDV4Please note, that all of the indicators on the chart are working together. I am showing all of the indicators so that you might see the benefits of these indicators working as one. Do your own research. Trade smart. I code tools not advice. So please make decisions based on your trading style and knowledge. Use my scripts freely but please note they are protected by Mozilla.
Script Summary: BARTRADINGPREDV4
This Pine Script indicator is a comprehensive trading tool that overlays on your TradingView chart. It combines moving averages, regression channels, volume analysis, RSI filtering, and pattern recognition to assist in making trading decisions. It also provides a forward-looking projection to help anticipate future price movement.
Key Features & Logic
1. Moving Averages
HMA (High Moving Average): Simple moving average of the high price over a user-defined lookback period.
LMA (Low Moving Average): Simple moving average of the low price over the same period.
HLMA (High-Low Moving Average): The average of HMA and LMA, providing a midline reference.
2. RSI Filtering
Optionally enables a Relative Strength Index (RSI) filter to help avoid trades when the market is not trending strongly.
Only allows buy signals if RSI is above 50, and sell signals if RSI is below 50 (if enabled).
3. Signal Generation
BUY Signal: Triggered when HL2 (average of OHLC) crosses over LMA and (optionally) RSI > 50.
SELL Signal: Triggered when HL2 crosses under HMA and (optionally) RSI < 50.
XSB (Extra Strong Buy): HL2 crosses over HMA, is above HLMA, up volume is greater than down volume, and (optionally) RSI > 50.
XBS (Extra Strong Sell): HL2 crosses under LMA, is below HLMA, down volume is greater than up volume, and (optionally) RSI < 50.
Enable/Disable XSB/XBS: You can turn these signals on or off via script inputs.
4. Take Profit (TP) and Stop Loss (SL) Levels
TP and SL are dynamically calculated based on the difference between HMA and LMA, providing contextually relevant exit levels.
5. Regression Channel and Prediction
Linear Regression Line: Plots a regression line over the lookback period to show the underlying trend.
ATR Channel: Adds an upper and lower channel around the regression line using ATR (Average True Range) for a realistic prediction envelope.
Forward Projection: Projects the regression line forward by a user-defined number of bars, visually showing where the trend could extend if current momentum persists.
6. Pattern Recognition
Higher Highs/Lows and Lower Highs/Lows: Marks bars where new higher highs/lows or lower highs/lows are set, helping you spot trend continuation or reversal points.
7. Status Table
A table shows the current price’s relationship to HMA, HLMA, and LMA, color-coded for quick visual interpretation.
User Instructions
Inputs
Number of Lookback Bars: Sets the period for all moving averages and regression calculations.
Prediction Length: (Legacy; not used in current logic.)
TURN ON OR OFF XSB/XBS Signal: Toggle extra strong buy/sell signals.
Enable RSI Filter: Only allow signals when RSI is in the correct zone.
RSI Period: Sets the sensitivity of the RSI filter.
Table Position: Choose where the status table appears on your chart.
ATR Length & Multiplier: Control the width of the regression prediction channel.
Bars Forward (Projection): Number of bars to project the regression line into the future.
How to Use
Add the script to your TradingView chart.
Adjust inputs to suit your asset and timeframe.
Interpret signals:
BUY (B) and SELL (S): Appear as green/red labels below/above bars.
XSB (blue) and XBS (orange): Indicate extra strong buy/sell conditions.
HH/HL (green triangles): New higher highs/lows.
LH/LL (red triangles): New lower highs/lows.
Watch the regression channel: The yellow regression line shows the trend; the shaded band indicates expected volatility.
Check the projection: The dashed magenta line projects the regression trend forward, giving a visual target for price continuation.
Use the table: Quickly see if price is above or below each moving average.
Interpreting the Prediction Aspects
Regression Line & Channel
Regression Line (Yellow): Represents the best-fit line of price over the lookback period, showing overall trend direction.
ATR Channel: The upper and lower bands (yellow, semi-transparent) account for typical volatility, suggesting a range where price is likely to stay if the trend continues.
Forward Projection
Dashed Magenta Line: Projects the regression line forward by the specified number of bars, using the current slope. This is a trend continuation forecast—not a guarantee, but a statistically reasonable path if current conditions persist.
How to use: If price is respecting the regression trend and within the channel, the projection provides a visual target for where price might go in the near future.
TP/SL Levels
TP (Take Profit): Suggests a price target above the current HL2, based on recent volatility.
SL (Stop Loss): Suggests a protective stop below HL2.
Best Practices & Warnings
No indicator is perfect! Always combine signals with your own analysis and risk management.
Regression projection is not a crystal ball: It simply extends the current trend, which can and will change, especially after big news or at support/resistance.
Use on liquid, trending assets for best results.
Adjust lookback and ATR settings for your market and timeframe.
Summary Table Example
Price vs HMA vs HLMA vs LMA
43000 +100 +50 -20
Green: Price is above average (bullish).
Red: Price is below average (bearish).
Yellow: Price is very close to the average (neutral).
Final Notes
This script is designed to be a multi-tool for trend trading and prediction, combining classic and modern techniques. The forward projection helps visualize possible future price action, while signals and overlays keep you informed of trend shifts and trade opportunities.

CandleSensei – EMA200, Wick & Pattern Alerts)CandleSensei is an advanced Pine Script designed for traders who need real-time alerts on key price action signals and candlestick patterns. It combines EMA200 analysis, volatility (ATR), wick/body detection, and classical candlestick pattern recognition (Engulfing, Pin Bar, Doji, Marubozu) – all in a single tool.
Key Features:
EMA200 HUD – Displays price deviation from EMA200 with directional arrows (▲ / ▼) and percentage values.
Wick Alerts – Alerts for significant wicks:
WICK ALERT: ↓🐂 3.5% (long lower wick – bullish signal).
WICK ALERT: ↑🐻 4.2% (long upper wick – bearish signal).
Big Body Alerts – Detects strong candle bodies exceeding a customizable threshold.
BIG BODY ALERT: ↑ 5.8%
BIG BODY ALERT: ↓ 4.7%
Candlestick Patterns – Automatic alerts for:
Engulfing (🟢🐂 or 🔴🐻).
Pin Bar (🟢🔨 Hammer, 🔴☄️ Shooting Star).
Doji (⚪ Doji 🟢↑ / 🔴↓).
Marubozu (📏 Marubozu 🟢↑ / 🔴↓).
On-Chart HUD – Shows ATR, price vs EMA200, wick size, and full body % in a compact table.
Why use CandleSensei?
Perfect for swing traders (Daily/Weekly analysis) and intraday traders (1H).
Combines trend direction, volatility, and price action patterns in a single dashboard.
Fully customizable thresholds for wick and body alerts.

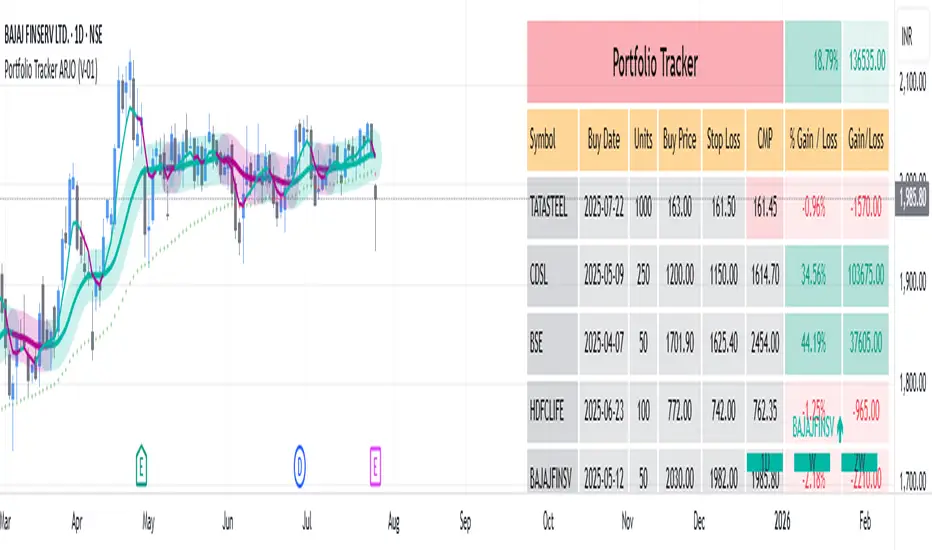
Portfolio Tracker ARJO (V-01)Portfolio Tracker ARJO (V-01)
This indicator is a user-friendly portfolio tracking tool designed for TradingView charts. It overlays a customizable table on your chart to monitor up to 15 stocks or symbols in your portfolio. It calculates real-time metrics like current market price (CMP), gains/losses, and stoploss breaches, helping you stay on top of your investments without switching between multiple charts. The table uses color-coding for quick visual insights: green for profits, red for losses, and highlights breached stoplosses in red for alerts. It also shows portfolio-wide totals for overall performance.
Key Features
Supports up to 15 Symbols: Enter stock tickers (e.g., NSE:RELIANCE or BSE:TCS) with details like buy price, date, units, and stoploss.
Symbol: The stock ticker and description.
Buy Date: When you purchased it.
Units: Number of shares/units held.
Buy Price: Your entry price.
Stop Loss: Your set stoploss level (highlighted in red if breached by CMP).
CMP: Current market price (fetched from the chart's timeframe).
% Gain/Loss: Percentage change from buy price (color-coded: green for positive, red for negative).
Gain/Loss: Total monetary gain/loss based on units.
Optional Timeframe Columns: Toggle to show % change over 1 Week (1W), 1 Month (1M), 3 Months (3M), and 6 Months (6M) for historical performance.
Portfolio Summary: At the top of the table, see total % gain/loss and absolute gain/loss for your entire portfolio.
Visual Customizations: Adjust table position (e.g., Top Right), size, colors for positive/negative values, and intensity cutoff for gradients.
Benchmark Index-Based Header: The title row's background color reflects NIFTY's weekly trend (green if above 10-week SMA, red if below) for market context.
Benchmark Index-Based Header: The title row's background color reflects NIFTY's weekly trend (green if above 10-week SMA, red if below) for market context.
How to Use It: Step-by-Step Guide
Add the Indicator to Your Chart: Search for "Portfolio Tracker ARJO (V-01)" in TradingView's indicator library and add it to any chart (preferably Daily timeframe for accuracy).
Input Your Portfolio Symbols:
Open the indicator settings (gear icon).
In the "Symbol 1" to "Symbol 15" groups, fill in:
Symbol: Enter the ticker (e.g., NSE:INFY).
Year/Month/Day: Select your buy date (e.g., 2024-07-01).
Buy Price: Your purchase price per unit.
Stoploss: Your exit price if things go south.
Units: How many shares you own.
Only fill what you need—leave extras blank. The table auto-adjusts to show only entered symbols.
Customize the Table (Optional):
In "Table settings":
Choose position (e.g., Top Right) and size (% of chart).
Toggle "Show Timeframe Columns" to add 1W/1M/3M/6M performance.
In "Color settings":
Pick colors for positive (green) and negative (red) cells.
Set "Color intensity cutoff (%)" to control how strong the colors get (e.g., 10% means changes above 10% max out the color).
Interpret the Table on Your Chart:
The table appears overlaid—scan rows for each symbol's stats.
Look at colors: Greener = better gains; redder = bigger losses.
Check CMP cell: Red means stoploss breached—consider selling!
Portfolio Gain/Loss at the top gives a quick overall health check.
For Best Results:
Use on a Daily chart to avoid CMP errors (the script will warn if on Weekly/Monthly).
Refresh the chart or wait for a new bar if data doesn't update immediately.
For Indian stocks, prefix with NSE: or BSE: (e.g., BSE:RELIANCE).
This is for tracking only—not trading signals. Combine with your strategy.
If no symbols show, ensure inputs are valid (e.g., buy price > 0, valid date).
Finally, this tool makes it quite easy for beginners to track their portfolios, while also giving advanced traders powerful and customizable insights. I'd love to hear your feedback—happy trading!
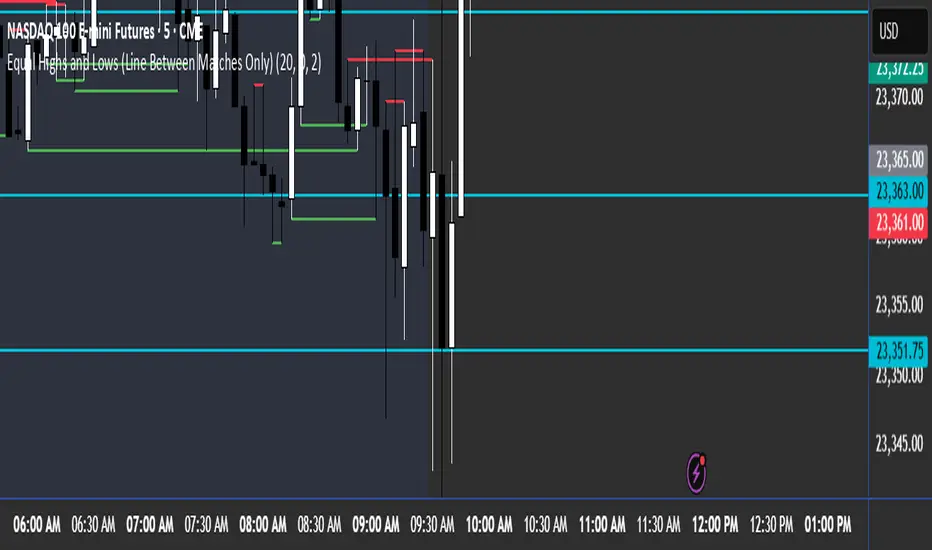
Equal Highs and Lows (Line Between Matches Only)marks out equal highs and lows with a solid red line and solid green line. Only marks out till the next candle
Choch Pattern Levels [BigBeluga]🔵 OVERVIEW
The Choch Pattern Levels indicator automatically detects Change of Character (CHoCH) shifts in market structure — crucial moments that often signal early trend reversals or major directional transitions. It plots the structural break level, visualizes the pattern zone with triangle overlays, and tracks delta volume to help traders assess the strength behind each move.
🔵 CONCEPTS
CHoCH Pattern: A bullish CHoCH forms when price breaks a previous swing high after a swing low, while a bearish CHoCH appears when price breaks a swing low after a prior swing high.
Break Level Mapping: The indicator identifies the highest or lowest point between the pivot and the breakout, marking it with a clean horizontal level where price often reacts.
Delta Volume Tracking: Net bullish or bearish volume is accumulated between the pivot and the breakout, revealing the momentum and conviction behind each CHoCH.
Chart Clean-Up: If price later closes through the CHoCH level, the zone is automatically removed to maintain clarity and focus on active setups only.
🔵 FEATURES
Automatic CHoCH pattern detection using pivot-based logic.
Triangle shapes show structure break: pivot → breakout → internal high/low.
Horizontal level marks the structural zone with a ◯ symbol.
Optional delta volume label with directional sign (+/−).
Green visuals for bullish CHoCHs, red for bearish.
Fully auto-cleaning invalidated levels to reduce clutter.
Clean organization of all lines, labels, and overlays.
User-defined Length input to adjust pivot sensitivity.
🔵 HOW TO USE
Use CHoCH levels as early trend reversal zones or confirmation signals.
Treat bullish CHoCHs as support zones, bearish CHoCHs as resistance.
Look for high delta volume to validate the strength behind each CHoCH.
Combine with other BigBeluga tools like supply/demand, FVGs, or liquidity maps for confluence.
Adjust pivot Length based on your strategy — shorter for intraday, longer for swing trading.
🔵 CONCLUSION
Choch Pattern Levels highlights key structural breaks that can mark the start of new trends. By combining precise break detection with volume analytics and automatic cleanup, it provides actionable insights into the true intent behind price moves — giving traders a clean edge in spotting early reversals and key reaction zones.

🗓️ Day Separator🗓️ Day Separator – Visual Day Markers for Your Chart
This script adds automatic vertical lines to visually separate each trading day on your chart. It helps you quickly identify where each day starts and ends — especially useful for intraday and scalping strategies.
✅ Features:
Distinct colored lines for each weekday (Monday to Friday)
Optional day-of-week labels (toggle on/off)
Custom label position (top or bottom of the chart)
Works on any timeframe
Whether you're tracking market sessions or reviewing daily price action, this tool gives you a clean structure to navigate your charts with more clarity.

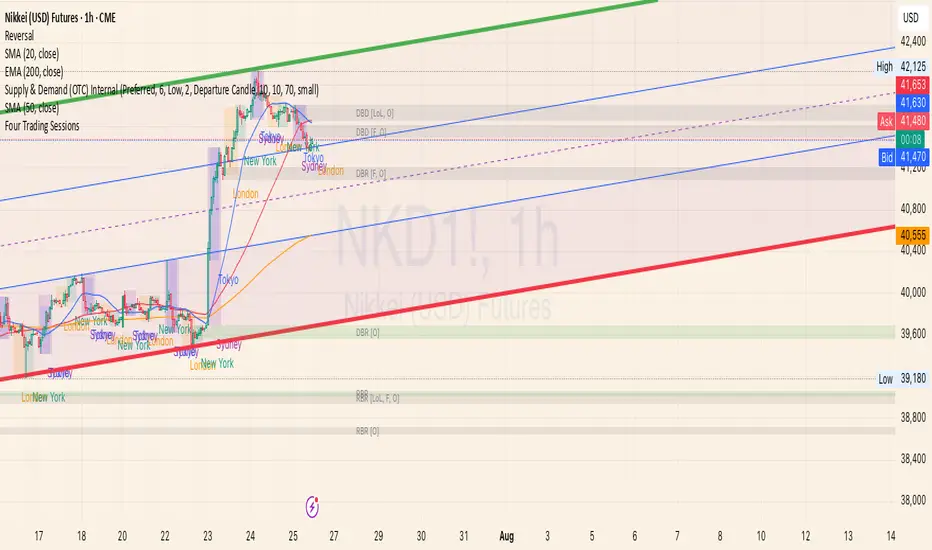
Four Trading SessionsIve adapted this from someone else's script to include 4 sessions instead of 3
TradingView Indicator Description: Trading Sessions
Overview:
The "Trading Sessions" indicator, written in Pine Script v5, visually highlights major forex trading sessions (Tokyo, London, New York, and Sydney) on intraday charts. It displays session ranges as colored boxes, with optional open/close lines, average price lines, and labels showing session names, tick ranges, and average prices. Users can customize session times, time zones, colors, and display options.
Key Features:
Customizable Sessions: Supports up to four trading sessions (Tokyo, London, New York, Sydney) with user-defined names, time ranges, and time zones (e.g., "Asia/Tokyo", "America/New_York").
Visual Elements:
Draws semi-transparent boxes to mark session price ranges (high/low).
Optional dashed lines for session open and close prices.
Optional dotted line for the session's average price.
Labels displaying session name, tick range, and/or average price (configurable).
Time Zone Support: Specify time zones using IANA database names (e.g., "Australia/Sydney") or GMT notation, with a recommendation for IANA to handle daylight savings.
Display Options: Toggle session names, open/close lines, tick range, and average price visibility.
Intraday Restriction: Works only on intraday timeframes, with an error for daily/weekly/monthly charts.
Performance Optimized: Limits boxes, lines, and labels to 500 each to ensure smooth performance.
Inputs:
General Settings:
Show session names, open/close lines, tick range, and average price (all enabled by default).
Per Session (Tokyo, London, New York, Sydney):
Enable/disable session display.
Custom session name (e.g., "Tokyo").
Session time range (e.g., "0900-1500" for Tokyo).
Time zone (e.g., "Asia/Tokyo").
Session color (semi-transparent blue, orange, green, purple by default).
How It Works:
The script checks if the current bar falls within a session’s time range (adjusted for the specified time zone).
For each active session, it creates a box spanning the session’s high/low and updates it bar-by-bar.
Optional open/close lines and an average price line are drawn and updated dynamically.
Labels display user-selected metrics (name, range, average price) at the bottom of each session box.
Sessions reset daily, ensuring accurate representation across days.
Use Case:
Ideal for forex traders who want to analyze price action during specific trading sessions. The indicator helps identify session-specific volatility, key price levels, and trends, with clear visual cues and customizable settings.
Limitations:
Only works on intraday timeframes.
Limited to 500 boxes, lines, and labels to prevent performance issues.
Requires accurate time zone settings for proper session alignment.
Example:
Enable the Tokyo and New York sessions, set their respective time zones, and toggle on all display options to see colored boxes, open/close lines, average price lines, and labels with tick ranges and averages for each session.
High Win Rate Trader by iambuoyant# High Win Rate Trader by iambuoyant - Complete Guide
## Introduction
The "High Win Rate Trader by iambuoyant" is a comprehensive Pine Script indicator designed to identify high-probability trading opportunities across various market conditions. Built with a multi-faceted approach, it integrates several key technical analysis concepts to provide robust buy and sell signals, aiming to maximize potential returns while managing risk. This indicator is particularly useful for traders looking for confirmed entries based on a confluence of factors rather than relying on a single signal.
## Core Philosophy
This indicator operates on the principle that **multiple confirming factors create higher probability trades**. Instead of relying on a single indicator, it combines trend analysis, momentum oscillators, volume confirmation, market structure, and mathematical levels to identify optimal entry points. The more confluence factors that align, the stronger the trading signal.
## Strategies and Confluence Factors
### 1. Trend Analysis
**Purpose**: Establishes the overall market direction to ensure trades align with momentum.
**Components**:
- **Fast EMA (Default: 9)**: Short-term trend detection
- **Slow EMA (Default: 21)**: Medium-term trend confirmation
- **Trend EMA (Default: 50)**: Long-term trend establishment
**How it works**:
- **Bullish Trend**: Fast EMA > Slow EMA > Trend EMA
- **Bearish Trend**: Fast EMA < Slow EMA < Trend EMA
- Signals are filtered to only trigger in the direction of the established trend
**Default Settings**:
- Fast EMA Period: 9
- Slow EMA Period: 21
- Trend EMA Period: 50
### 2. Oscillator Confirmation
**Purpose**: Identifies overbought/oversold conditions and momentum shifts.
#### RSI (Relative Strength Index)
- **Period (Default: 14)**: Standard RSI calculation period
- **Overbought Level (Default: 70)**: RSI level considered overbought
- **Oversold Level (Default: 30)**: RSI level considered oversold
**How it works**:
- **Bullish**: RSI < 40 and turning upward (oversold recovery)
- **Bearish**: RSI > 60 and turning downward (overbought rejection)
#### Stochastic Oscillator
- **K Period (Default: 14)**: Stochastic %K calculation period
- **D Period (Default: 3)**: Stochastic %D smoothing period
- **Overbought Level (Default: 80)**: Stochastic overbought threshold
- **Oversold Level (Default: 20)**: Stochastic oversold threshold
**How it works**:
- **Bullish**: %K < 30 and (%K turning up OR %K > %D)
- **Bearish**: %K > 70 and (%K turning down OR %K < %D)
### 3. MACD (Moving Average Convergence Divergence)
**Purpose**: Confirms momentum shifts and trend changes.
**Components**:
- **Fast Period (Default: 12)**: Fast EMA for MACD calculation
- **Slow Period (Default: 26)**: Slow EMA for MACD calculation
- **Signal Period (Default: 9)**: Signal line smoothing period
**How it works**:
- **Bullish**: MACD line > Signal line OR (MACD rising AND histogram increasing)
- **Bearish**: MACD line < Signal line OR (MACD falling AND histogram decreasing)
### 4. Volume Analysis
**Purpose**: Confirms price moves with volume conviction.
**Components**:
- **Volume MA Period (Default: 20)**: Period for volume moving average
- **Volume Multiplier (Default: 1.5)**: Volume threshold multiplier
**How it works**:
- **Bullish**: Current volume > (Volume MA × 1.5)
- **Bearish**: Current volume > (Volume MA × 1.5)
### 5. Market Structure and Volatility
#### Support and Resistance Levels
- **Pivot Length (Default: 10)**: Period for pivot high/low detection
- **Dynamic Levels**: Automatically identifies recent swing highs and lows
- **Proximity Check**: Ensures trades aren't initiated too close to S/R levels
#### ATR (Average True Range)
- **ATR Period (Default: 14)**: Volatility measurement period
- **ATR Multiplier (Default: 2.0)**: Stop loss distance multiplier
- **Volatility Filter (Default: 50.0%)**: Maximum allowed volatility percentage
**How it works**:
- Calculates market volatility using ATR
- Prevents trades in excessively volatile conditions
- Helps determine dynamic stop loss levels
### 6. Fibonacci Retracements
**Purpose**: Identifies key mathematical support/resistance levels.
**Components**:
- **Lookback Period (Default: 50)**: Period for swing high/low calculation
- **Tolerance (Default: 2.0%)**: Price proximity tolerance to Fib levels
**Key Levels**: 23.6%, 38.2%, 50%, 61.8%, 78.6%
**How it works**:
- **Bullish**: Price near 38.2%, 50%, or 61.8% retracement levels in uptrend
- **Bearish**: Price near 38.2%, 50%, or 61.8% retracement levels in downtrend
### 7. Risk Management
#### Risk:Reward Ratio
- **Minimum RR Ratio (Default: 1.0)**: Minimum acceptable risk:reward ratio
- **Dynamic Calculation**: Based on support/resistance levels and ATR
#### Dynamic Stop Loss
- **ATR-based**: Stop loss = Entry ± (ATR × 1.5)
- **S/R-based**: Uses nearby support/resistance levels when available
### 8. Signal Confirmation
**Confirmation Bars (Default: 0)**:
- **0**: Immediate signals (recommended for testing)
- **1+**: Delayed confirmation for reduced false signals
## How to Use the Indicator
### Step 1: Initial Setup
1. **Add to Chart**: Apply the "High Win Rate Trader by iambuoyant" indicator to your desired chart in TradingView
2. **Verify Display**: Ensure you can see the indicator plots and debug pane below the main chart
### Step 2: Understanding the Signals
#### Visual Elements:
- **Green Triangles (Buy)**: Appear below price bars for long entry signals
- **Red Triangles (Sell)**: Appear above price bars for short entry signals
- **Labels**: Show "BUY" or "SELL" with current RSI value
- **EMA Lines**: Blue (Fast), Orange (Slow), Gray (Trend) - visible when enabled
#### Signal Types:
- **Flash Signals**: Immediate signals when conditions are first met
- **Confirmed Signals**: Signals that have passed confirmation criteria
### Step 3: Debugging and Optimization
#### Access Debug Features:
1. Click the gear icon next to the indicator name
2. Navigate to "Signal Components (Debugging)" section
3. All confluence factors start **disabled** by default
#### Initial Testing Process:
1. **Start Simple**: Keep all "Enable X Condition" toggles **OFF**
2. **Enable Basic**: Turn on "Enable RSI Condition" first
3. **Observe Signals**: Check if buy/sell signals appear
4. **Gradual Addition**: Enable one condition at a time
5. **Monitor Debug Plots**: Watch the colored crosses in the lower pane
#### Debug Plot Interpretation:
- **Green Crosses (Value 1)**: Bullish conditions met
- **Red Crosses (Value 2)**: Bearish conditions met
- **No Cross**: Condition not met
- **"Debug: Final Long/Short Signal"**: Combined signal output
### Step 4: Fine-tuning Parameters
#### If Signals Are Too Rare:
1. **Reduce Thresholds**: Lower RSI overbought/oversold levels
2. **Relax Filters**: Increase volatility filter percentage
3. **Adjust Timeframes**: Modify EMA periods for your trading style
4. **Disable Strict Conditions**: Turn off conditions that are too restrictive
#### If Signals Are Too Frequent:
1. **Increase Thresholds**: Raise RSI levels
2. **Add Filters**: Enable more confluence conditions
3. **Stricter Confirmation**: Increase confirmation bars
4. **Higher RR Ratio**: Increase minimum risk:reward requirement
### Step 5: Display Configuration
#### Display Options:
- **Show Buy/Sell Labels**: Toggle signal labels on/off
- **Show Support/Resistance**: Toggle S/R level lines
- **Show Trend EMAs**: Toggle EMA trend lines
### Step 6: Setting Up Alerts
#### Alert Conditions:
- **"Confirmed Buy Signal"**: Triggers on confirmed long entries
- **"Confirmed Sell Signal"**: Triggers on confirmed short entries
#### Alert Message Format:
- Buy: "BUY - RSI: , Price: "
- Sell: "SELL - RSI: , Price: "
## Recommended Settings by Market Type
### Trending Markets:
- Enable: Trend Alignment, RSI, MACD
- Disable: Volume (optional)
- Confirmation Bars: 1-2
### Ranging Markets:
- Enable: RSI, Stochastic, Support/Resistance
- Disable: Trend Alignment
- Confirmation Bars: 0
### Volatile Markets:
- Enable: Volatility Filter, ATR-based stops
- Reduce: RSI thresholds (60/40 instead of 70/30)
- Increase: Confirmation bars to 2-3
## Troubleshooting
### No Signals Appearing:
1. Check if any "Enable X Condition" is turned ON
2. Verify debug plots show activity
3. Reduce parameter thresholds
4. Check if market conditions match your settings
### Too Many False Signals:
1. Enable more confluence conditions
2. Increase confirmation bars
3. Adjust RSI/Stochastic thresholds
4. Enable volatility filter
### Signals Not Aligning with Price Action:
1. Check trend alignment settings
2. Verify EMA periods match your timeframe
3. Adjust Fibonacci lookback period
4. Review support/resistance proximity settings
## Best Practices
1. **Start Conservative**: Begin with fewer confluence factors and gradually add more
2. **Test Thoroughly**: Use demo accounts to test parameter combinations
3. **Monitor Debug Plots**: Regularly check which conditions are failing
4. **Adapt to Market**: Adjust settings based on current market conditions
5. **Use Multiple Timeframes**: Consider higher timeframe trend direction
6. **Risk Management**: Always use proper position sizing and stop losses
## Default Settings Summary
### Trend Analysis:
- Fast EMA: 9
- Slow EMA: 21
- Trend EMA: 50
### Oscillators:
- RSI Period: 14, Overbought: 70, Oversold: 30
- Stochastic K: 14, D: 3, Overbought: 80, Oversold: 20
### MACD:
- Fast: 12, Slow: 26, Signal: 9
### Volume:
- MA Period: 20, Multiplier: 1.5
### Market Structure:
- ATR Period: 14, Multiplier: 2.0
- Volatility Filter: 50.0%
- Pivot Length: 10
### Fibonacci:
- Lookback: 50, Tolerance: 2.0%
### Signal Quality:
- Confirmation Bars: 0
- Min RR Ratio: 1.0
### Display:
- Show Labels: ON
- Show S/R: ON
- Show Trend: ON
### Debug (All Disabled by Default):
- Enable RSI: OFF
- Enable Stochastic: OFF
- Enable MACD: OFF
- Enable Price Structure: OFF
- Enable Trend Alignment: OFF
- Enable Volume: OFF
- Enable Fibonacci: OFF
- Enable Risk:Reward: OFF
- Enable Volatility: OFF
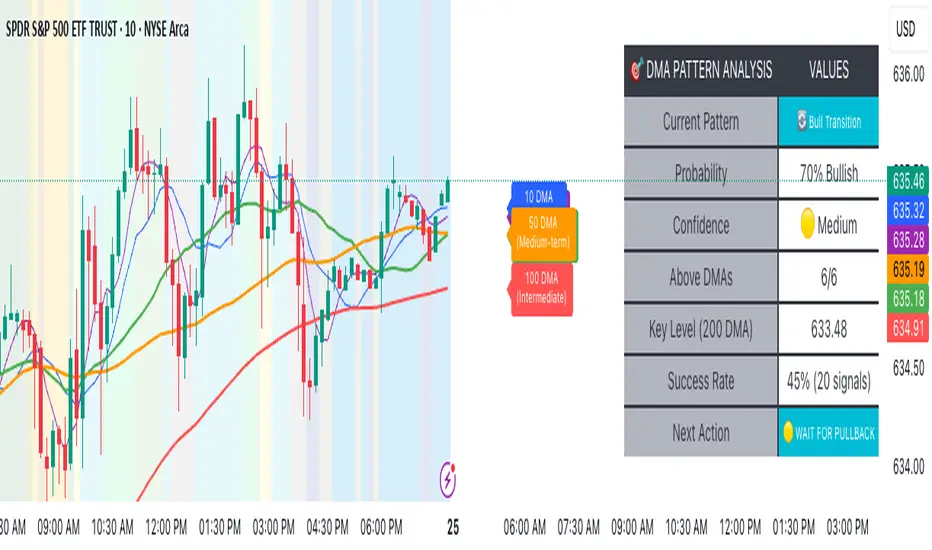
Advanced DMA Pattern Detection SystemAdvanced DMA Pattern Detection System with Smart Intelligence
Professional-grade moving average indicator that combines traditional DMA analysis with advanced pattern recognition and probabilistic forecasting.
Core Features:
6 Key DMAs (5, 10, 20, 50, 100, 200) with descriptive labels showing trading purpose
Advanced Pattern Recognition - Detects Institutional Accumulation, Distribution Phases, Bull/Bear Transitions, and Choppy Markets
Probability Engine - Assigns confidence scores (0-100%) with Low/Medium/High classifications
Historical Validation - Tracks success rate of last 20 pattern signals for real performance data
Smart Alert System - Only triggers on significant pattern changes (20%+ probability shifts)
Dual Display System:
Movable Information Table - Shows current pattern, probability, confidence level, success rate, and recommended action
Chart Alerts & Background Colors - Visual confirmation of high-confidence setups (80%+ patterns)
Traditional DMA Labels - Clear identification of each average's trading significance
Complete Customization:
Master on/off controls for entire system
Individual toggles for all components (DMAs, table, alerts, colors)
Adjustable alert sensitivity (Conservative/Medium/Aggressive)
6 table positions to fit any chart layout
Perfect For: Swing traders, position traders, and anyone wanting systematic trend analysis with quantified probability scores rather than subjective interpretation.
Bottom Line: Transforms basic moving averages into an intelligent trading system that tells you exactly what the market structure means and what to do about it.
Common DMAs with LabelsHere's a short description for publishing:
Common Daily Moving Averages (DMA) Indicator with Smart Labels
Displays the most widely-used moving averages that professional traders watch: 5, 10, 20, 50, 100, and 200 DMAs with clear color-coding and descriptive labels.
Key Features:
Smart Labels - Each DMA shows its trading purpose (Day Trading, Swing Trading, Bull/Bear Line, etc.)
Customizable Display - Toggle any DMA on/off individually
Golden/Death Cross Alerts - Optional 50/200 crossover signals
Live Status Table - Shows current DMA values vs price with up/down arrows
Professional Styling - Color-coded lines with appropriate thickness (200 DMA emphasized)
Perfect for:
Multi-timeframe trend analysis
Support/resistance identification
Bull/bear market confirmation
Entry/exit timing
Usage: Add to chart, customize which DMAs to display in settings. Labels appear on the right showing each average's trading significance. Enable the status table for quick price-vs-DMA reference.
Ideal for both beginners learning key moving averages and experienced traders wanting a clean, informative DMA setup.