Buy/Sell Signals(Mastersinnifty)Description
This script generates simple Buy/Sell signals based on the Relative Strength Index (RSI) crossing the midpoint level of 50. It's designed for traders who prefer clear, rule-based entries and exits derived from momentum shifts.
How It Works
Calculates RSI using the closing price and a 14-period length.
Generates a Buy signal when RSI crosses above 50, indicating potential bullish momentum.
Generates a Sell signal when RSI crosses below 50, indicating potential bearish momentum.
Plots the signals as labels directly on the price chart.
Inputs
RSI Source: Close (fixed in the script)
RSI Length: 14 (standard default)
Use Case
Useful for identifying momentum shifts and trend confirmations.
Can be combined with other technical tools like support/resistance or volume for enhanced decision-making.
Best suited for intraday or swing trading strategies that use momentum-based entry signals.
Disclaimer
This indicator is intended for educational and informational purposes only. It does not constitute financial advice. Always perform your own due diligence and consult a financial advisor before making trading decisions.
Crossoverstrategy

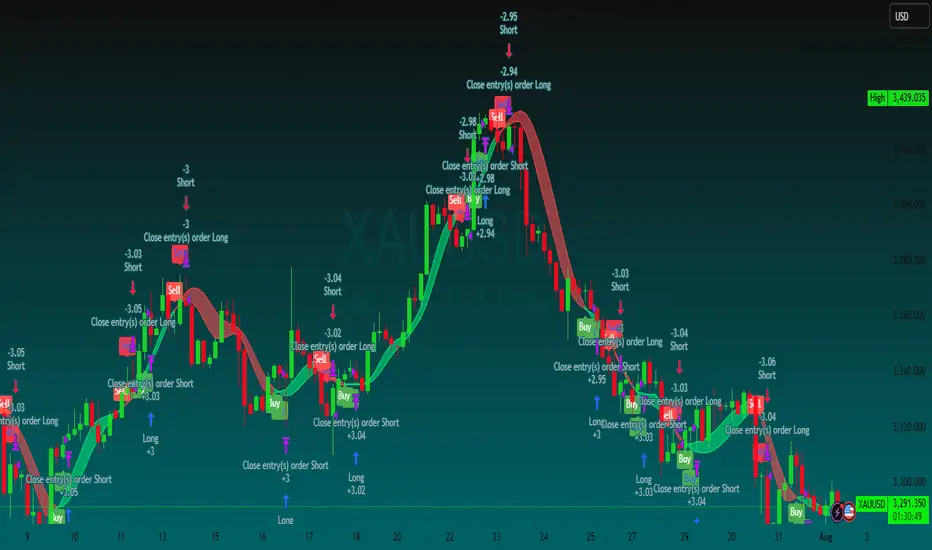
HMA Strategy HMA Strat (Hull Moving Average Strategy) Indicator Description
The HMA Strat is a trend-following strategy that uses a dual Hull Moving Average system. It helps identify continuation and high-probability reversal signals in both bullish and bearish market conditions. The strategy aims to reduce noise while maintaining sensitivity to changes in price momentum by comparing the standard Hull Moving Average (HMA) to a smoothed version.
This strategy is ideal for traders who focus on systematic backtesting, momentum entry, and simple charts. It features integrated plotting, color-zoning, and strategic actions based on TradingView's strategy engine. The system provides dynamic long and short signals based on crossover logic.
Key Features
Dual HMA Framework: To improve signal quality and reduce choppy trend identification, it compares a regular HMA with a smoothed version (HMA3).
Entries Based on Crossover
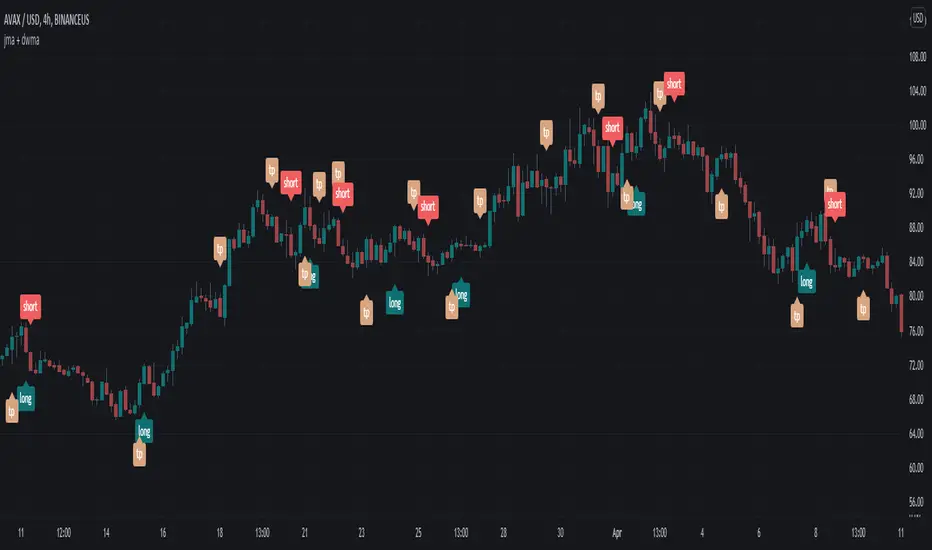
jma + dwma crossoverThis crossover system was originally conceptualized by Jurik Research and made public to the world on their website .
The indicator consists of the faster Jurik Moving Average (JMA) and the slower Double Weighted Moving Average (DWMA). A long signal is shown when the JMA line crosses above the DWMA line (indicating a possible reversal in trend). A short signal is shown when the JMA line crosses below the DWMA line. Take profit signals are shown when the JMA line reverses directions. Alerts for signals are included in this indicator.
The default settings are not optimized for any timeframe. Both JMA and DWMA lines are defaulted to hidden.
Credit to @everget for the re-creation of the Jurik Moving Average in pinecsript.