Cycles
Gaussian Volatility Adjusted Gaussian Volatility Adjusted Indicator
The Gaussian Volatility Adjusted indicator is a powerful tool designed to identify trend direction and momentum by combining a Gaussian-filtered moving average with volatility-based thresholds. By smoothing price data with a Gaussian filter and adjusting for market volatility using Average True Range (ATR) and Standard Deviation (SD), this indicator generates clear bullish and bearish signals. The Exponential Moving Average (EMA) of the momentum difference and price bars are dynamically colored to highlight trend strength, making it easier for traders to identify potential entry and exit points in various market conditions.
How It Works
Gaussian Filter Calculations
Gaussian Filter: Applies a Gaussian smoothing filter to a user-defined price source, typically an EMA of the closing price, over a configurable length (default: 70) with a specified sigma (default: 12). The Gaussian filter uses a weighted sum based on a Gaussian distribution to reduce noise while preserving significant price trends. Weights are calculated using the Gaussian formula and normalized to ensure accurate smoothing.
Base Moving Average: Optionally applies an EMA (default: enabled, length: 45) to the closing price before Gaussian filtering, providing a smoother input for the Gaussian calculation to enhance signal reliability.
Volatility Adjustments
ATR-Based Bands: Calculates the Average True Range (ATR) over a user-defined period (default: 24), scaled by a sensitivity factor (default: 1) and an ATR factor (default: 0.85). These form volatility-adjusted bands around the Gaussian-filtered value:
Upper Band: Gaussian value + (ATR × ATR Factor).
Lower Band: Gaussian value - (ATR × ATR Factor).
Standard Deviation Bands: Computes the Standard Deviation (SD) of the closing price over a user-defined period (default: 27), scaled by the sensitivity factor. These form additional bands:
Upper SD Band: Gaussian value + SD.
Lower SD Band: Gaussian value - SD.
Trend and Momentum SignalsTrend
Detection:Bullish Trend: Triggered when the closing price exceeds the upper SD band, setting the trend to +1.
Bearish Trend: Triggered when the closing price falls below the upper ATR-based band, setting the trend to -1.
Momentum Calculation: Computes a momentum difference (Diff) based on the trend:
For a bullish trend (+1), Diff = Close - Upper ATR Band.
For a bearish trend (-1), Diff = Close - (Gaussian + SD).
EMA of Momentum: Applies an EMA (default length: 45) to the momentum difference to smooth the momentum signal.
Final Trend with EMA Confluences:
If EMA confluence is enabled (default: true), a bullish signal (+1) is confirmed when the trend is +1 and Diff exceeds the EMA of Diff. A bearish signal (-1) is confirmed when the trend is -1 and Diff is below the EMA of Diff.
If EMA confluence is disabled, the final trend follows the initial trend direction (±1).
Visual Representation
The indicator provides a clear and intuitive visual interface:
EMA Line: Plots the EMA of the momentum difference, colored based on the final trend:
Green: Bullish trend (Final_Trend = +1).
Red: Bearish trend (Final_Trend = -1).
Gray: Neutral or no trend.
Zero Line: A dashed line at zero (semi-transparent) serves as a reference for the EMA plot.
Bar Coloring: Price bars are colored to reflect the trend:
Green: Bullish trend (Final_Trend = +1).
Red: Bearish trend (Final_Trend = -1).
No Color: Neutral or no trend.
Volatility Bands: While not plotted in the provided script, the ATR and SD bands are calculated and could be plotted for additional context, marking key levels for trend detection.
Customization & Parameters
The Gaussian Volatility Adjusted indicator offers flexible parameters to suit various trading styles:
Volatility Parameters:
ATR Length: Period for ATR calculation (default: 24).
ATR Factor: Multiplier for ATR-based bands (default: 0.85).
SD Length: Period for Standard Deviation calculation (default: 27).
Sensitivity: Scales ATR and SD for band sensitivity (default: 1).
Moving Average Parameters:
Use EMA Confluence: Enable/disable EMA confluence for trend confirmation (default: true).
EMA Length: Period for EMA calculations (default: 45).
Gaussian Parameter:
Gaussian Length: Period for Gaussian filter (default: 70).
Sigma: Controls the Gaussian filter’s smoothness (default: 12).
Color Settings: EMA line and bars use green for bullish signals, red for bearish signals, and gray for neutral states, with customizable transparency for the zero line.
Trading Applications
This indicator is versatile and can be applied across various markets and strategies:
Trend Following:
Use the final trend signals and bar coloring to identify and follow bullish or bearish trends, with the Gaussian filter reducing noise for clearer trend detection.
Momentum Trading: The EMA of the momentum difference highlights strong momentum shifts, ideal for entering or exiting trades based on trend strength.
Reversal Detection: Monitor price crossings of the ATR and SD bands to identify potential trend reversals, especially when confirmed by the EMA confluence.
Scalping and Swing Trading: Adjust parameters (e.g., ATR length, Gaussian length, or sensitivity) to suit short-term scalping or longer-term swing trading strategies.
Final Note
The Gaussian Volatility Adjusted indicator is a robust tool for traders seeking to leverage smoothed price data and volatility-adjusted thresholds for trend and momentum analysis. Its combination of Gaussian filtering, ATR and SD-based bands, and EMA confluence provides a comprehensive framework for identifying trading opportunities. The dynamic coloring of the EMA line and price bars enhances visual clarity, making it easier to act on signals. As with all indicators, backtest thoroughly and integrate into a comprehensive trading strategy for optimal results.

Kalman VWMA For LoopKalman VWMA For Loop Indicator
The Kalman VWMA For Loop indicator is a sophisticated tool designed to smooth price data using a Kalman filter applied to a Volume Weighted Moving Average (VWMA). By combining the VWMA’s volume-weighted price sensitivity with the adaptive noise reduction of a Kalman filter, this indicator provides traders with a robust momentum and trend-following signal. The indicator includes a customizable for-loop mechanism to potentially iterate over a range of calculations or parameters, enhancing flexibility for advanced trading strategies. Visual outputs are plotted to help traders identify trends and potential trading opportunities with reduced noise.
How It Works
VWMA Calculations
Volume Weighted Moving Average (VWMA): Computes a VWMA based on a user-selected price source (default: Close) over a configurable period (default: 14). The VWMA weights price data by trading volume, providing a more accurate representation of market activity compared to a simple moving average.
Kalman Filter Calculation
Kalman Filter: Applies a Kalman filter to the price source to smooth price movements and reduce noise.
The filter uses:
Process Noise: Controls the adaptability of the filter to price changes (default: 0.01).
Measurement Noise: Adjusts sensitivity to price fluctuations (default: 3).
Filter Order (N): Defines the number of states in the Kalman filter (default: 3), allowing for multi-state modeling of price dynamics.
The Kalman filter iteratively predicts and updates the price estimate using state estimates and error covariances stored in arrays. This process minimizes noise while preserving significant price trends.
For-Loop Mechanism
The script includes a for-loop structure with user-defined parameters (from and to_, defaulting to 1 and 25, respectively). While the provided code does not fully implement the for-loop’s functionality, it is intended to allow iterative calculations or parameter sweeps, such as testing multiple periods or thresholds within the specified range. This feature enhances the indicator’s flexibility for optimization or multi-scenario analysis.
Visual Representations
The indicator plots the VWMA as a red line on the chart, providing a clear visual reference for the volume-weighted trend.
The Kalman-filtered price is calculated but not plotted in the provided code. When plotted, it would appear as a smoothed price line, highlighting the underlying trend with reduced noise.
The for-loop parameters suggest potential for additional visual outputs (e.g., multiple VWMA lines or signals) if fully implemented, but the current script only plots the VWMA.
Customization & Parameters
The Kalman VWMA For Loop indicator offers flexible parameters to suit various trading styles:
Moving Average Parameters:
Price Source: Select the input price (default: Close; options: Close, High, Low, Open).
MA Period: Adjust the VWMA calculation period (default: 14).
Kalman Parameters:
Process Noise: Adjusts the filter’s adaptability to price changes (default: 0.01).
Measurement Noise: Controls sensitivity to price fluctuations (default: 3).
Filter Order (N): Sets the number of states for the Kalman filter (default: 3).
For-Loop Parameters:
From: Starting value for the for-loop (default: 1).
To: Ending value for the for-loop (default: 25).
Color Settings: The VWMA is plotted in red, with potential for additional customizable colors if the for-loop is expanded to plot multiple outputs.
Trading Applications
This indicator is versatile and can be applied across various markets and strategies:
Trend Following:
Use the Kalman-filtered price and VWMA to identify the direction and strength of trends, with the smoothed output reducing false signals in volatile markets.
Momentum Trading: The VWMA highlights volume-driven price movements, allowing traders to enter or exit based on momentum shifts.
Parameter Optimization: The for-loop structure (if fully implemented) enables testing multiple VWMA periods or Kalman parameters, aiding in strategy optimization.
Scalping and Swing Trading: Adjust the MA period and Kalman parameters to suit short-term (scalping) or longer-term (swing trading) strategies.
Final Note
The Kalman VWMA For Loop indicator is a powerful tool for traders seeking to combine volume-weighted price analysis with advanced noise reduction via a Kalman filter. Its customizable parameters and potential for iterative calculations through the for-loop make it adaptable to various trading styles. While the for-loop functionality is not fully implemented in the provided code, completing it could enable dynamic parameter testing or signal generation. As with all indicators, backtest thoroughly and integrate into a comprehensive trading strategy for optimal results.

Super-Elliptic BandsThe core of the "Super-Elliptic Bands" indicator lies in its use of a super-ellipse mathematical model to create dynamic price bands around a central Simple Moving Average (SMA). Here's a concise breakdown of its essential components:
Central Moving Average (MA):
A Simple Moving Average (ta.sma(close, maLen)) serves as the baseline, anchoring the bands to the average price over a user-defined period (default: 50 bars).
Super-Ellipse Formula:
The bands are generated using the super-ellipse equation: |y/b| = (1 - |x/a|^p)^(1/p), where:
x is a normalized bar index based on a user-defined cycle period (periodBase, default: 64), scaled to range from -1 to +1.
a = 1 (fixed semi-major axis).
b is the volatility-based semi-minor axis, calculated as volRaw * mult, where volRaw comes from ta.stdev, ta.atr, or ta.tr (user-selectable).
p (shapeP, default: 2.0) controls the band shape:
p = 2: Elliptical bands.
p < 2: Pointier, diamond-like shapes.
p > 2: Flatter, rectangular-like shapes.
This formula creates bands that dynamically adjust their width and shape based on price volatility and a cyclical component.
enjoy....
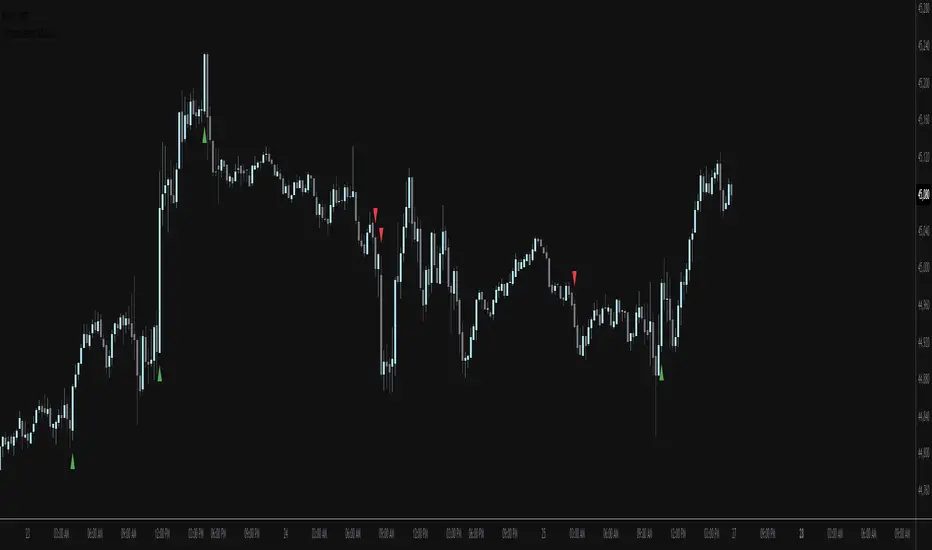
Ashish indicator//@version=5
// Copyright (c) 2021-present, Alex Orekhov (everget)
indicator('Ashish indicator', overlay=true)
amplitude = input(title='Amplitude', defval=1)
channelDeviation = input(title='Channel Deviation', defval=2)
showArrows = input(title='Show Arrows', defval=true)
showChannels = input(title='Show Channels', defval=false)
var int trend = 0
var int nextTrend = 0
var float maxLowPrice = nz(low , low)
var float minHighPrice = nz(high , high)
var float up = 0.0
var float down = 0.0
float atrHigh = 0.0
float atrLow = 0.0
float arrowUp = na
float arrowDown = na
atr2 = ta.atr(100) / 2
dev = channelDeviation * atr2
highPrice = high
lowPrice = low
highma = ta.sma(high, amplitude)
lowma = ta.sma(low, amplitude)
if nextTrend == 1
maxLowPrice := math.max(lowPrice, maxLowPrice)
if highma < maxLowPrice and close < nz(low , low)
trend := 1
nextTrend := 0
minHighPrice := highPrice
minHighPrice
else
minHighPrice := math.min(highPrice, minHighPrice)
if lowma > minHighPrice and close > nz(high , high)
trend := 0
nextTrend := 1
maxLowPrice := lowPrice
maxLowPrice
if trend == 0
if not na(trend ) and trend != 0
up := na(down ) ? down : down
arrowUp := up - atr2
arrowUp
else
up := na(up ) ? maxLowPrice : math.max(maxLowPrice, up )
up
atrHigh := up + dev
atrLow := up - dev
atrLow
else
if not na(trend ) and trend != 1
down := na(up ) ? up : up
arrowDown := down + atr2
arrowDown
else
down := na(down ) ? minHighPrice : math.min(minHighPrice, down )
down
atrHigh := down + dev
atrLow := down - dev
atrLow
ht = trend == 0 ? up : down
var color buyColor = color.purple
var color sellColor = color.red
htColor = trend == 0 ? buyColor : sellColor
htPlot = plot(ht, title='Ashish indicator', linewidth=2, color=htColor)
atrHighPlot = plot(showChannels ? atrHigh : na, title='ATR High', style=plot.style_circles, color=sellColor)
atrLowPlot = plot(showChannels ? atrLow : na, title='ATR Low', style=plot.style_circles, color=buyColor)
fill(htPlot, atrHighPlot, title='ATR High Ribbon', color=sellColor, transp=90)
fill(htPlot, atrLowPlot, title='ATR Low Ribbon', color=buyColor, transp=90)
buySignal = not na(arrowUp) and trend == 0 and trend == 1
sellSignal = not na(arrowDown) and trend == 1 and trend == 0
plotshape(showArrows and buySignal ? atrLow : na, title='Arrow Up', style=shape.triangleup, location=location.belowbar, size=size.tiny, color=buyColor)
plotshape(showArrows and sellSignal ? atrHigh : na, title='Arrow Down', style=shape.triangledown, location=location.abovebar, size=size.tiny, color=sellColor)
alertcondition(buySignal, title='Alert: Ashish indicator Buy', message='Ashish indicator Buy')
alertcondition(sellSignal, title='Alert: Ashish indicator Sell', message='Ashish indicator Sell')

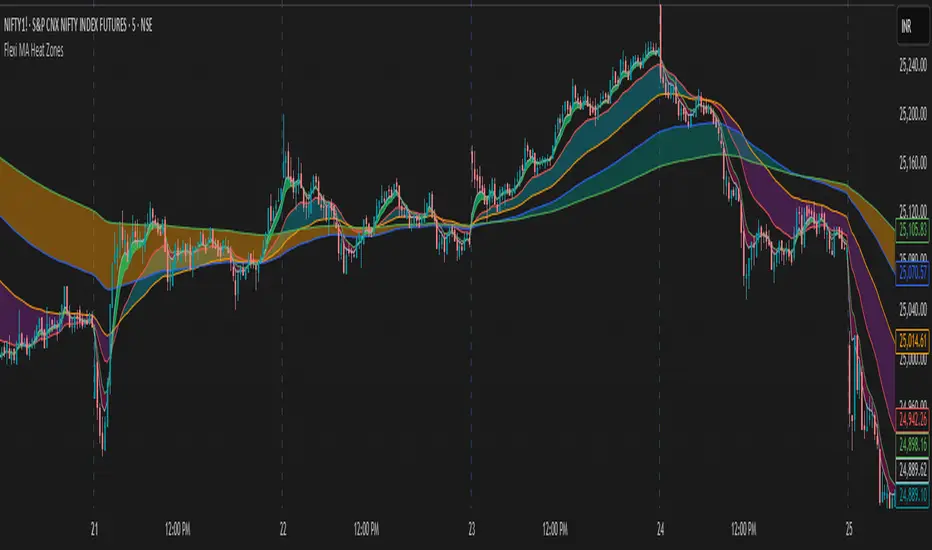
Flexi MA Heat ZonesOverview
Flexi MA Heat Zones is a powerful multi-timeframe visualization tool that helps traders easily identify trend strength, direction, and potential zones of confluence using multiple moving averages and dynamic heatmaps. The indicator plots up to three pairs of customizable moving averages, with color-coded heat zones to highlight bullish and bearish conditions at a glance.
Whether you're a trend follower, mean-reversion trader, or looking for visual confirmation zones, this indicator is designed to offer deep insights with high customizability.
⚙️ Key Features
🔄 Supports multiple MA types: Choose from EMA, SMA, WMA, VWMA to suit your strategy.
🎯 Six moving averages: Three MA pairs (MA1-MA2, MA3-MA4, MA5-MA6), each with independent lengths and colors.
🌈 Heatmap Zones: Dynamic fills between MA pairs, changing color based on bullish or bearish alignment.
👁️🗨️ Full customization: Enable/disable any MA pair and its heatmap zone from the settings.
🪞 Transparency controls: Adjust the visibility of heat zones for clarity or stylistic preference.
🎨 Color-coded for clarity: Bullish and bearish colors for each heat zone pair, fully user-configurable.
🧩 Efficient layout: Smart use of grouped inputs for easier configuration and visibility management.
📈 How to Use
Use the MA1–MA2 and MA3–MA4 zones for longer-term trend tracking and confluence analysis.
Use the faster MA5–MA6 zone for short-term micro-trend identification or scalping.
When a faster MA is above the slower one within a pair, the fill turns bullish (user-defined color).
When the faster MA is below the slower one, the fill turns bearish.
Combine with price action or other indicators for entry/exit confirmation.
🧠 Pro Tips
For trend-following strategies, consider using EMA or WMA types.
For mean-reversion or support/resistance zones, SMA and VWMA may offer better zone clarity.
Overlay with RSI, MACD, or custom entry signals for higher confidence setups.
Use different heatmap transparencies to visually separate overlapping MA zones.
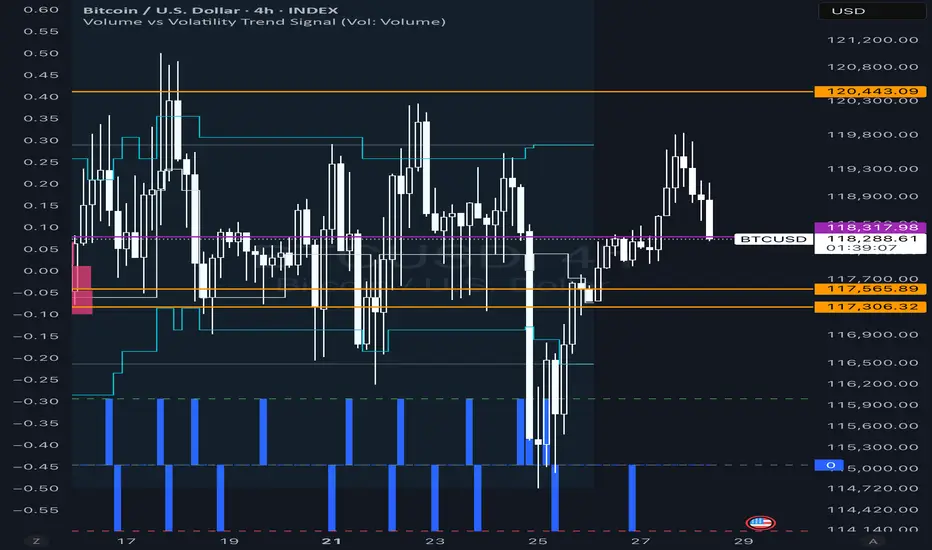
Volume vs Volatility Trend Signal1 is increasing volume decreasing volatility -1 is decreasing volume increasing volatility 0 is neither
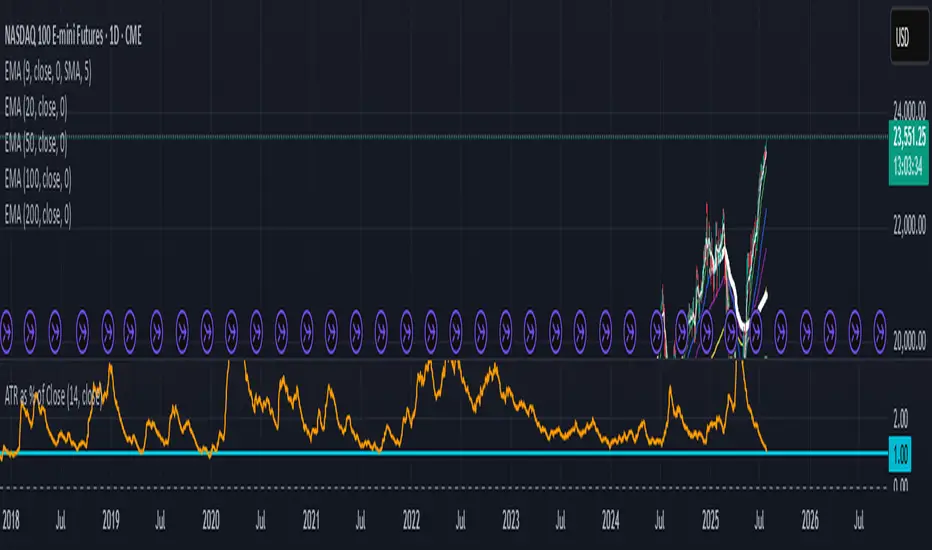
ATR as % of CloseATR 14day period in % terms
the Normal ATR indicator by TV helps but this gives a clear idea as to the range in percentage terms as and when market rises to newer and newer highs
better than an absolute value
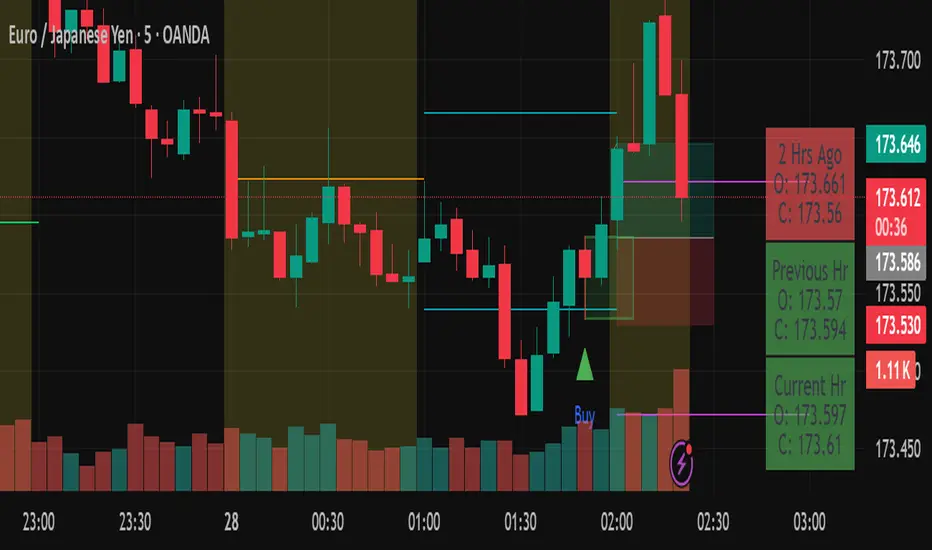
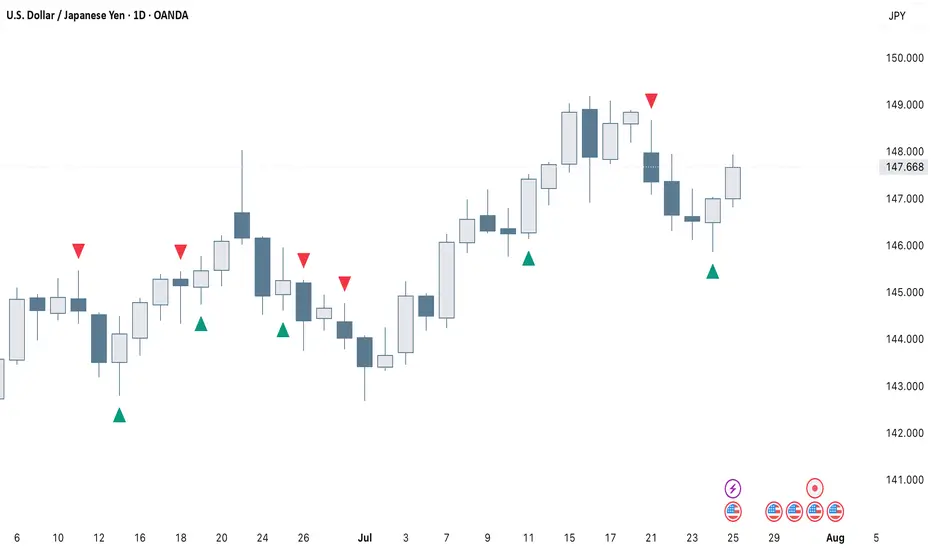
PHL Sweep Signals(1 Hour)PHL Sweep Signals (Full History)
This indicator is designed to identify high-probability reversal setups by detecting liquidity sweeps of the previous standard hour's high and low (PHL). It provides clear, actionable signals complete with visual aids and a data table to keep you in tune with the higher-timeframe context.
Key Features
Previous Hour Levels: Automatically draws the high and low of the previous standard hour as key reference lines for the current trading hour. The line colors rotate to provide a clear visual separation.
Bearish Sweep Signal: Identifies a specific bearish pattern: a green (bullish) candle that wicks above the previous hour's high but fails to hold, with its body remaining entirely below the line.
Bullish Sweep Signal: Identifies the opposite bullish pattern: a red (bearish) candle that wicks below the previous hour's low but is absorbed, with its body remaining entirely above the line.
Clear Visual Signals: When a signal is confirmed, the indicator provides a multi-faceted alert:
Plots a "Buy" or "Sell" arrow on the chart.
Draws a colored box around the signal candle for easy identification.
Displays a label with the potential Stop Loss size (calculated from the size of the signal candle).
Informative Display Table: Includes a convenient table in the corner showing the Open and Close data for the last 3 hours, helping you stay aware of the broader market context without leaving your chart.
Built-in Alerts: Triggers an alert for every confirmed Buy and Sell signal so you never miss a potential setup.
How to Use
This indicator helps you spot potential exhaustion and reversals at key hourly levels.
A "Sell" signal suggests a failed breakout to the upside, indicating potential weakness and a possible entry for shorts.
A "Buy" signal suggests a failed breakdown to the downside, indicating potential strength and a possible entry for longs.
As with any tool, these signals are most powerful when used as part of a comprehensive trading strategy and combined with your own analysis for confirmation.
Optimal Settings:
Timeframe: 5-Minute
Time Zone: UTC-4 (New York Time)
-ratheeshinv
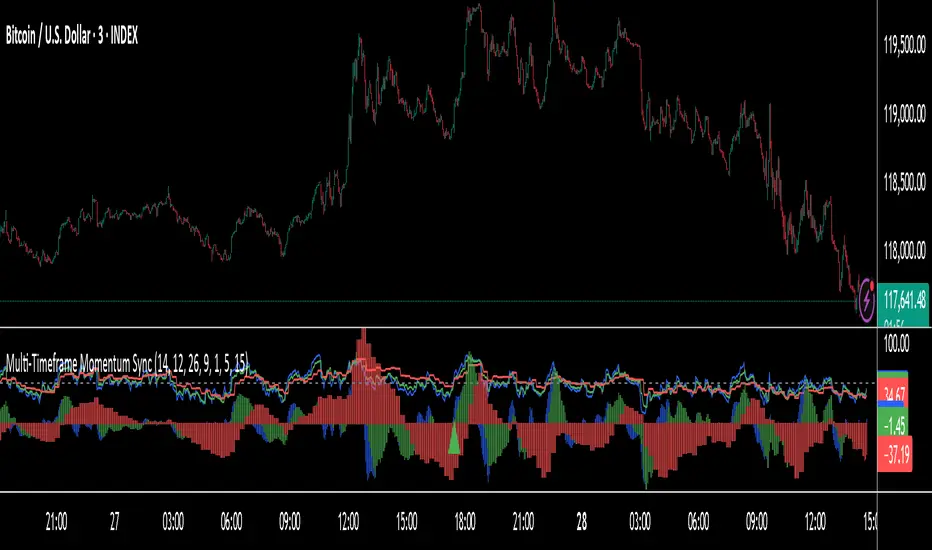
多维度市场分析指标 v2 (区间框选)使用大周期MACD的能量柱作为背景用于识别趋势并且搭配上伦敦和纽约交易session
we are using a high time frame macd momentum as chart background to analysis a trend and using london and newyork session to help you trade better


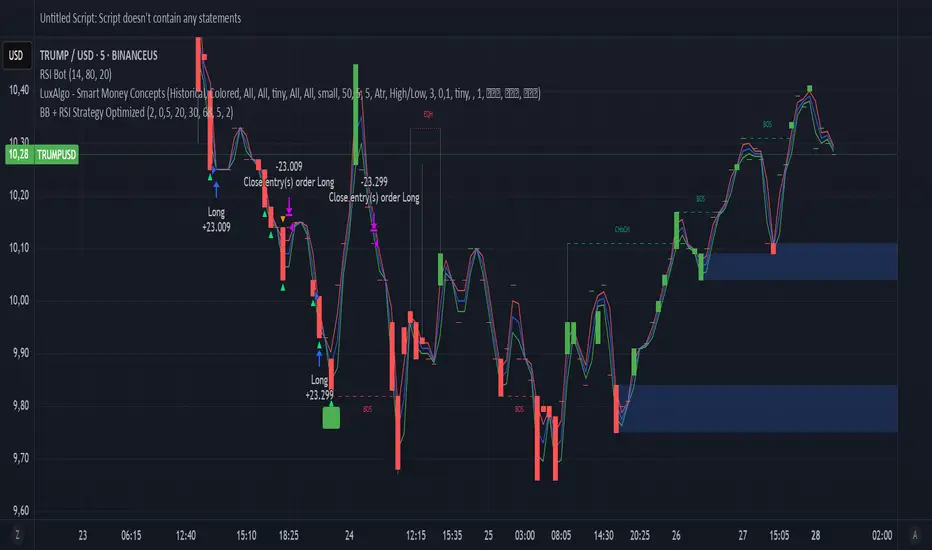
BB + RSI Strategy Optimized✅ Pine Script Version 5
✅ Complete Strategy: Long + Short
✅ Automatic Entry and Exit
✅ Visual Signals: Buy/Sell, Short/Cover
✅ Trailing Take Profit
✅ Progressive
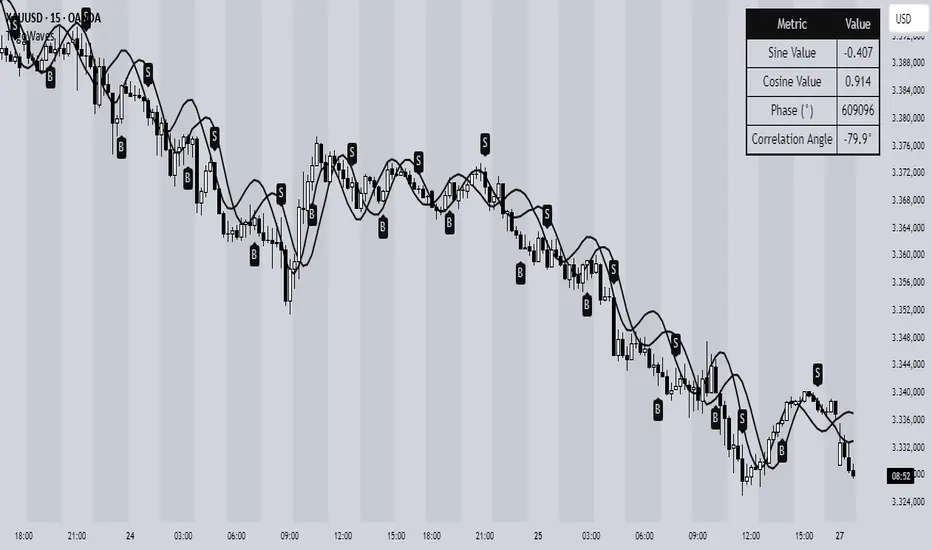
Trigonometric Sine Cosine WavesTrigonometric Sine Cosine Waves - Advanced Cyclical Analysis
Overview
This innovative indicator applies trigonometric mathematics to market analysis, generating dynamic sine and cosine waves that adapt to price movement and volatility. Unlike traditional oscillators, this tool visualizes market cycles directly on your chart using mathematical wave functions.
How It Works
The indicator calculates phase-based waves using:
• Phase Calculation: 2π × bar_index / cycle_length
• Adaptive Amplitude: EMA-based price + ATR volatility scaling
• Sine Wave: avgPrice + volatility × sin(phase)
• Cosine Wave: avgPrice + volatility × cos(phase)
Key Features
Dynamic Wave Generation
• Sine Wave: Primary cycle indicator with smooth transitions
• Cosine Wave: Leading indicator (90° phase difference from sine)
• Adaptive Amplitude: Automatically adjusts to market volatility using ATR
Turning Point Detection
• Anti-Repaint Signals: Uses confirmed values from previous bars
• Sine Bottom: Potential buy zones when wave transitions from down to up
• Sine Top: Potential sell zones when wave transitions from up to down
Advanced Analytics
• Price Correlation Angle: Shows relationship between price movement and cycle
• Phase Information: Current position in the mathematical cycle
• Real-time Values: Live sine/cosine values and phase degrees
Visual Enhancement
• Background Coloring: Changes based on sine wave position (above/below zero)
• Clean Overlay: Waves plot directly on price chart without cluttering
Parameters
• Cycle Length (5-200): Controls wave frequency - shorter = more sensitive
• Amplitude Multiplier (0.1-5.0): Adjusts wave height relative to volatility
• Display Options : Toggle sine wave, cosine wave, and correlation table
• Show Correlation : Optional table showing mathematical values
Trading Applications
Cycle Analysis
• Identify market rhythm and timing
• Spot potential reversal zones
• Understand price-to-cycle relationships
Entry/Exit Timing
• Buy Signals: Sine wave bottoms (cycle lows)
• Sell Signals: Sine wave tops (cycle highs)
• Confirmation: Use with other indicators for higher probability setups
Market Structure
• Visualize underlying market cycles
• Identify periods of high/low cyclical activity
• Track phase relationships between price and mathematical cycles
Pro Tips
1. Longer cycles (50-100) work better for swing trading
2. Shorter cycles (10-20) suitable for scalping
3. Combine with volume for stronger signal confirmation
4. Monitor correlation angle for trend strength assessment
5. Use background color as quick visual cycle reference
Important Notes
• Signals are anti-repaint using confirmed previous bar values
• Best used in trending or cyclical markets
• Consider market context when interpreting signals
• Mathematical approach - not based on traditional TA concepts
Alerts Included
• Sine Wave Buy Signal: Triggered on wave bottom detection
• Sine Wave Sell Signal: Triggered on wave top detection
Technical Requirements
• Pine Script v6
• Works on all timeframes
• No external dependencies
• Optimized for performance
This is a free, open-source indicator. Feel free to modify and improve according to your trading needs!
Educational Value: Perfect for understanding how mathematical functions can be applied to market analysis and cycle detection.
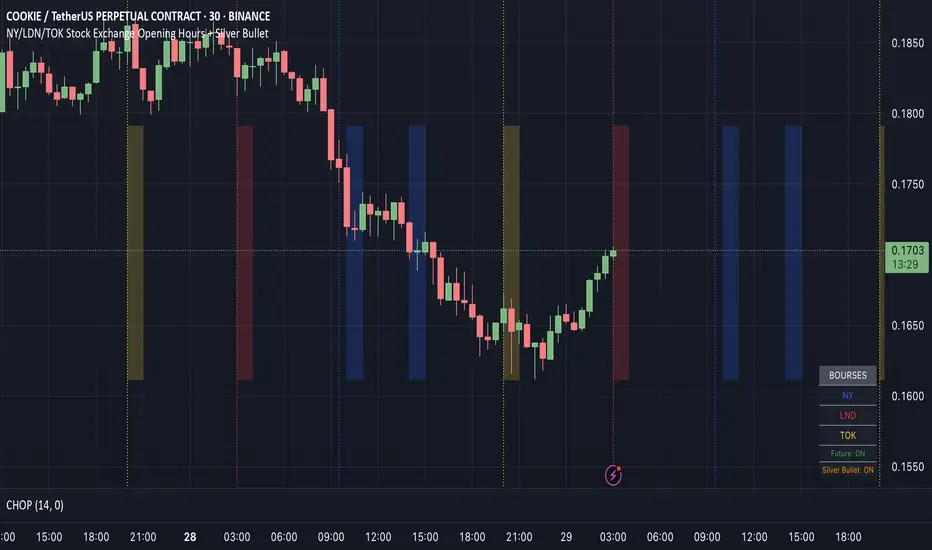
NY/LDN/TOK Stock Exchange Opening HoursThis indicator displays vertical dotted lines marking the exact opening times of the three major global stock exchanges: New York (NYSE), London (LSE), and Tokyo (TSE). Perfect for traders who need to track market opening sessions across different time zones.
Features:
New York Stock Exchange (NYSE): 9:30 AM EST/EDT
London Stock Exchange (LSE): 8:00 AM GMT/BST
Tokyo Stock Exchange (TSE): 9:00 AM JST
Key Highlights:
✓ Automatic daylight saving time adjustments for NY and London
✓ Individual color customization for each market
✓ Toggle on/off functionality for each exchange
✓ Clean vertical dotted lines (1-pixel width) that extend across the entire chart
✓ Interactive legend in bottom-right corner showing active markets
✓ Weekdays only (Monday-Friday) - no weekend lines
✓ Uses official local time zones for accurate timing
Customizable Settings:
Enable/disable individual exchanges
Custom color selection for each market line
Dynamic legend that shows only enabled markets
Time Zone Handling:
The indicator automatically handles daylight saving time transitions using official time zones:
America/New_York (EST/EDT)
Europe/London (GMT/BST)
Asia/Tokyo (JST - no DST)
Perfect for:
Multi-market traders
Session overlap analysis
Global market timing coordination
Institutional trading schedules
Simply add to your chart and customize colors/visibility in the indicator settings. The legend will automatically update to show your active markets in their respective colors.
30M Scalping Strategy with Debug LogsWhat’s changed
Spot‑only: all short logic removed—only long entries and exits are generated.
Logging: uses log.info() to send entry/exit details (timestamp, price, ATR, RSI) to the Pine Logs console.
Clean & concise: core scalp logic (EMAs, RSI, MACD, volume, ATR SL/TP) remains intact.

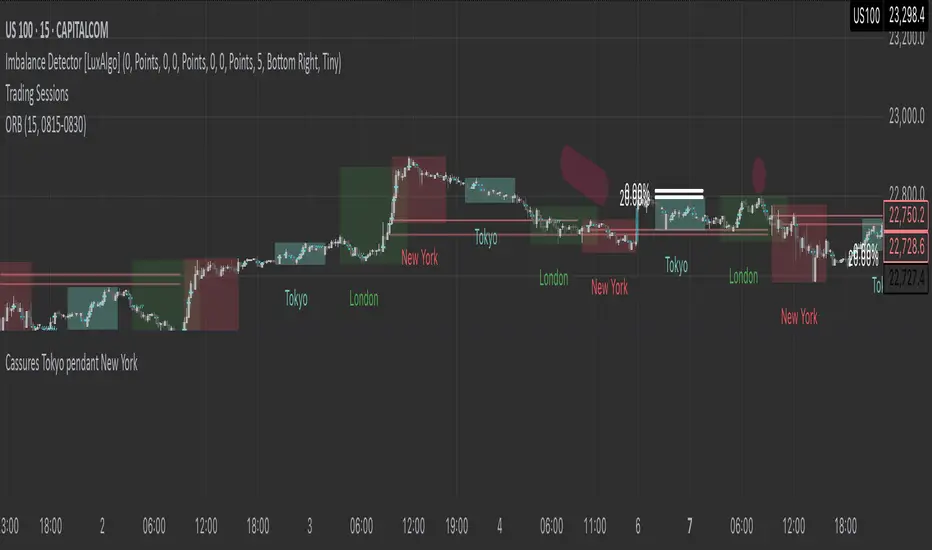
Cassures Tokyo pendant New York//@version=5
indicator("Cassures Tokyo pendant New York", overlay=true)
// Paramètres de sessions
// Début et fin de Tokyo (00h00 - 08h00 GMT)
tokyo_start = timestamp("GMT+0", year(timenow), month(timenow), dayofmonth(timenow), 0, 0)
tokyo_end = timestamp("GMT+0", year(timenow), month(timenow), dayofmonth(timenow), 8, 0)
// Début et fin de New York (13h30 - 22h00 GMT)
ny_start = timestamp("GMT+0", year(timenow), month(timenow), dayofmonth(timenow), 13, 30)
ny_end = timestamp("GMT+0", year(timenow), month(timenow), dayofmonth(timenow), 22, 0)
// Initialisation des variables persistantes
var float tokyo_high = na
var float tokyo_low = na
var bool ny_started = false
var bool high_broken = false
var bool low_broken = false
// Reset des valeurs à chaque nouvelle journée
if (time >= tokyo_start and time < tokyo_end)
tokyo_high := na
tokyo_low := na
high_broken := false
low_broken := false
ny_started := false
// Détection du high/low Tokyo
if (time >= tokyo_start and time < tokyo_end)
tokyo_high := na(tokyo_high) ? high : math.max(tokyo_high, high)
tokyo_low := na(tokyo_low) ? low : math.min(tokyo_low, low)
// Détection des cassures pendant New York
if (time >= ny_start and time < ny_end)
ny_started := true
if not na(tokyo_high) and high > tokyo_high
high_broken := true
if not na(tokyo_low) and low < tokyo_low
low_broken := true
// Affichage des niveaux Tokyo
plot(tokyo_high, "Tokyo High", color=color.green, linewidth=1, style=plot.style_linebr)
plot(tokyo_low, "Tokyo Low", color=color.red, linewidth=1, style=plot.style_linebr)
// Surlignage visuel en session NY selon cassure
bgcolor(ny_started and high_broken and low_broken ? color.orange : ny_started and high_broken ? color.new(color.green, 80) : ny_started and low_broken ? color.new(color.red, 80) : na)
// Affichage texte sur le graphique
label_id = label.new(x=bar_index, y=high, text="", style=label.style_label_down, textcolor=color.white, size=size.tiny, color=color.gray)
if (ny_started)
label_text = high_broken and low_broken ? "Cassure HIGH & LOW Tokyo" :
high_broken ? "Cassure HIGH Tokyo" :
low_broken ? "Cassure LOW Tokyo" :
"Aucune cassure"
label.set_text(label_id, label_text)
label.set_xy(label_id, bar_index, high + syminfo.mintick * 10)
FTM → SONIC Combined Candlesticksthis script combines the chart of FTM and SONIC to get a better overview of the entire price action

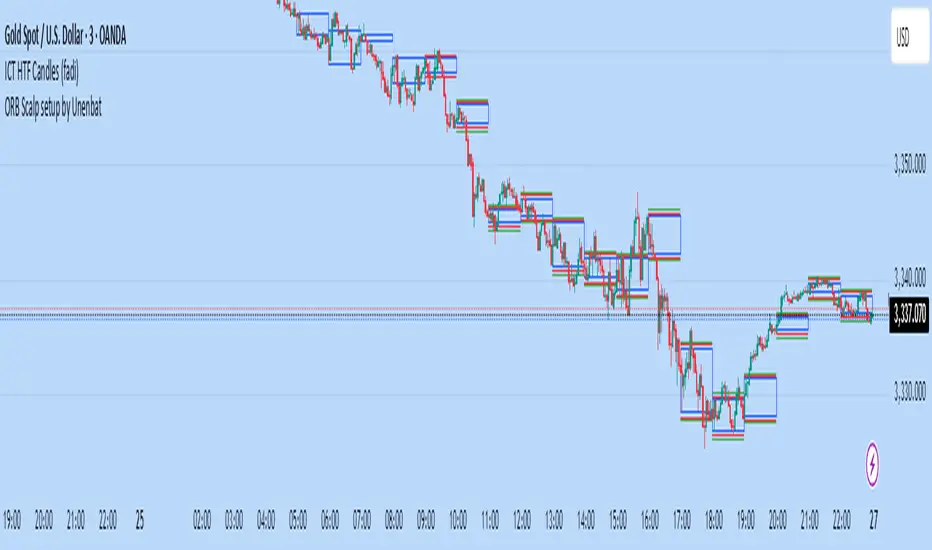
ORB Scalp setup by UnenbatDescription
ORB Scalp Setup by Unenbat is a precise breakout scalping tool that identifies short-term price ranges at the transition between hourly sessions.
📌 Core Features:
Draws a dynamic box using the price range from the last 3 minutes of the previous hour and the first 3 minutes of the new hour (total 5m59s range).
Automatically plots:
Box representing the selected range.
Opening Price Line at the start of the hour.
TP Lines (Take Profit) above and below the box at customizable distances.
BE Lines (Break-Even) above and below the box at customizable distances.
Box and line lengths are user-defined (default: 60 minutes).
Works across historical data (up to the last 100 days).
Fully customizable visuals (colors, offsets, visibility toggles).
🎯 How to Use:
Ideal for scalp traders using breakout strategies.
Enter trades when price breaks above or below the box range.
Use TP and BE lines as clear reference levels for exits or trailing stop logic.
⚙️ Custom Settings:
Enable/disable each component (box, open line, TP line, BE line).
Set your own offset in pips for TP/BE lines.
Adjust the box duration to match your trading style.
Modify start and end times of the range as needed.
Hidden Liquidity Shift DetectorPurpose
The Hidden Liquidity Shift Detector identifies candles that indicate potential hidden accumulation or distribution activity based on volume and price action behavior. These setups often represent institutional absorption of liquidity ahead of larger moves.
How It Works
The script detects candles with the following characteristics:
Small real body relative to the total candle range
A strong wick (upper or lower) indicating rejection
Volume significantly higher than the recent average
It flags:
Hidden Selling (Distribution) when a bearish candle has a long upper wick and high volume
Hidden Buying (Accumulation) when a bullish candle has a long lower wick and high volume
These candles are often missed by traditional indicators but may precede significant reversals or breakouts.
Features
Automatic detection of absorption-style candles
Volume spike filtering based on configurable multiplier
Wick and body ratio thresholds to fine-tune signal quality
Non-intrusive signal markers (colored circles)
Real-time alerts for hidden buying/selling signals
Usage Tips
Use on 15m to 4H charts for intraday detection, or Daily for swing setups
Combine with support/resistance or volume profile zones for higher conviction
Clusters of signals in the same area increase reversal probability
Can be used alongside Wyckoff-style logic or smart money concepts

Clarix Smart FlipPurpose
This tool identifies high-probability intraday reversals by detecting when price flips through the daily open after strong early-session commitment.
How It Works
A valid flip occurs when:
The previous daily candle is bullish or bearish
The first hour today continues in the same direction
Then, the price flips back through the daily open with a minimum break threshold (user-defined)
This setup is designed to catch liquidity grabs or fakeouts near the daily open, where early buyers or sellers get trapped after showing commitment
Signal Logic
Buy Flip
Previous day bearish → first hour bearish → price flips above open
Sell Flip
Previous day bullish → first hour bullish → price flips below open
Features
Configurable flip threshold in percentage
Signals only activate after the first hour ends
Daily open line displayed on chart
Simple triangle markers with no visual clutter
Alerts ready to use for automation or notifications
Usage Tips
Use "Once Per Bar" alert mode to get notified immediately when the flip happens
Works best in active markets like FX, indices, or crypto
Adjust threshold based on asset volatility
Suggested stop loss: use the previous daily high for sell flips or the previous daily low for buy flips
Suggested take profit: secure at least 30 pips to aim for a 1:3 risk-to-reward ratio on average
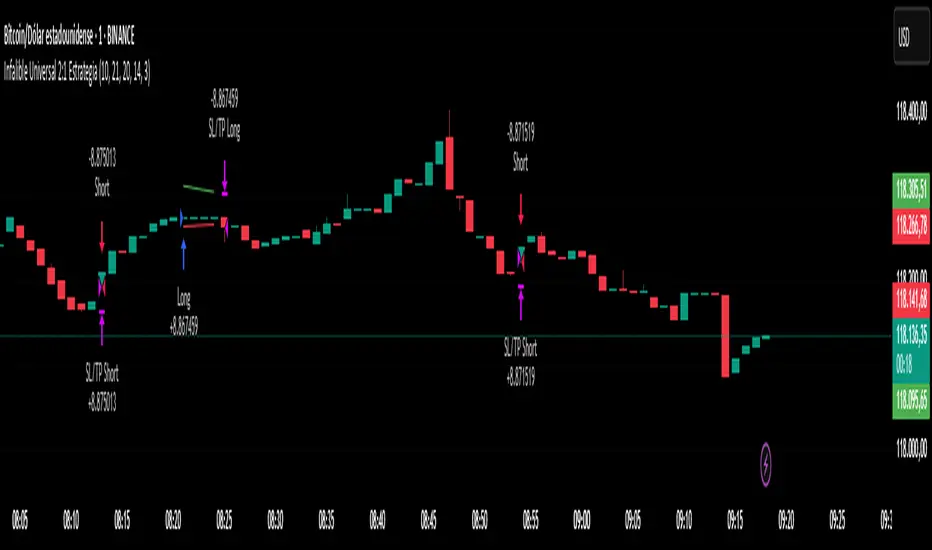
Infalible Universal 2:1 Estrategia🔹 "Infalible Universal 2:1 Strategy" – Optimized for All Markets and Timeframes
This strategy combines proven technical indicators with a dynamic risk management model to deliver consistent and optimized entries, especially on lower timeframes like 5 and 15 minutes.
Core Components:
📈 Entry Signals:
Trades are triggered when a fast Simple Moving Average (SMA) crosses over or under a slow SMA, with confirmation from a strong trend (ADX filter).
🎯 Dynamic Take Profit and Stop Loss:
Positions are exited based on a 2:1 Risk/Reward ratio, calculated using the current Average True Range (ATR). This allows the system to adapt to market volatility and remain effective across any asset.
🧱 Visual SL/TP Zones:
Colored rectangles highlight the Stop Loss (red) and Take Profit (green) areas on the chart, helping traders clearly visualize risk and reward at every entry.
🧠 Clean and Effective Logic:
No repainting. No lagging signals. Fully backtestable. Alerts included for long and short entries.
Whether you're trading forex, crypto, indices, or stocks, this universal strategy adapts to market behavior and focuses on consistent execution through disciplined risk management.
Asian & London Session Two-Color Candlesthis script use to find the asian and london session with different candle colours.

CRT Impulse Detector - Bull & BearHelps Identify Impulse Candles, only triggering those that break recent swings.