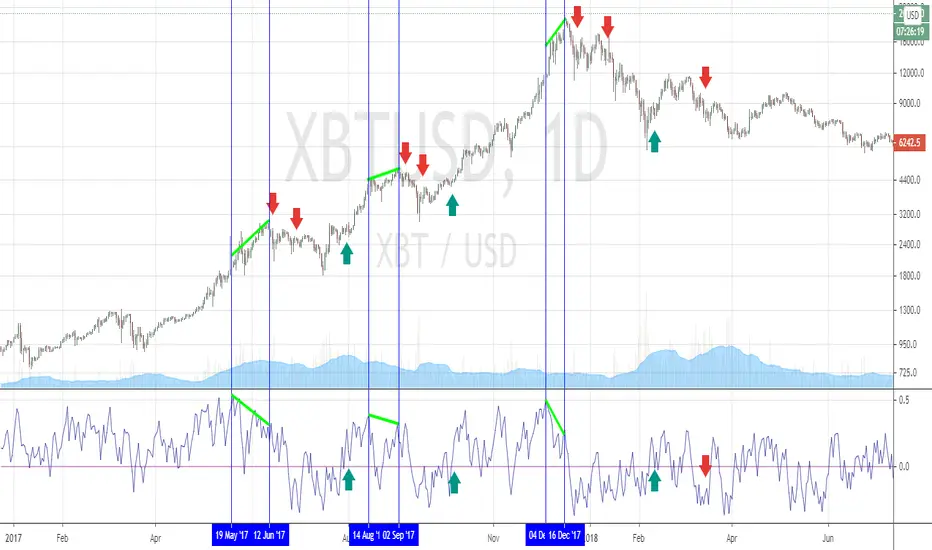
Godmode 4.0.2 [Supply/Demand]First off, a huge thank you to the following people:
LEGION:
LazyBear: tradingview.sweetlogin.com
xSilas: tradingview.sweetlogin.com
Ni6HTH4awK: tradingview.sweetlogin.com
sco77m4r7and:
SNOW_CITY: tradingview.sweetlogin.com
oh92: tradingview.sweetlogin.com
alexgrover: tradingview.sweetlogin.com
cI8DH: tradingview.sweetlogin.com
DonovanWall: tradingview.sweetlogin.com
shtcoinr: tradingview.sweetlogin.com
This is the third iteration of Godmode. This time I borrowed the method used by shtcoinr to render supply/demand, resistance and support zones. The idea here is to input the appropriate benchmark tickerid to the asset class you're trading and to paint zones according to the price activity of the selected tickerid. This works very well trying to paint meaningful zones against noisy stocks, currencies, commodities etc. Use a correlation coefficient to determine the best benchmark for your asset class.
Want to Learn?
If you'd like the opportunity to learn Pine but you have difficulty finding resources to guide you, take a look at this rudimentary list: docs.google.com
The list will be updated in the future as more people share the resources that have helped, or continue to help, them. Follow me on Twitter to keep up-to-date with the growing list of resources.
Suggestions or Questions?
Don't even kinda hesitate to forward them to me. My (metaphorical) door is always open.
Demand Zone
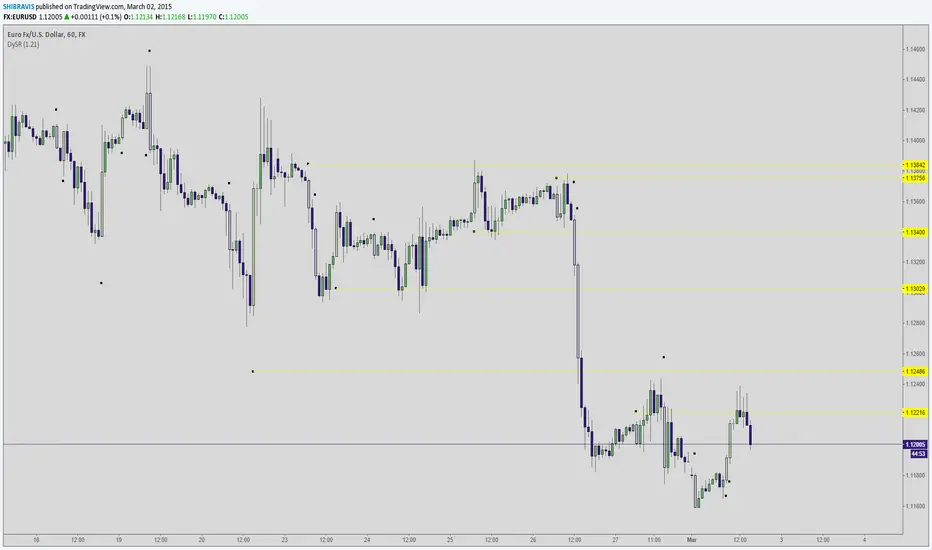
Dynamic SUPRES Multi Timeframe UpdateDynamic SUPRES can be interpreted in different ways. Each square marks an area of congestion that could serve as support and resistance.
FLASH UPDATE: Now is possible to choose the timeframe and the bars color on/off.
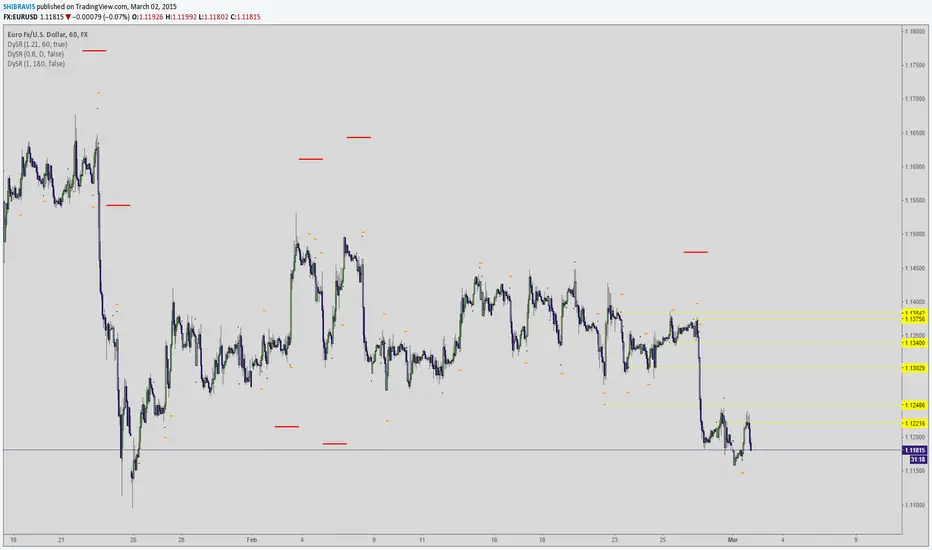
Dynamic SUPRESDynamic SUPRES can be interpreted in different ways. Each square marks an area of congestion that could serve as support and resistance.