seed_data_library_1Library "seed_data_library_1"
setCombinedMap1A(m)
Parameters:
m (map)
setCombinedMap1B(m)
Parameters:
m (map)
getMarketCap(ticker)
Parameters:
ticker (string)
getRSRating(ticker)
Parameters:
ticker (string)
getIndustry(ticker)
Parameters:
ticker (string)
getSector(ticker)
Parameters:
ticker (string)
Display
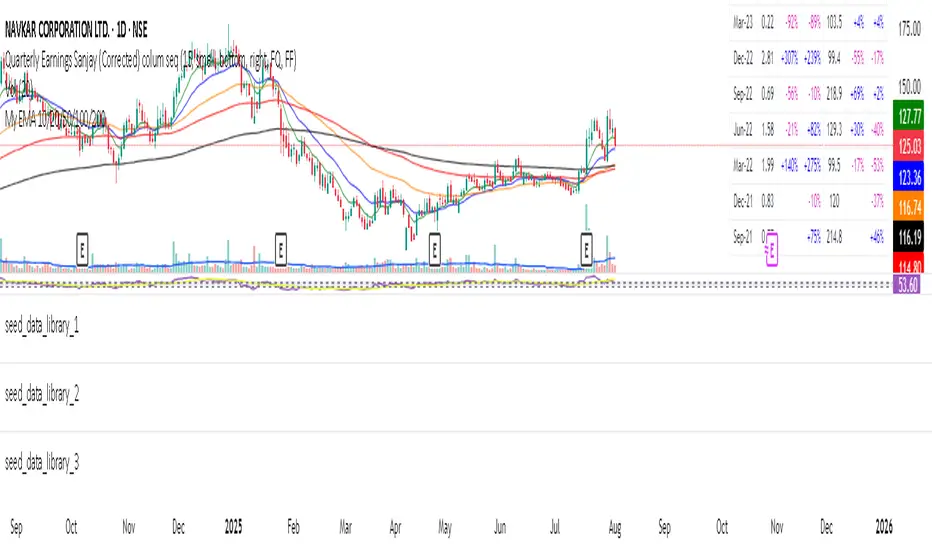
BarUtils: Get Bar Index from DateLibrary "BarUtils"
getBarIndexFromDate(targetTimestamp)
Parameters:
targetTimestamp (int)
**Description**:
This utility provides a reliable way to calculate the `bar_index` of a specific calendar date, regardless of chart resolution. It's especially useful for anchoring scripts to historical events, labeling macroeconomic moments, or marking custom time-based signals that must remain consistent across timeframes.
Unlike hardcoded `bar_index - N` approaches, this function dynamically estimates the number of bars between a given `timestamp()` and the current bar using the actual time-per-bar (`time - time `). It works correctly on intraday, daily, weekly, and monthly charts.
### 💡 **Function Provided**:
import TradeTitan120/BarUtils/1
* `getBarIndexFromDate(int targetTimestamp)`
→ Returns the estimated `bar_index` that aligns with a given timestamp
### ✅ **Use Cases**:
* Marking past events like FOMC meetings, market crashes, or personal signals
* Backtesting entry/exit conditions from specific calendar dates
* Anchoring visual elements (shapes, lines, labels) across resolutions
This tool is simple, fast, and built for accuracy. Use it to enhance multi-timeframe compatibility in any script.
hudDisplay_v1Library "hudDisplay_v1"
f_getPosition(loc)
Parameters:
loc (string)
f_getTableSize(layout, itemCount)
Parameters:
layout (string)
itemCount (int)
f_getCellPosition(layout, index)
Parameters:
layout (string)
index (int)
f_drawHUD(show, loc, layout, content, textColor, bgColor)
Parameters:
show (bool)
loc (string)
layout (string)
content (array)
textColor (color)
bgColor (color)
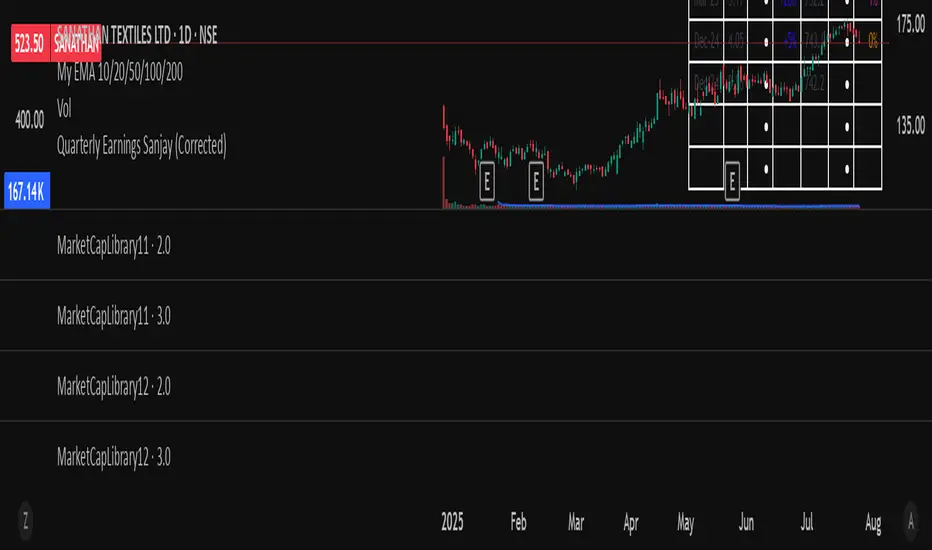
MarketCapLibrary12Library "MarketCapLibrary12"
setMarketCapMap(m)
Parameters:
m (map)
getMarketCap(ticker)
Parameters:
ticker (string)
TextLibrary "Text"
library to format text in different fonts or cases plus a sort function.
🔸 Credits and Usage
This library is inspired by the work of three authors (in chronological order of publication date):
Unicode font function - JD - Duyck
UnicodeReplacementFunction - wlhm
font - kaigouthro
🔹 Fonts
Besides extra added font options, the toFont(fromText, font) method uses a different technique. On the first runtime bar (whether it is barstate.isfirst , barstate.islast , or between) regular letters and numbers and mapped with the chosen font. After this, each character is replaced using the build-in key - value pair map function .
Also an enum Efont is included.
Note: Some fonts are not complete, for example there isn't a replacement for every character in Superscript/Subscript.
Example of usage (besides the included table example):
import fikira/Text/1 as t
i_font = input.enum(t.Efont.Blocks)
if barstate.islast
sentence = "this sentence contains words"
label.new(bar_index, 0, t.toFont(fromText = sentence, font = str.tostring(i_font)), style=label.style_label_lower_right)
label.new(bar_index, 0, t.toFont(fromText = sentence, font = "Circled" ), style=label.style_label_lower_left )
label.new(bar_index, 0, t.toFont(fromText = sentence, font = "Wiggly" ), style=label.style_label_upper_right)
label.new(bar_index, 0, t.toFont(fromText = sentence, font = "Upside Latin" ), style=label.style_label_upper_left )
🔹 Cases
The script includes a toCase(fromText, case) method to transform text into snake_case, UPPER SNAKE_CASE, kebab-case, camelCase or PascalCase, as well as an enum Ecase .
Example of usage (besides the included table example):
import fikira/Text/1 as t
i_case = input.enum(t.Ecase.camel)
if barstate.islast
sentence = "this sentence contains words"
label.new(bar_index, 0, t.toCase(fromText = sentence, case = str.tostring(i_case)), style=label.style_label_lower_right)
label.new(bar_index, 0, t.toCase(fromText = sentence, case = "snake_case" ), style=label.style_label_lower_left )
label.new(bar_index, 0, t.toCase(fromText = sentence, case = "PascalCase" ), style=label.style_label_upper_right)
label.new(bar_index, 0, t.toCase(fromText = sentence, case = "SNAKE_CASE" ), style=label.style_label_upper_left )
🔹 Sort
The sort(strings, order, sortByUnicodeDecimalNumbers) method returns a sorted array of strings.
strings: array of strings, for example words = array.from("Aword", "beyond", "Space", "salt", "pepper", "swing", "someThing", "otherThing", "12345", "_firstWord")
order: "asc" / "desc" (ascending / descending)
sortByUnicodeDecimalNumbers: true/false; default = false
_____
• sortByUnicodeDecimalNumbers: every Unicode character is linked to a Unicode Decimal number ( wikipedia.org/wiki/List_of_Unicode_characters ), for example:
1 49
2 50
3 51
...
A 65
B 66
...
S 83
...
_ 95
` 96
a 97
b 98
...
o 111
p 112
q 113
r 114
s 115
...
This means, if we sort without adjusting ( sortByUnicodeDecimalNumbers = true ), in ascending order, the letter b (98 - small) would be after S (83 - Capital).
By disabling sortByUnicodeDecimalNumbers , Capital letters are intermediate transformed to str.lower() after which the Unicode Decimal number is retrieved from the small number instead of the capital number. For example S (83) -> s (115), after which the number 115 is used to sort instead of 83.
Example of usage (besides the included table example):
import fikira/Text/1 as t
if barstate.islast
aWords = array.from("Aword", "beyond", "Space", "salt", "pepper", "swing", "someThing", "otherThing", "12345", "_firstWord")
label.new(bar_index, 0, str.tostring(t.sort(strings= aWords, order = 'asc' , sortByUnicodeDecimalNumbers = false)), style=label.style_label_lower_right)
label.new(bar_index, 0, str.tostring(t.sort(strings= aWords, order = 'desc', sortByUnicodeDecimalNumbers = false)), style=label.style_label_lower_left )
label.new(bar_index, 0, str.tostring(t.sort(strings= aWords, order = 'asc' , sortByUnicodeDecimalNumbers = true )), style=label.style_label_upper_right)
label.new(bar_index, 0, str.tostring(t.sort(strings= aWords, order = 'desc', sortByUnicodeDecimalNumbers = true )), style=label.style_label_upper_left )
🔸 Methods/functions
method toFont(fromText, font)
toFont : Transforms text into the selected font
Namespace types: series string, simple string, input string, const string
Parameters:
fromText (string)
font (string)
Returns: `fromText` transformed to desired `font`
method toCase(fromText, case)
toCase : formats text to snake_case, UPPER SNAKE_CASE, kebab-case, camelCase or PascalCase
Namespace types: series string, simple string, input string, const string
Parameters:
fromText (string)
case (string)
Returns: `fromText` formatted to desired `case`
method sort(strings, order, sortByUnicodeDecimalNumbers)
sort : sorts an array of strings, ascending/descending and by Unicode Decimal numbers or not.
Namespace types: array
Parameters:
strings (array)
order (string)
sortByUnicodeDecimalNumbers (bool)
Returns: Sorted array of strings

MarketCapLibrary2Library "MarketCapLibrary2"
setMarketCapMap(m)
Parameters:
m (map)
getMarketCap(ticker)
Parameters:
ticker (string)
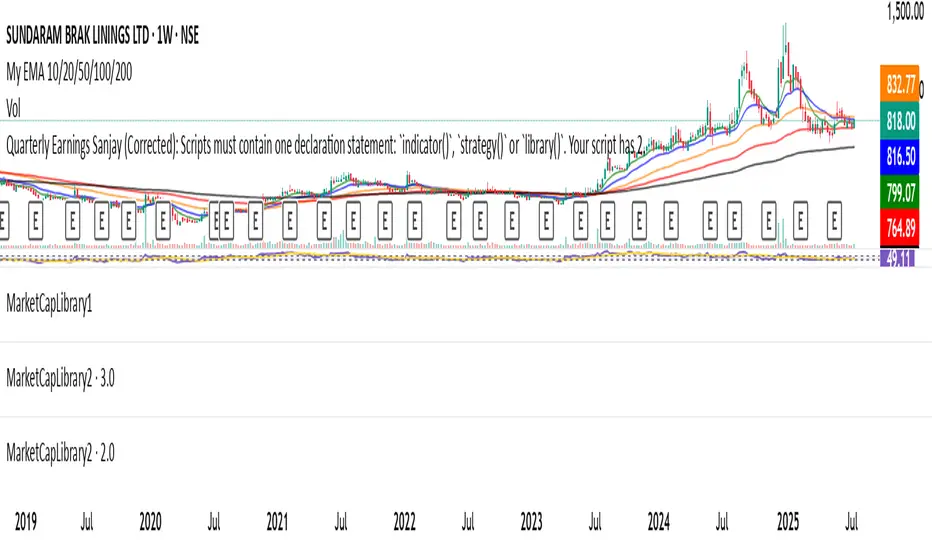
MarketCapLibrary1Library "MarketCapLibrary1"
setMarketCapMap(m)
Parameters:
m (map)
getMarketCap(ticker)
Parameters:
ticker (string)

SIC_TICKER_DATAThe SIC Ticker Data is an advanced and efficient library for ticker-to-industry classification and sector analysis. Built with enterprise-grade performance optimizations, this library provides instant access to SIC codes, industry classifications, and peer company data for comprehensive market analysis.
Perfect for: Sector rotation strategies, peer analysis, portfolio diversification, market screening, and financial research tools.
The simple idea behind this library is to pull any data related to SIC number of any US stock market ticker provided by SEC in order to see the industry and also see the exact competitors of the ticker.
The library stores 3 types of data: SIC number, Ticker, and Industry name. What makes it very useful is that you can pull any one of this data using the other. For example, if you would like to know which tickers are inside a certain SIC, or what's the SIC number of a specific ticker, or even which tickers are inside a certain industry, you can use this library to pull this data. The idea for data inside this library is to be accessible in any direction possible as long as they're related to each other.
We've also published a simple indicator that uses this library in order to demonstrate the inner workings of this library.
The library stores thousands of tickers and their relevant SIC code and industry for your use and is constantly updated with new data when available. This is a large library but it is optimized to run as fast as possible. The previous unpublished versions would take over 40 seconds to load any data but the final public version here loads the data in less than 5 seconds.
🔍 Primary Lookup Functions
createDataStore()
Initialize the library with all pre-loaded data.
store = data.createDataStore()
getSicByTicker(store, ticker)
Get SIC code for any ticker symbol.
sic = data.getSicByTicker(store, "AAPL") // Returns: "3571"
getIndustryByTicker(store, ticker)
Get industry classification for any ticker.
industry = data.getIndustryByTicker(store, "AAPL") // Returns: "Computer Hardware"
getTickersBySic(store, sic)
Get all companies in a specific SIC code.
software = data.getTickersBySic(store, "7372") // Returns: "MSFT,GOOGL,META,V,MA,CRM,ADBE,ORCL,NOW,INTU"
getTickersByIndustry(store, industry)
Get all companies in an industry.
retail = data.getTickersByIndustry(store, "Retail") // Returns: "AMZN,HD,WMT,TGT,COST,LOW"
📊 Array & Analysis Functions
getTickerArrayBySic(store, sic)
Get tickers as array for processing.
techArray = data.getTickerArrayBySic(store, "7372")
for i = 0 to array.size(techArray) - 1
ticker = array.get(techArray, i)
// Process each tech company
getTickerCountBySic(store, sic)
Count companies in a sector (ultra-fast).
pinescripttechCount = data.getTickerCountBySic(store, "7372") // Returns: 10
🎯 Utility Functions
tickerExists(store, ticker)
Check if ticker exists in database.
exists = data.tickerExists(store, "AAPL") // Returns: true
tickerInSic(store, ticker, sic)
Check if ticker belongs to specific sector.
isInTech = data.tickerInSic(store, "AAPL", "3571") // Returns: true
💡 Usage Examples
Example 1: Basic Ticker Lookup
// @version=6
import EdgeTerminal/SIC_TICKER_DATA/1 as data
indicator("Ticker Analysis", overlay=true)
store = data.createDataStore()
currentSic = data.getSicByTicker(store, syminfo.ticker)
currentIndustry = data.getIndustryByTicker(store, syminfo.ticker)
if barstate.islast and currentSic != "NOT_FOUND"
label.new(bar_index, high, syminfo.ticker + " SIC: " + currentSic + " Industry: " + currentIndustry)
Example 2: Sector Analysis
// @version=6
import EdgeTerminal/SIC_TICKER_DATA/1 as data
indicator("Sector Comparison", overlay=false)
store = data.createDataStore()
// Compare sector sizes
techCount = data.getTickerCountBySic(store, "7372") // Software
financeCount = data.getTickerCountBySic(store, "6199") // Finance
healthCount = data.getTickerCountBySic(store, "2834") // Pharmaceutical
plot(techCount, title="Tech Companies", color=color.blue)
plot(financeCount, title="Finance Companies", color=color.green)
plot(healthCount, title="Health Companies", color=color.red)
Example 3: Peer Analysis
// @version=6
import EdgeTerminal/SIC_TICKER_DATA/1 as data
indicator("Find Competitors", overlay=true)
store = data.createDataStore()
currentSic = data.getSicByTicker(store, syminfo.ticker)
if currentSic != "NOT_FOUND"
competitors = data.getTickersBySic(store, currentSic)
peerCount = data.getTickerCountBySic(store, currentSic)
if barstate.islast
label.new(bar_index, high, "Competitors (" + str.tostring(peerCount) + "): " + competitors)
Example 4: Portfolio Sector Allocation
// @version=6
import EdgeTerminal/SIC_TICKER_DATA/1 as data
indicator("Portfolio Analysis", overlay=false)
store = data.createDataStore()
// Analyze your portfolio's sector distribution
portfolioTickers = array.from("AAPL", "MSFT", "GOOGL", "JPM", "JNJ")
sectorCount = map.new()
for i = 0 to array.size(portfolioTickers) - 1
ticker = array.get(portfolioTickers, i)
industry = data.getIndustryByTicker(store, ticker)
if industry != "NOT_FOUND"
currentCount = map.get(sectorCount, industry)
newCount = na(currentCount) ? 1 : currentCount + 1
map.put(sectorCount, industry, newCount)
🔧 Advanced Feature
You can also bulk load data for large data sets like this:
// Pre-format your data as pipe-separated string
bulkData = "AAPL:3571:Computer Hardware|MSFT:7372:Software|GOOGL:7372:Software"
store = data.createDataStoreFromBulk(bulkData)

fibpointLibrary "fibpoint"
A library for generating Fibonacci retracement levels on a chart, including customizable lines, labels, and filled areas between levels. It provides functionality to plot Fibonacci levels based on given price points and bar indices, with options for custom levels and colors.
getFib(startPoint, endPoint, startIdx, endIdx, fibLevels, fibColors, tsp)
Calculates Fibonacci retracement levels between two price points and draws corresponding lines and labels on the chart.
Parameters:
startPoint (float) : The starting price point for the Fibonacci retracement.
endPoint (float) : The ending price point for the Fibonacci retracement.
startIdx (int) : The bar index where the Fibonacci retracement starts.
endIdx (int) : The bar index where the Fibonacci retracement ends.
fibLevels (array) : An optional array of custom Fibonacci levels (default is ).
fibColors (array) : An optional array of colors for each Fibonacci level (default is a predefined color array).
tsp (int) : The transparency level for the fill between Fibonacci levels (default is 90).
Returns: A tuple containing an array of fibItem objects (each with a line and label) and an array of linefill objects for the filled areas between levels.
fibItem
A custom type representing a Fibonacci level with its associated line and label.
Fields:
line (series line) : The line object drawn for the Fibonacci level.
label (series label) : The label object displaying the Fibonacci level value.

TimeframeInputToStringMaps a worded string for timeframes useful when working with the input.timeframe settings input. Use like timeframeToString("120") and the output will be "2 hour"

Color█ OVERVIEW
This library is a Pine Script® programming tool for advanced color processing. It provides a comprehensive set of functions for specifying and analyzing colors in various color spaces, mixing and manipulating colors, calculating custom gradients and schemes, detecting contrast, and converting colors to or from hexadecimal strings.
█ CONCEPTS
Color
Color refers to how we interpret light of different wavelengths in the visible spectrum . The colors we see from an object represent the light wavelengths that it reflects, emits, or transmits toward our eyes. Some colors, such as blue and red, correspond directly to parts of the spectrum. Others, such as magenta, arise from a combination of wavelengths to which our minds assign a single color.
The human interpretation of color lends itself to many uses in our world. In the context of financial data analysis, the effective use of color helps transform raw data into insights that users can understand at a glance. For example, colors can categorize series, signal market conditions and sessions, and emphasize patterns or relationships in data.
Color models and spaces
A color model is a general mathematical framework that describes colors using sets of numbers. A color space is an implementation of a specific color model that defines an exact range (gamut) of reproducible colors based on a set of primary colors , a reference white point , and sometimes additional parameters such as viewing conditions.
There are numerous different color spaces — each describing the characteristics of color in unique ways. Different spaces carry different advantages, depending on the application. Below, we provide a brief overview of the concepts underlying the color spaces supported by this library.
RGB
RGB is one of the most well-known color models. It represents color as an additive mixture of three primary colors — red, green, and blue lights — with various intensities. Each cone cell in the human eye responds more strongly to one of the three primaries, and the average person interprets the combination of these lights as a distinct color (e.g., pure red + pure green = yellow).
The sRGB color space is the most common RGB implementation. Developed by HP and Microsoft in the 1990s, sRGB provided a standardized baseline for representing color across CRT monitors of the era, which produced brightness levels that did not increase linearly with the input signal. To match displays and optimize brightness encoding for human sensitivity, sRGB applied a nonlinear transformation to linear RGB signals, often referred to as gamma correction . The result produced more visually pleasing outputs while maintaining a simple encoding. As such, sRGB quickly became a standard for digital color representation across devices and the web. To this day, it remains the default color space for most web-based content.
TradingView charts and Pine Script `color.*` built-ins process color data in sRGB. The red, green, and blue channels range from 0 to 255, where 0 represents no intensity, and 255 represents maximum intensity. Each combination of red, green, and blue values represents a distinct color, resulting in a total of 16,777,216 displayable colors.
CIE XYZ and xyY
The XYZ color space, developed by the International Commission on Illumination (CIE) in 1931, aims to describe all color sensations that a typical human can perceive. It is a cornerstone of color science, forming the basis for many color spaces used today. XYZ, and the derived xyY space, provide a universal representation of color that is not tethered to a particular display. Many widely used color spaces, including sRGB, are defined relative to XYZ or derived from it.
The CIE built the color space based on a series of experiments in which people matched colors they perceived from mixtures of lights. From these experiments, the CIE developed color-matching functions to calculate three components — X, Y, and Z — which together aim to describe a standard observer's response to visible light. X represents a weighted response to light across the color spectrum, with the highest contribution from long wavelengths (e.g., red). Y represents a weighted response to medium wavelengths (e.g., green), and it corresponds to a color's relative luminance (i.e., brightness). Z represents a weighted response to short wavelengths (e.g., blue).
From the XYZ space, the CIE developed the xyY chromaticity space, which separates a color's chromaticity (hue and colorfulness) from luminance. The CIE used this space to define the CIE 1931 chromaticity diagram , which represents the full range of visible colors at a given luminance. In color science and lighting design, xyY is a common means for specifying colors and visualizing the supported ranges of other color spaces.
CIELAB and Oklab
The CIELAB (L*a*b*) color space, derived from XYZ by the CIE in 1976, expresses colors based on opponent process theory. The L* component represents perceived lightness, and the a* and b* components represent the balance between opposing unique colors. The a* value specifies the balance between green and red , and the b* value specifies the balance between blue and yellow .
The primary intention of CIELAB was to provide a perceptually uniform color space, where fixed-size steps through the space correspond to uniform perceived changes in color. Although relatively uniform, the color space has been found to exhibit some non-uniformities, particularly in the blue part of the color spectrum. Regardless, modern applications often use CIELAB to estimate perceived color differences and calculate smooth color gradients.
In 2020, a new LAB-oriented color space, Oklab , was introduced by Björn Ottosson as an attempt to rectify the non-uniformities of other perceptual color spaces. Similar to CIELAB, the L value in Oklab represents perceived lightness, and the a and b values represent the balance between opposing unique colors. Oklab has gained widespread adoption as a perceptual space for color processing, with support in the latest CSS Color specifications and many software applications.
Cylindrical models
A cylindrical-coordinate model transforms an underlying color model, such as RGB or LAB, into an alternative expression of color information that is often more intuitive for the average person to use and understand.
Instead of a mixture of primary colors or opponent pairs, these models represent color as a hue angle on a color wheel , with additional parameters that describe other qualities such as lightness and colorfulness (a general term for concepts like chroma and saturation). In cylindrical-coordinate spaces, users can select a color and modify its lightness or other qualities without altering the hue.
The three most common RGB-based models are HSL (Hue, Saturation, Lightness), HSV (Hue, Saturation, Value), and HWB (Hue, Whiteness, Blackness). All three define hue angles in the same way, but they define colorfulness and lightness differently. Although they are not perceptually uniform, HSL and HSV are commonplace in color pickers and gradients.
For CIELAB and Oklab, the cylindrical-coordinate versions are CIELCh and Oklch , which express color in terms of perceived lightness, chroma, and hue. They offer perceptually uniform alternatives to RGB-based models. These spaces create unique color wheels, and they have more strict definitions of lightness and colorfulness. Oklch is particularly well-suited for generating smooth, perceptual color gradients.
Alpha and transparency
Many color encoding schemes include an alpha channel, representing opacity . Alpha does not help define a color in a color space; it determines how a color interacts with other colors in the display. Opaque colors appear with full intensity on the screen, whereas translucent (semi-opaque) colors blend into the background. Colors with zero opacity are invisible.
In Pine Script, there are two ways to specify a color's alpha:
• Using the `transp` parameter of the built-in `color.*()` functions. The specified value represents transparency (the opposite of opacity), which the functions translate into an alpha value.
• Using eight-digit hexadecimal color codes. The last two digits in the code represent alpha directly.
A process called alpha compositing simulates translucent colors in a display. It creates a single displayed color by mixing the RGB channels of two colors (foreground and background) based on alpha values, giving the illusion of a semi-opaque color placed over another color. For example, a red color with 80% transparency on a black background produces a dark shade of red.
Hexadecimal color codes
A hexadecimal color code (hex code) is a compact representation of an RGB color. It encodes a color's red, green, and blue values into a sequence of hexadecimal ( base-16 ) digits. The digits are numerals ranging from `0` to `9` or letters from `a` (for 10) to `f` (for 15). Each set of two digits represents an RGB channel ranging from `00` (for 0) to `ff` (for 255).
Pine scripts can natively define colors using hex codes in the format `#rrggbbaa`. The first set of two digits represents red, the second represents green, and the third represents blue. The fourth set represents alpha . If unspecified, the value is `ff` (fully opaque). For example, `#ff8b00` and `#ff8b00ff` represent an opaque orange color. The code `#ff8b0033` represents the same color with 80% transparency.
Gradients
A color gradient maps colors to numbers over a given range. Most color gradients represent a continuous path in a specific color space, where each number corresponds to a mix between a starting color and a stopping color. In Pine, coders often use gradients to visualize value intensities in plots and heatmaps, or to add visual depth to fills.
The behavior of a color gradient depends on the mixing method and the chosen color space. Gradients in sRGB usually mix along a straight line between the red, green, and blue coordinates of two colors. In cylindrical spaces such as HSL, a gradient often rotates the hue angle through the color wheel, resulting in more pronounced color transitions.
Color schemes
A color scheme refers to a set of colors for use in aesthetic or functional design. A color scheme usually consists of just a few distinct colors. However, depending on the purpose, a scheme can include many colors.
A user might choose palettes for a color scheme arbitrarily, or generate them algorithmically. There are many techniques for calculating color schemes. A few simple, practical methods are:
• Sampling a set of distinct colors from a color gradient.
• Generating monochromatic variants of a color (i.e., tints, tones, or shades with matching hues).
• Computing color harmonies — such as complements, analogous colors, triads, and tetrads — from a base color.
This library includes functions for all three of these techniques. See below for details.
█ CALCULATIONS AND USE
Hex string conversion
The `getHexString()` function returns a string containing the eight-digit hexadecimal code corresponding to a "color" value or set of sRGB and transparency values. For example, `getHexString(255, 0, 0)` returns the string `"#ff0000ff"`, and `getHexString(color.new(color.red, 80))` returns `"#f2364533"`.
The `hexStringToColor()` function returns the "color" value represented by a string containing a six- or eight-digit hex code. The `hexStringToRGB()` function returns a tuple containing the sRGB and transparency values. For example, `hexStringToColor("#f23645")` returns the same value as color.red .
Programmers can use these functions to parse colors from "string" inputs, perform string-based color calculations, and inspect color data in text outputs such as Pine Logs and tables.
Color space conversion
All other `get*()` functions convert a "color" value or set of sRGB channels into coordinates in a specific color space, with transparency information included. For example, the tuple returned by `getHSL()` includes the color's hue, saturation, lightness, and transparency values.
To convert data from a color space back to colors or sRGB and transparency values, use the corresponding `*toColor()` or `*toRGB()` functions for that space (e.g., `hslToColor()` and `hslToRGB()`).
Programmers can use these conversion functions to process inputs that define colors in different ways, perform advanced color manipulation, design custom gradients, and more.
The color spaces this library supports are:
• sRGB
• Linear RGB (RGB without gamma correction)
• HSL, HSV, and HWB
• CIE XYZ and xyY
• CIELAB and CIELCh
• Oklab and Oklch
Contrast-based calculations
Contrast refers to the difference in luminance or color that makes one color visible against another. This library features two functions for calculating luminance-based contrast and detecting themes.
The `contrastRatio()` function calculates the contrast between two "color" values based on their relative luminance (the Y value from CIE XYZ) using the formula from version 2 of the Web Content Accessibility Guidelines (WCAG) . This function is useful for identifying colors that provide a sufficient brightness difference for legibility.
The `isLightTheme()` function determines whether a specified background color represents a light theme based on its contrast with black and white. Programmers can use this function to define conditional logic that responds differently to light and dark themes.
Color manipulation and harmonies
The `negative()` function calculates the negative (i.e., inverse) of a color by reversing the color's coordinates in either the sRGB or linear RGB color space. This function is useful for calculating high-contrast colors.
The `grayscale()` function calculates a grayscale form of a specified color with the same relative luminance.
The functions `complement()`, `splitComplements()`, `analogousColors()`, `triadicColors()`, `tetradicColors()`, `pentadicColors()`, and `hexadicColors()` calculate color harmonies from a specified source color within a given color space (HSL, CIELCh, or Oklch). The returned harmonious colors represent specific hue rotations around a color wheel formed by the chosen space, with the same defined lightness, saturation or chroma, and transparency.
Color mixing and gradient creation
The `add()` function simulates combining lights of two different colors by additively mixing their linear red, green, and blue components, ignoring transparency by default. Users can calculate a transparency-weighted mixture by setting the `transpWeight` argument to `true`.
The `overlay()` function estimates the color displayed on a TradingView chart when a specific foreground color is over a background color. This function aids in simulating stacked colors and analyzing the effects of transparency.
The `fromGradient()` and `fromMultiStepGradient()` functions calculate colors from gradients in any of the supported color spaces, providing flexible alternatives to the RGB-based color.from_gradient() function. The `fromGradient()` function calculates a color from a single gradient. The `fromMultiStepGradient()` function calculates a color from a piecewise gradient with multiple defined steps. Gradients are useful for heatmaps and for coloring plots or drawings based on value intensities.
Scheme creation
Three functions in this library calculate palettes for custom color schemes. Scripts can use these functions to create responsive color schemes that adjust to calculated values and user inputs.
The `gradientPalette()` function creates an array of colors by sampling a specified number of colors along a gradient from a base color to a target color, in fixed-size steps.
The `monoPalette()` function creates an array containing monochromatic variants (tints, tones, or shades) of a specified base color. Whether the function mixes the color toward white (for tints), a form of gray (for tones), or black (for shades) depends on the `grayLuminance` value. If unspecified, the function automatically chooses the mix behavior with the highest contrast.
The `harmonyPalette()` function creates a matrix of colors. The first column contains the base color and specified harmonies, e.g., triadic colors. The columns that follow contain tints, tones, or shades of the harmonic colors for additional color choices, similar to `monoPalette()`.
█ EXAMPLE CODE
The example code at the end of the script generates and visualizes color schemes by processing user inputs. The code builds the scheme's palette based on the "Base color" input and the additional inputs in the "Settings/Inputs" tab:
• "Palette type" specifies whether the palette uses a custom gradient, monochromatic base color variants, or color harmonies with monochromatic variants.
• "Target color" sets the top color for the "Gradient" palette type.
• The "Gray luminance" inputs determine variation behavior for "Monochromatic" and "Harmony" palette types. If "Auto" is selected, the palette mixes the base color toward white or black based on its brightness. Otherwise, it mixes the color toward the grayscale color with the specified relative luminance (from 0 to 1).
• "Harmony type" specifies the color harmony used in the palette. Each row in the palette corresponds to one of the harmonious colors, starting with the base color.
The code creates a table on the first bar to display the collection of calculated colors. Each cell in the table shows the color's `getHexString()` value in a tooltip for simple inspection.
Look first. Then leap.
█ EXPORTED FUNCTIONS
Below is a complete list of the functions and overloads exported by this library.
getRGB(source)
Retrieves the sRGB red, green, blue, and transparency components of a "color" value.
getHexString(r, g, b, t)
(Overload 1 of 2) Converts a set of sRGB channel values to a string representing the corresponding color's hexadecimal form.
getHexString(source)
(Overload 2 of 2) Converts a "color" value to a string representing the sRGB color's hexadecimal form.
hexStringToRGB(source)
Converts a string representing an sRGB color's hexadecimal form to a set of decimal channel values.
hexStringToColor(source)
Converts a string representing an sRGB color's hexadecimal form to a "color" value.
getLRGB(r, g, b, t)
(Overload 1 of 2) Converts a set of sRGB channel values to a set of linear RGB values with specified transparency information.
getLRGB(source)
(Overload 2 of 2) Retrieves linear RGB channel values and transparency information from a "color" value.
lrgbToRGB(lr, lg, lb, t)
Converts a set of linear RGB channel values to a set of sRGB values with specified transparency information.
lrgbToColor(lr, lg, lb, t)
Converts a set of linear RGB channel values and transparency information to a "color" value.
getHSL(r, g, b, t)
(Overload 1 of 2) Converts a set of sRGB channels to a set of HSL values with specified transparency information.
getHSL(source)
(Overload 2 of 2) Retrieves HSL channel values and transparency information from a "color" value.
hslToRGB(h, s, l, t)
Converts a set of HSL channel values to a set of sRGB values with specified transparency information.
hslToColor(h, s, l, t)
Converts a set of HSL channel values and transparency information to a "color" value.
getHSV(r, g, b, t)
(Overload 1 of 2) Converts a set of sRGB channels to a set of HSV values with specified transparency information.
getHSV(source)
(Overload 2 of 2) Retrieves HSV channel values and transparency information from a "color" value.
hsvToRGB(h, s, v, t)
Converts a set of HSV channel values to a set of sRGB values with specified transparency information.
hsvToColor(h, s, v, t)
Converts a set of HSV channel values and transparency information to a "color" value.
getHWB(r, g, b, t)
(Overload 1 of 2) Converts a set of sRGB channels to a set of HWB values with specified transparency information.
getHWB(source)
(Overload 2 of 2) Retrieves HWB channel values and transparency information from a "color" value.
hwbToRGB(h, w, b, t)
Converts a set of HWB channel values to a set of sRGB values with specified transparency information.
hwbToColor(h, w, b, t)
Converts a set of HWB channel values and transparency information to a "color" value.
getXYZ(r, g, b, t)
(Overload 1 of 2) Converts a set of sRGB channels to a set of XYZ values with specified transparency information.
getXYZ(source)
(Overload 2 of 2) Retrieves XYZ channel values and transparency information from a "color" value.
xyzToRGB(x, y, z, t)
Converts a set of XYZ channel values to a set of sRGB values with specified transparency information
xyzToColor(x, y, z, t)
Converts a set of XYZ channel values and transparency information to a "color" value.
getXYY(r, g, b, t)
(Overload 1 of 2) Converts a set of sRGB channels to a set of xyY values with specified transparency information.
getXYY(source)
(Overload 2 of 2) Retrieves xyY channel values and transparency information from a "color" value.
xyyToRGB(xc, yc, y, t)
Converts a set of xyY channel values to a set of sRGB values with specified transparency information.
xyyToColor(xc, yc, y, t)
Converts a set of xyY channel values and transparency information to a "color" value.
getLAB(r, g, b, t)
(Overload 1 of 2) Converts a set of sRGB channels to a set of CIELAB values with specified transparency information.
getLAB(source)
(Overload 2 of 2) Retrieves CIELAB channel values and transparency information from a "color" value.
labToRGB(l, a, b, t)
Converts a set of CIELAB channel values to a set of sRGB values with specified transparency information.
labToColor(l, a, b, t)
Converts a set of CIELAB channel values and transparency information to a "color" value.
getOKLAB(r, g, b, t)
(Overload 1 of 2) Converts a set of sRGB channels to a set of Oklab values with specified transparency information.
getOKLAB(source)
(Overload 2 of 2) Retrieves Oklab channel values and transparency information from a "color" value.
oklabToRGB(l, a, b, t)
Converts a set of Oklab channel values to a set of sRGB values with specified transparency information.
oklabToColor(l, a, b, t)
Converts a set of Oklab channel values and transparency information to a "color" value.
getLCH(r, g, b, t)
(Overload 1 of 2) Converts a set of sRGB channels to a set of CIELCh values with specified transparency information.
getLCH(source)
(Overload 2 of 2) Retrieves CIELCh channel values and transparency information from a "color" value.
lchToRGB(l, c, h, t)
Converts a set of CIELCh channel values to a set of sRGB values with specified transparency information.
lchToColor(l, c, h, t)
Converts a set of CIELCh channel values and transparency information to a "color" value.
getOKLCH(r, g, b, t)
(Overload 1 of 2) Converts a set of sRGB channels to a set of Oklch values with specified transparency information.
getOKLCH(source)
(Overload 2 of 2) Retrieves Oklch channel values and transparency information from a "color" value.
oklchToRGB(l, c, h, t)
Converts a set of Oklch channel values to a set of sRGB values with specified transparency information.
oklchToColor(l, c, h, t)
Converts a set of Oklch channel values and transparency information to a "color" value.
contrastRatio(value1, value2)
Calculates the contrast ratio between two colors values based on the formula from version 2 of the Web Content Accessibility Guidelines (WCAG).
isLightTheme(source)
Detects whether a background color represents a light theme or dark theme, based on the amount of contrast between the color and the white and black points.
grayscale(source)
Calculates the grayscale version of a color with the same relative luminance (i.e., brightness).
negative(source, colorSpace)
Calculates the negative (i.e., inverted) form of a specified color.
complement(source, colorSpace)
Calculates the complementary color for a `source` color using a cylindrical color space.
analogousColors(source, colorSpace)
Calculates the analogous colors for a `source` color using a cylindrical color space.
splitComplements(source, colorSpace)
Calculates the split-complementary colors for a `source` color using a cylindrical color space.
triadicColors(source, colorSpace)
Calculates the two triadic colors for a `source` color using a cylindrical color space.
tetradicColors(source, colorSpace, square)
Calculates the three square or rectangular tetradic colors for a `source` color using a cylindrical color space.
pentadicColors(source, colorSpace)
Calculates the four pentadic colors for a `source` color using a cylindrical color space.
hexadicColors(source, colorSpace)
Calculates the five hexadic colors for a `source` color using a cylindrical color space.
add(value1, value2, transpWeight)
Additively mixes two "color" values, with optional transparency weighting.
overlay(fg, bg)
Estimates the resulting color that appears on the chart when placing one color over another.
fromGradient(value, bottomValue, topValue, bottomColor, topColor, colorSpace)
Calculates the gradient color that corresponds to a specific value based on a defined value range and color space.
fromMultiStepGradient(value, steps, colors, colorSpace)
Calculates a multi-step gradient color that corresponds to a specific value based on an array of step points, an array of corresponding colors, and a color space.
gradientPalette(baseColor, stopColor, steps, strength, model)
Generates a palette from a gradient between two base colors.
monoPalette(baseColor, grayLuminance, variations, strength, colorSpace)
Generates a monochromatic palette from a specified base color.
harmonyPalette(baseColor, harmonyType, grayLuminance, variations, strength, colorSpace)
Generates a palette consisting of harmonious base colors and their monochromatic variants.

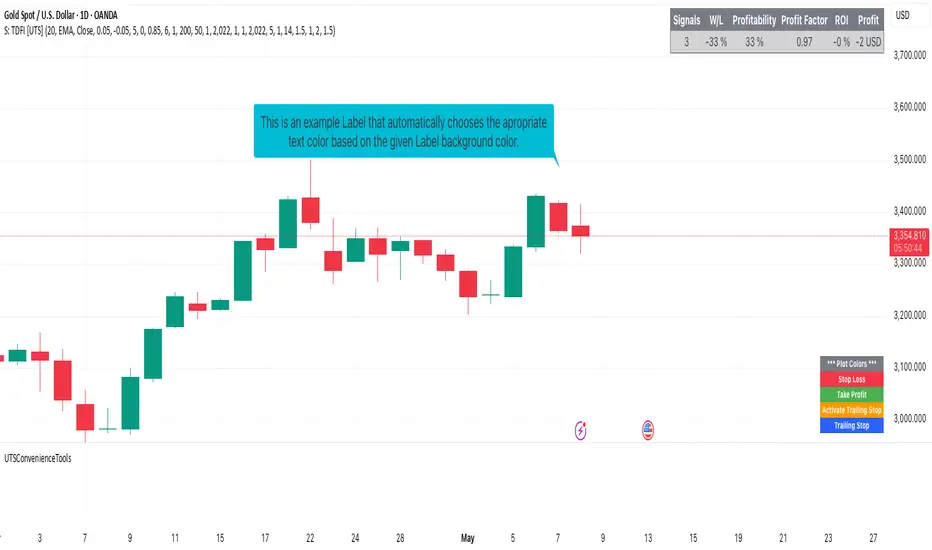
LabelManagementLabel management with fluent configuration, change tracking, and named registry
LabelManagement is a Pine Script library for creating and managing dynamic chart labels. Built with a fluent-style API , it simplifies label creation, styling, positioning, and content updates through method chaining and centralized control.
Manage 'sticky' labels easily across bars with expressive, readable code that reduces clutter and improves code clarity.
Example usage:
// Close label – to the right of the last bar
labels.get("close")
.style(label.style_label_left)
.bgColor(color.gray)
.xy(bar_index, close)
.textValue("C: " + str.tostring(close, "#.##"))
.textColor(color.white)
.tooltip("This is the close price")
.apply()
Key features:
Fluent API – Build and update labels using a chainable configuration flow
Named label registry – Access and manage labels by name, e.g., "entry", "stop", "target"
Change tracking – Update only when necessary to reduce redraws
Deferred application – Apply all changes in one efficient operation
Centralized control – Works well in modular or multi-label environments
This library is designed for Pine developers who want more control and less boilerplate when managing visual elements on the chart.
method clone(this)
Creates a new LabelConfig by copying all properties from this instance
Namespace types: LabelConfig
Parameters:
this (LabelConfig) : (LabelConfig) The LabelConfig instance
Returns: (LabelConfig) New LabelConfig instance with identical properties
method applyTo(this, target)
Applies configuration to specified label (required parameter)
Namespace types: LabelConfig
Parameters:
this (LabelConfig) : (LabelConfig) The LabelConfig instance
target (label) : (label) Label to apply config to
Returns: (LabelConfig) Self-reference for method chaining
method update(this, updates)
Creates a new LabelUpdater with change tracking for this label
Namespace types: series label
Parameters:
this (label) : (label) The label instance
updates (LabelConfig) : (LabelConfig) Optional existing config to apply and reuse (if provided, applies to label first)
Returns: (LabelUpdater) New LabelUpdater with blank configs for change tracking
method x(this, value)
Sets the X coordinate with change tracking (fluent interface)
Namespace types: LabelUpdater
Parameters:
this (LabelUpdater) : (LabelUpdater) The LabelUpdater instance
value (int) : (int) New X coordinate
Returns: (LabelUpdater) Self-reference for method chaining
method y(this, value)
Sets the Y coordinate with change tracking (fluent interface)
Namespace types: LabelUpdater
Parameters:
this (LabelUpdater) : (LabelUpdater) The LabelUpdater instance
value (float) : (float) New Y coordinate
Returns: (LabelUpdater) Self-reference for method chaining
method xy(this, x, y)
Sets both X and Y coordinates with change tracking (fluent interface)
Namespace types: LabelUpdater
Parameters:
this (LabelUpdater) : (LabelUpdater) The LabelUpdater instance
x (int) : (int) New X coordinate
y (float) : (float) New Y coordinate
Returns: (LabelUpdater) Self-reference for method chaining
method textValue(this, value)
Sets the text content with change tracking (fluent interface)
Namespace types: LabelUpdater
Parameters:
this (LabelUpdater) : (LabelUpdater) The LabelUpdater instance
value (string) : (string) New text content
Returns: (LabelUpdater) Self-reference for method chaining
method textColor(this, value)
Sets the text color with change tracking (fluent interface)
Namespace types: LabelUpdater
Parameters:
this (LabelUpdater) : (LabelUpdater) The LabelUpdater instance
value (color) : (color) New text color
Returns: (LabelUpdater) Self-reference for method chaining
method textSize(this, value)
Sets the text size with change tracking (fluent interface)
Namespace types: LabelUpdater
Parameters:
this (LabelUpdater) : (LabelUpdater) The LabelUpdater instance
value (string) : (string) New text size
Returns: (LabelUpdater) Self-reference for method chaining
method bgColor(this, value)
Sets the background color with change tracking (fluent interface)
Namespace types: LabelUpdater
Parameters:
this (LabelUpdater) : (LabelUpdater) The LabelUpdater instance
value (color) : (color) New background color
Returns: (LabelUpdater) Self-reference for method chaining
method style(this, value)
Sets the label style with change tracking (fluent interface)
Namespace types: LabelUpdater
Parameters:
this (LabelUpdater) : (LabelUpdater) The LabelUpdater instance
value (string) : (string) New style
Returns: (LabelUpdater) Self-reference for method chaining
method yloc(this, value)
Sets the Y location mode with change tracking (fluent interface)
Namespace types: LabelUpdater
Parameters:
this (LabelUpdater) : (LabelUpdater) The LabelUpdater instance
value (string) : (string) New yloc
Returns: (LabelUpdater) Self-reference for method chaining
method xloc(this, value)
Sets the X location mode with change tracking (fluent interface)
Namespace types: LabelUpdater
Parameters:
this (LabelUpdater) : (LabelUpdater) The LabelUpdater instance
value (string) : (string) New xloc
Returns: (LabelUpdater) Self-reference for method chaining
method tooltip(this, value)
Sets the tooltip content with change tracking (fluent interface)
Namespace types: LabelUpdater
Parameters:
this (LabelUpdater) : (LabelUpdater) The LabelUpdater instance
value (string) : (string) New tooltip content
Returns: (LabelUpdater) Self-reference for method chaining
method size(this, value)
Sets the text size with change tracking (fluent interface) - alias for textSize
Namespace types: LabelUpdater
Parameters:
this (LabelUpdater) : (LabelUpdater) The LabelUpdater instance
value (string) : (string) New text size
Returns: (LabelUpdater) Self-reference for method chaining
method size(this)
Gets the count of registered labels
Namespace types: LabelManager
Parameters:
this (LabelManager) : (LabelManager) The LabelManager instance
Returns: (int) Number of labels in the registry
method apply(this)
Applies pending changes to linked label and updates tracking
Namespace types: LabelUpdater
Parameters:
this (LabelUpdater) : (LabelUpdater) The LabelUpdater instance
Returns: (LabelUpdater) Self-reference for method chaining
method get(this, name)
Gets or creates a LabelUpdater for the specified name
Namespace types: LabelManager
Parameters:
this (LabelManager) : (LabelManager) The LabelManager instance
name (string) : (string) Unique identifier for the label
Returns: (LabelUpdater) Existing or newly created LabelUpdater for the name
method has(this, name)
Checks if a label with the specified name exists
Namespace types: LabelManager
Parameters:
this (LabelManager) : (LabelManager) The LabelManager instance
name (string) : (string) Name to check for existence
Returns: (bool) True if label exists, false otherwise
method remove(this, name)
Removes a label from the registry and deletes the underlying Pine Script label
Namespace types: LabelManager
Parameters:
this (LabelManager) : (LabelManager) The LabelManager instance
name (string) : (string) Name of the label to remove
Returns: (LabelManager) Self-reference for method chaining
method clear(this)
Removes all labels from registry and deletes all underlying Pine Script labels
Namespace types: LabelManager
Parameters:
this (LabelManager) : (LabelManager) The LabelManager instance
Returns: (LabelManager) Self-reference for method chaining
newManager()
Creates a new LabelManager with empty registry
Returns: (LabelManager) New LabelManager instance ready for use
LabelConfig
LabelConfig Configuration object for label appearance and positioning
Fields:
x (series int) : (series int) X-coordinate (na = unchanged)
y (series float) : (series float) Y-coordinate (na = unchanged)
style (series string) : (series string) Label style (na = unchanged)
yloc (series string) : (series string) Y-location type (na = unchanged)
xloc (series string) : (series string) X-location type (na = unchanged)
bgColor (series color) : (series color) Background color (na = unchanged)
textValue (series string) : (series string) Label text content (na = unchanged)
textSize (series string) : (series string) Text size (na = unchanged)
textColor (series color) : (series color) Text color (na = unchanged)
tooltip (series string) : (series string) Tooltip text (na = unchanged)
LabelUpdater
LabelUpdater Smart label updater with change tracking and minimal updates
Fields:
label (series label) : (label) Reference to the label being updated
latest (LabelConfig) : (LabelConfig) Current known state of the label
updates (LabelConfig) : (LabelConfig) Pending changes to apply
LabelManager
LabelManager Central registry for managing named labels with automatic creation
Fields:
registry (map) : (map) Internal storage mapping names to LabelUpdater instances

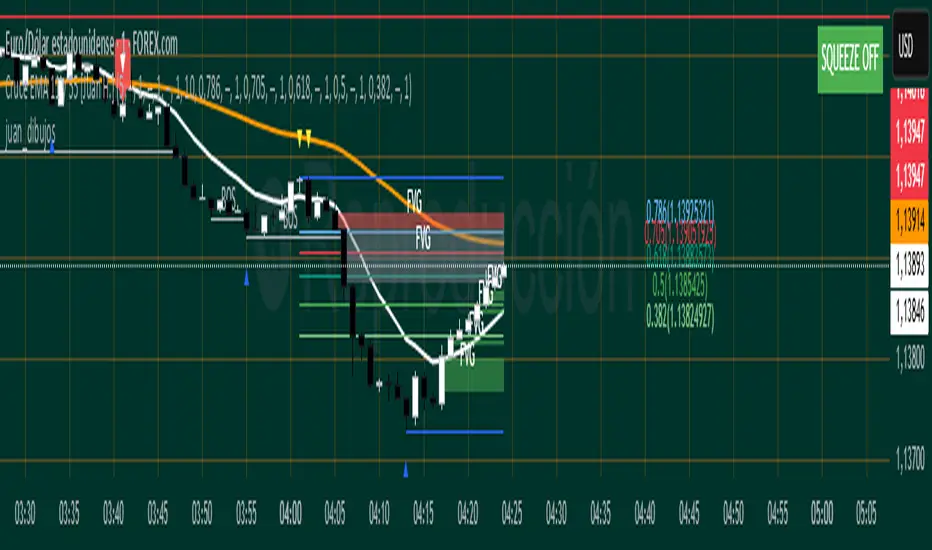
juan_dibujosLibrary "juan_dibujos"
extend_line(lineId, labelId)
: Extend specific line with its label
Parameters:
lineId (line)
labelId (label)
update_line_coordinates(lineId, labelId, x1, y1, x2, y2)
: Update specific line coordinates with its label
Parameters:
lineId (line)
labelId (label)
x1 (int)
y1 (float)
x2 (int)
y2 (float)
update_label_coordinates(labelId, value)
: Update coordinates of a label
Parameters:
labelId (label)
value (float)
delete_line(lineId, labelId)
: Delete specific line with its label
Parameters:
lineId (line)
labelId (label)
update_box_coordinates(boxId, labelId, left, top, right, bottom)
: Update specific box coordinates with its label
Parameters:
boxId (box)
labelId (label)
left (int)
top (float)
right (int)
bottom (float)
delete_box(boxId, labelId)
: Delete specific box with its label
Parameters:
boxId (box)
labelId (label)
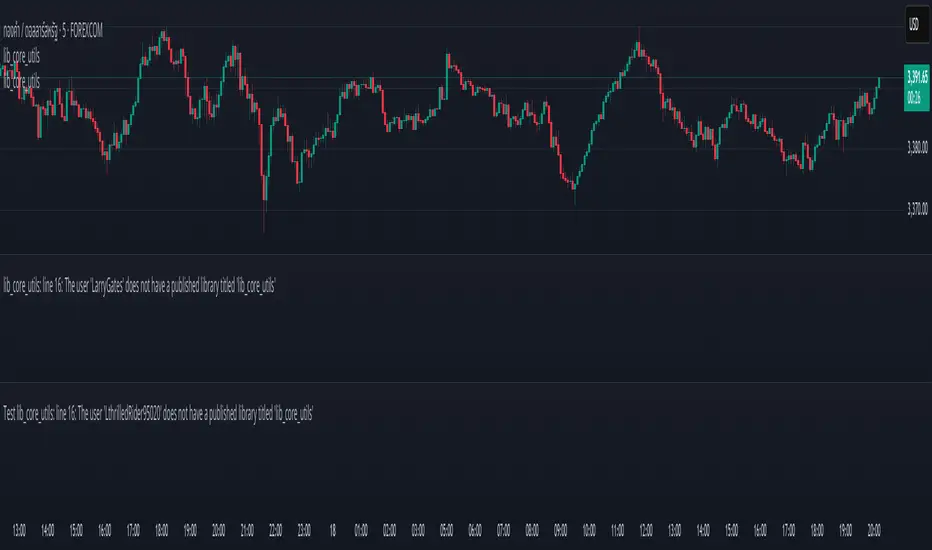
lib_core_utilsLibrary "lib_core_utils"
Core utility functions for Pine Script strategies
Provides safe mathematical operations, array management, and basic helpers
Version: 1.0.0
Author: NQ Hybrid Strategy Team
Last Updated: 2025-06-18
===================================================================
safe_division(numerator, denominator)
safe_division
@description Performs division with safety checks for zero denominators and invalid values
Parameters:
numerator (float) : (float) The numerator value
denominator (float) : (float) The denominator value
Returns: (float) Result of division, or 0.0 if invalid
safe_division_detailed(numerator, denominator)
safe_division_detailed
@description Enhanced division with detailed result information
Parameters:
numerator (float) : (float) The numerator value
denominator (float) : (float) The denominator value
Returns: (SafeCalculationResult) Detailed calculation result
safe_multiply(a, b)
safe_multiply
@description Performs multiplication with safety checks for overflow and invalid values
Parameters:
a (float) : (float) First multiplier
b (float) : (float) Second multiplier
Returns: (float) Result of multiplication, or 0.0 if invalid
safe_add(a, b)
safe_add
@description Performs addition with safety checks
Parameters:
a (float) : (float) First addend
b (float) : (float) Second addend
Returns: (float) Result of addition, or 0.0 if invalid
safe_subtract(a, b)
safe_subtract
@description Performs subtraction with safety checks
Parameters:
a (float) : (float) Minuend
b (float) : (float) Subtrahend
Returns: (float) Result of subtraction, or 0.0 if invalid
safe_abs(value)
safe_abs
@description Safe absolute value calculation
Parameters:
value (float) : (float) Input value
Returns: (float) Absolute value, or 0.0 if invalid
safe_max(a, b)
safe_max
@description Safe maximum value calculation
Parameters:
a (float) : (float) First value
b (float) : (float) Second value
Returns: (float) Maximum value, handling NA cases
safe_min(a, b)
safe_min
@description Safe minimum value calculation
Parameters:
a (float) : (float) First value
b (float) : (float) Second value
Returns: (float) Minimum value, handling NA cases
safe_array_get(arr, index)
safe_array_get
@description Safely retrieves value from array with bounds checking
Parameters:
arr (array) : (array) The array to access
index (int) : (int) Index to retrieve
Returns: (float) Value at index, or na if invalid
safe_array_push(arr, value, max_size)
safe_array_push
@description Safely pushes value to array with size management
Parameters:
arr (array) : (array) The array to modify
value (float) : (float) Value to push
max_size (int) : (int) Maximum array size
Returns: (bool) True if push was successful
safe_array_unshift(arr, value, max_size)
safe_array_unshift
@description Safely adds value to beginning of array with size management
Parameters:
arr (array) : (array) The array to modify
value (float) : (float) Value to add at beginning
max_size (int) : (int) Maximum array size
Returns: (bool) True if unshift was successful
get_array_stats(arr, max_size)
get_array_stats
@description Gets statistics about an array
Parameters:
arr (array) : (array) The array to analyze
max_size (int) : (int) The maximum allowed size
Returns: (ArrayStats) Statistics about the array
cleanup_array(arr, target_size)
cleanup_array
@description Cleans up array by removing old elements if it's too large
Parameters:
arr (array) : (array) The array to cleanup
target_size (int) : (int) Target size after cleanup
Returns: (int) Number of elements removed
is_valid_price(price)
is_valid_price
@description Checks if a price value is valid for trading calculations
Parameters:
price (float) : (float) Price to validate
Returns: (bool) True if price is valid
is_valid_volume(vol)
is_valid_volume
@description Checks if a volume value is valid
Parameters:
vol (float) : (float) Volume to validate
Returns: (bool) True if volume is valid
sanitize_price(price, default_value)
sanitize_price
@description Sanitizes price value to ensure it's within valid range
Parameters:
price (float) : (float) Price to sanitize
default_value (float) : (float) Default value if price is invalid
Returns: (float) Sanitized price value
sanitize_percentage(pct)
sanitize_percentage
@description Sanitizes percentage value to 0-100 range
Parameters:
pct (float) : (float) Percentage to sanitize
Returns: (float) Sanitized percentage (0-100)
is_session_active(session_string, timezone)
Parameters:
session_string (string)
timezone (string)
get_session_progress(session_string, timezone)
Parameters:
session_string (string)
timezone (string)
format_price(price, decimals)
Parameters:
price (float)
decimals (int)
format_percentage(pct, decimals)
Parameters:
pct (float)
decimals (int)
bool_to_emoji(condition, true_emoji, false_emoji)
Parameters:
condition (bool)
true_emoji (string)
false_emoji (string)
log_debug(message, level)
Parameters:
message (string)
level (string)
benchmark_start()
benchmark_end(start_time)
Parameters:
start_time (int)
get_library_info()
get_library_version()
SafeCalculationResult
SafeCalculationResult
Fields:
value (series float) : (float) The calculated value
is_valid (series bool) : (bool) Whether the calculation was successful
error_message (series string) : (string) Error description if calculation failed
ArrayStats
ArrayStats
Fields:
size (series int) : (int) Current array size
max_size (series int) : (int) Maximum allowed size
is_full (series bool) : (bool) Whether array has reached max capacity
CGMALibrary "CGMA"
This library provides a function to calculate a moving average based on Chebyshev-Gauss Quadrature. This method samples price data more intensely from the beginning and end of the lookback window, giving it a unique character that responds quickly to recent changes while also having a long "memory" of the trend's start. Inspired by reading rohangautam.github.io
What is Chebyshev-Gauss Quadrature?
It's a numerical method to approximate the integral of a function f(x) that is weighted by 1/sqrt(1-x^2) over the interval . The approximation is a simple sum: ∫ f(x)/sqrt(1-x^2) dx ≈ (π/n) * Σ f(xᵢ) where xᵢ are special points called Chebyshev nodes.
How is this applied to a Moving Average?
A moving average can be seen as the "mean value" of the price over a lookback window. The mean value of a function with the Chebyshev weight is calculated as:
Mean = /
The math simplifies beautifully, resulting in the mean being the simple arithmetic average of the function evaluated at the Chebyshev nodes:
Mean = (1/n) * Σ f(xᵢ)
What's unique about this MA?
The Chebyshev nodes xᵢ are not evenly spaced. They are clustered towards the ends of the interval . We map this interval to our lookback period. This means the moving average samples prices more intensely from the beginning and the end of the lookback window, and less intensely from the middle. This gives it a unique character, responding quickly to recent changes while also having a long "memory" of the start of the trend.

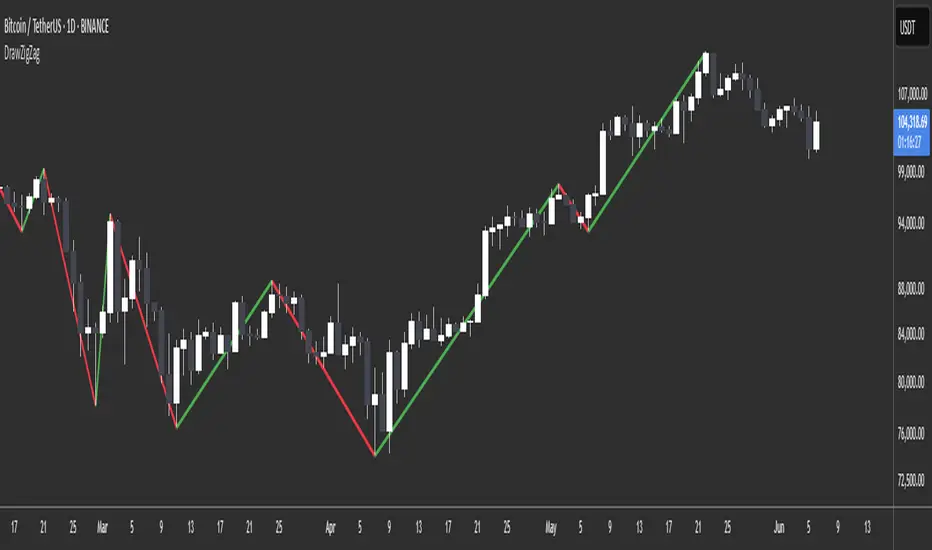
DrawZigZag🟩 OVERVIEW
This library draws zigzag lines for existing pivots. It is designed to be simple to use. If your script creates pivots and you want to join them up while handling edge cases, this library does that quickly and efficiently. If you want your pivots created for you, choose one of the many other zigzag libraries that do that.
🟩 HOW TO USE
Pine Script libraries contain reusable code for importing into indicators. You do not need to copy any code out of here. Just import the library and call the function you want.
For example, for version 1 of this library, import it like this:
import SimpleCryptoLife/DrawZigZag/1
See the EXAMPLE USAGE sections within the library for examples of calling the functions.
For more information on libraries and incorporating them into your scripts, see the Libraries section of the Pine Script User Manual.
🟩 WHAT IT DOES
I looked at every zigzag library on TradingView, after finishing this one. They all seemed to fall into two groups in terms of functionality:
• Create the pivots themselves, using a combination of Williams-style pivots and sometimes price distance.
• Require an array of pivot information, often in a format that uses user-defined types.
My library takes a completely different approach.
Firstly, it only does the drawing. It doesn't calculate the pivots for you. This isn't laziness. There are so many ways to define pivots and that should be up to you. If you've followed my work on market structure you know what I think of Williams pivots.
Secondly, when you pass information about your pivots to the library function, you only need the minimum of pivot information -- whether it's a High or Low pivot, the price, and the bar index. Pass these as normal variables -- bools, ints, and floats -- on the fly as your pivots confirm. It is completely agnostic as to how you derive your pivots. If they are confirmed an arbitrary number of bars after they happen, that's fine.
So why even bother using it if all it does it draw some lines?
Turns out there is quite some logic needed in order to connect highs and lows in the right way, and to handle edge cases. This is the kind of thing one can happily outsource.
🟩 THE RULES
• Zigs and zags must alternate between Highs and Lows. We never connect a High to a High or a Low to a Low.
• If a candle has both a High and Low pivot confirmed on it, the first line is drawn to the end of the candle that is the opposite to the previous pivot. Then the next line goes vertically through the candle to the other end, and then after that continues normally.
• If we draw a line up from a Low to a High pivot, and another High pivot comes in higher, we *extend* the line up, and the same for lines down. Yes this is a form of repainting. It is in my opinion the only way to end up with a correct structure.
• We ignore lower highs on the way up and higher lows on the way down.
🟩 WHAT'S COOL ABOUT THIS LIBRARY
• It's simple and lightweight: no exported user-defined types, no helper methods, no matrices.
• It's really fast. In my profiling it runs at about ~50ms, and changing the options (e.g., trimming the array) doesn't make very much difference.
• You only need to call one function, which does all the calculations and draws all lines.
• There are two variations of this function though -- one simple function that just draws lines, and one slightly more advanced method that modifies an array containing the lines. If you don't know which one you want, use the simpler one.
🟩 GEEK STUFF
• There are no dependencies on other libraries.
• I tried to make the logic as clear as I could and comment it appropriately.
• In the `f_drawZigZags` function, the line variable is declared using the `var` keyword *inside* the function, for simplicity. For this reason, it persists between function calls *only* if the function is called from the global scope or a local if block. In general, if a function is called from inside a loop , or multiple times from different contexts, persistent variables inside that function are re-initialised on each call. In this case, this re-initialisation would mean that the function loses track of the previous line, resulting in incorrect drawings. This is why you cannot call the `f_drawZigZags` function from a loop (not that there's any reason to). The `m_drawZigZagsArray` does not use any internal `var` variables.
• The function itself takes a Boolean parameter `_showZigZag`, which turns the drawings on and off, so there is no need to call the function conditionally. In the examples, we do call the functions from an if block, purely as an illustration of how to increase performance by restricting the amount of code that needs to be run.
🟩 BRING ON THE FUNCTIONS
f_drawZigZags(_showZigZag, _isHighPivot, _isLowPivot, _highPivotPrice, _lowPivotPrice, _pivotIndex, _zigzagWidth, _lineStyle, _upZigColour, _downZagColour)
This function creates or extends the latest zigzag line. Takes real-time information about pivots and draws lines. It does not calculate the pivots. It must be called once per script and cannot be called from a loop.
Parameters:
_showZigZag (bool) : Whether to show the zigzag lines.
_isHighPivot (bool) : Whether the current bar confirms a high pivot. Note that pivots are confirmed after the bar in which they occur.
_isLowPivot (bool) : Whether the current bar confirms a low pivot.
_highPivotPrice (float) : The price of the high pivot that was confirmed this bar. It is NOT the high price of the current bar.
_lowPivotPrice (float) : The price of the low pivot that was confirmed this bar. It is NOT the low price of the current bar.
_pivotIndex (int) : The bar index of the pivot that was confirmed this bar. This is not an offset. It's the `bar_index` value of the pivot.
_zigzagWidth (int) : The width of the zigzag lines.
_lineStyle (string) : The style of the zigzag lines.
_upZigColour (color) : The colour of the up zigzag lines.
_downZagColour (color) : The colour of the down zigzag lines.
Returns: The function has no explicit returns. As a side effect, it draws or updates zigzag lines.
method m_drawZigZagsArray(_a_zigZagLines, _showZigZag, _isHighPivot, _isLowPivot, _highPivotPrice, _lowPivotPrice, _pivotIndex, _zigzagWidth, _lineStyle, _upZigColour, _downZagColour, _trimArray)
Namespace types: array
Parameters:
_a_zigZagLines (array)
_showZigZag (bool) : Whether to show the zigzag lines.
_isHighPivot (bool) : Whether the current bar confirms a high pivot. Note that pivots are usually confirmed after the bar in which they occur.
_isLowPivot (bool) : Whether the current bar confirms a low pivot.
_highPivotPrice (float) : The price of the high pivot that was confirmed this bar. It is NOT the high price of the current bar.
_lowPivotPrice (float) : The price of the low pivot that was confirmed this bar. It is NOT the low price of the current bar.
_pivotIndex (int) : The bar index of the pivot that was confirmed this bar. This is not an offset. It's the `bar_index` value of the pivot.
_zigzagWidth (int) : The width of the zigzag lines.
_lineStyle (string) : The style of the zigzag lines.
_upZigColour (color) : The colour of the up zigzag lines.
_downZagColour (color) : The colour of the down zigzag lines.
_trimArray (bool) : If true, the array of lines is kept to a maximum size of two lines (the line elements are not deleted). If false (the default), the array is kept to a maximum of 500 lines (the maximum number of line objects a single Pine script can display).
Returns: This function has no explicit returns but it modifies a global array of zigzag lines.
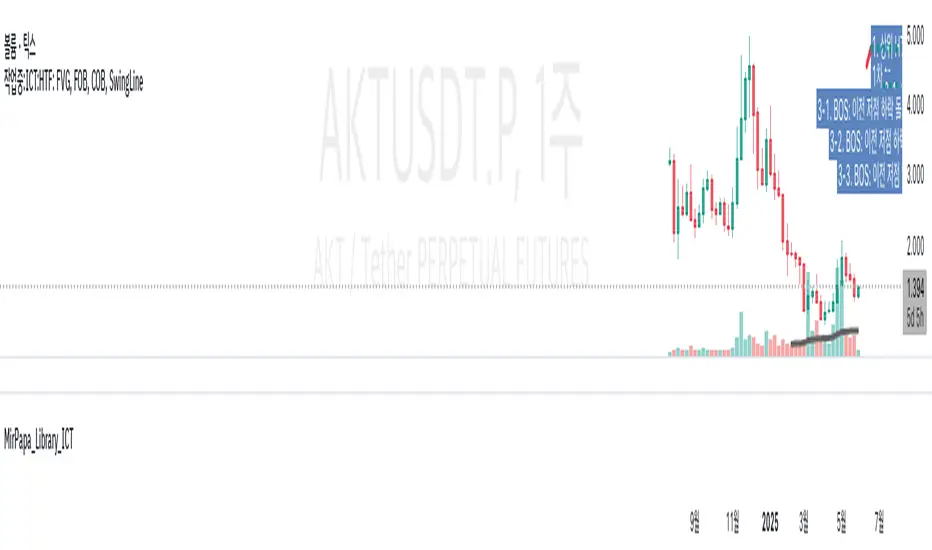
MirPapa_Library_ICTLibrary "MirPapa_Library_ICT"
GetHTFoffsetToLTFoffset(_offset, _chartTf, _htfTf)
GetHTFoffsetToLTFoffset
@description Adjust an HTF offset to an LTF offset by calculating the ratio of timeframes.
Parameters:
_offset (int) : int The HTF bar offset (0 means current HTF bar).
_chartTf (string) : string The current chart’s timeframe (e.g., "5", "15", "1D").
_htfTf (string) : string The High Time Frame string (e.g., "60", "1D").
@return int The corresponding LTF bar index. Returns 0 if the result is negative.
IsConditionState(_type, _isBull, _level, _open, _close, _open1, _close1, _low1, _low2, _low3, _low4, _high1, _high2, _high3, _high4)
IsConditionState
@description Evaluate a condition state based on type for COB, FVG, or FOB.
Overloaded: first signature handles COB, second handles FVG/FOB.
Parameters:
_type (string) : string Condition type ("cob", "fvg", "fob").
_isBull (bool) : bool Direction flag: true for bullish, false for bearish.
_level (int) : int Swing level (only used for COB).
_open (float) : float Current bar open price (only for COB).
_close (float) : float Current bar close price (only for COB).
_open1 (float) : float Previous bar open price (only for COB).
_close1 (float) : float Previous bar close price (only for COB).
_low1 (float) : float Low 1 bar ago (only for COB).
_low2 (float) : float Low 2 bars ago (only for COB).
_low3 (float) : float Low 3 bars ago (only for COB).
_low4 (float) : float Low 4 bars ago (only for COB).
_high1 (float) : float High 1 bar ago (only for COB).
_high2 (float) : float High 2 bars ago (only for COB).
_high3 (float) : float High 3 bars ago (only for COB).
_high4 (float) : float High 4 bars ago (only for COB).
@return bool True if the specified condition is met, false otherwise.
IsConditionState(_type, _isBull, _pricePrev, _priceNow)
IsConditionState
@description Evaluate FVG or FOB condition based on price movement.
Parameters:
_type (string) : string Condition type ("fvg", "fob").
_isBull (bool) : bool Direction flag: true for bullish, false for bearish.
_pricePrev (float) : float Previous price (for FVG/FOB).
_priceNow (float) : float Current price (for FVG/FOB).
@return bool True if the specified condition is met, false otherwise.
IsSwingHighLow(_isBull, _level, _open, _close, _open1, _close1, _low1, _low2, _low3, _low4, _high1, _high2, _high3, _high4)
IsSwingHighLow
@description Public wrapper for isSwingHighLow.
Parameters:
_isBull (bool) : bool Direction flag: true for bullish, false for bearish.
_level (int) : int Swing level (1 or 2).
_open (float) : float Current bar open price.
_close (float) : float Current bar close price.
_open1 (float) : float Previous bar open price.
_close1 (float) : float Previous bar close price.
_low1 (float) : float Low 1 bar ago.
_low2 (float) : float Low 2 bars ago.
_low3 (float) : float Low 3 bars ago.
_low4 (float) : float Low 4 bars ago.
_high1 (float) : float High 1 bar ago.
_high2 (float) : float High 2 bars ago.
_high3 (float) : float High 3 bars ago.
_high4 (float) : float High 4 bars ago.
@return bool True if swing condition is met, false otherwise.
AddBox(_left, _right, _top, _bot, _xloc, _colorBG, _colorBD)
AddBox
@description Draw a rectangular box on the chart with specified coordinates and colors.
Parameters:
_left (int) : int Left bar index for the box.
_right (int) : int Right bar index for the box.
_top (float) : float Top price coordinate for the box.
_bot (float) : float Bottom price coordinate for the box.
_xloc (string) : string X-axis location type (e.g., xloc.bar_index).
_colorBG (color) : color Background color for the box.
_colorBD (color) : color Border color for the box.
@return box Returns the created box object.
Addline(_x, _y, _xloc, _color, _width)
Addline
@description Draw a vertical or horizontal line at specified coordinates.
Parameters:
_x (int) : int X-coordinate for start (bar index).
_y (int) : float Y-coordinate for start (price).
_xloc (string) : string X-axis location type (e.g., xloc.bar_index).
_color (color) : color Line color.
_width (int) : int Line width.
@return line Returns the created line object.
Addline(_x, _y, _xloc, _color, _width)
Parameters:
_x (int)
_y (float)
_xloc (string)
_color (color)
_width (int)
Addline(_x1, _y1, _x2, _y2, _xloc, _color, _width)
Parameters:
_x1 (int)
_y1 (int)
_x2 (int)
_y2 (int)
_xloc (string)
_color (color)
_width (int)
Addline(_x1, _y1, _x2, _y2, _xloc, _color, _width)
Parameters:
_x1 (int)
_y1 (int)
_x2 (int)
_y2 (float)
_xloc (string)
_color (color)
_width (int)
Addline(_x1, _y1, _x2, _y2, _xloc, _color, _width)
Parameters:
_x1 (int)
_y1 (float)
_x2 (int)
_y2 (int)
_xloc (string)
_color (color)
_width (int)
Addline(_x1, _y1, _x2, _y2, _xloc, _color, _width)
Parameters:
_x1 (int)
_y1 (float)
_x2 (int)
_y2 (float)
_xloc (string)
_color (color)
_width (int)
AddlineMid(_type, _left, _right, _top, _bot, _xloc, _color, _width)
AddlineMid
@description Draw a midline between top and bottom for FVG or FOB types.
Parameters:
_type (string) : string Type identifier: "fvg" or "fob".
_left (int) : int Left bar index for midline start.
_right (int) : int Right bar index for midline end.
_top (float) : float Top price of the region.
_bot (float) : float Bottom price of the region.
_xloc (string) : string X-axis location type (e.g., xloc.bar_index).
_color (color) : color Line color.
_width (int) : int Line width.
@return line or na Returns the created line or na if type is not recognized.
GetHtfFromLabel(_label)
GetHtfFromLabel
@description Convert a Korean HTF label into a Pine Script timeframe string via handler library.
Parameters:
_label (string) : string The Korean label (e.g., "5분", "1시간").
@return string Returns the corresponding Pine Script timeframe (e.g., "5", "60").
IsChartTFcomparisonHTF(_chartTf, _htfTf)
IsChartTFcomparisonHTF
@description Determine whether a given HTF is greater than or equal to the current chart timeframe.
Parameters:
_chartTf (string) : string Current chart timeframe (e.g., "5", "15", "1D").
_htfTf (string) : string HTF timeframe (e.g., "60", "1D").
@return bool True if HTF ≥ chartTF, false otherwise.
CreateBoxData(_type, _isBull, _useLine, _top, _bot, _xloc, _colorBG, _colorBD, _offset, _htfTf, htfBarIdx, _basePoint)
CreateBoxData
@description Create and draw a box and optional midline for given type and parameters. Returns success flag and BoxData.
Parameters:
_type (string) : string Type identifier: "fvg", "fob", "cob", or "sweep".
_isBull (bool) : bool Direction flag: true for bullish, false for bearish.
_useLine (bool) : bool Whether to draw a midline inside the box.
_top (float) : float Top price of the box region.
_bot (float) : float Bottom price of the box region.
_xloc (string) : string X-axis location type (e.g., xloc.bar_index).
_colorBG (color) : color Background color for the box.
_colorBD (color) : color Border color for the box.
_offset (int) : int HTF bar offset (0 means current HTF bar).
_htfTf (string) : string HTF timeframe string (e.g., "60", "1D").
htfBarIdx (int) : int HTF bar_index (passed from HTF request).
_basePoint (float) : float Base point for breakout checks.
@return tuple(bool, BoxData) Returns a boolean indicating success and the created BoxData struct.
ProcessBoxDatas(_datas, _useMidLine, _closeCount, _colorClose)
ProcessBoxDatas
@description Process an array of BoxData structs: extend, record volume, update stage, and finalize boxes.
Parameters:
_datas (array) : array Array of BoxData objects to process.
_useMidLine (bool) : bool Whether to update the midline endpoint.
_closeCount (int) : int Number of touches required to close the box.
_colorClose (color) : color Color to apply when a box closes.
@return void No return value; updates are in-place.
BoxData
Fields:
_isActive (series bool)
_isBull (series bool)
_box (series box)
_line (series line)
_basePoint (series float)
_boxTop (series float)
_boxBot (series float)
_stage (series int)
_isStay (series bool)
_volBuy (series float)
_volSell (series float)
_result (series string)
LineData
Fields:
_isActive (series bool)
_isBull (series bool)
_line (series line)
_basePoint (series float)
_stage (series int)
_isStay (series bool)
_result (series string)
FvgPanel█ OVERVIEW
This library provides functionalities for creating and managing a display panel within a Pine Script™ indicator. Its primary purpose is to offer a structured way to present Fair Value Gap (FVG) information, specifically the nearest bullish and bearish FVG levels across different timeframes (Current, MTF, HTF), directly on the chart. The library handles the table's structure, header initialization, and dynamic cell content updates.
█ CONCEPTS
The core of this library revolves around presenting summarized FVG data in a clear, tabular format. Key concepts include:
FVG Data Aggregation and Display
The panel is designed to show at-a-glance information about the closest active FVG mitigation levels. It doesn't calculate these FVGs itself but relies on the main script to provide this data. The panel is structured with columns for timeframes (TF), Bullish FVGs, and Bearish FVGs, and rows for "Current" (LTF), "MTF" (Medium Timeframe), and "HTF" (High Timeframe).
The `panelData` User-Defined Type (UDT)
To facilitate the transfer of information to be displayed, the library defines a UDT named `panelData`. This structure is central to the library's operation and is designed to hold all necessary values for populating the panel's data cells for each relevant FVG. Its fields include:
Price levels for the nearest bullish and bearish FVGs for LTF, MTF, and HTF (e.g., `nearestBullMitLvl`, `nearestMtfBearMitLvl`).
Boolean flags to indicate if these FVGs are classified as "Large Volume" (LV) (e.g., `isNearestBullLV`, `isNearestMtfBearLV`).
Color information for the background and text of each data cell, allowing for conditional styling based on the FVG's status or proximity (e.g., `ltfBullBgColor`, `mtfBearTextColor`).
The design of `panelData` allows the main script to prepare all display-related data and styling cues in one object, which is then passed to the `updatePanel` function for rendering. This separation of data preparation and display logic keeps the library focused on its presentation task.
Visual Cues and Formatting
Price Formatting: Price levels are formatted to match the instrument's minimum tick size using an internal `formatPrice` helper function, ensuring consistent and accurate display.
Large FVG Icon: If an FVG is marked as a "Large Volume" FVG in the `panelData` object, a user-specified icon (e.g., an emoji) is prepended to its price level in the panel, providing an immediate visual distinction.
Conditional Styling: The background and text colors for each FVG level displayed in the panel can be individually controlled via the `panelData` object, enabling the main script to implement custom styling rules (e.g., highlighting the overall nearest FVG across all timeframes).
Handling Missing Data: If no FVG data is available for a particular cell (i.e., the corresponding level in `panelData` is `na`), the panel displays "---" and uses a specified background color for "Not Available" cells.
█ CALCULATIONS AND USE
Using the `FvgPanel` typically involves a two-stage process: initialization and dynamic updates.
Step 1: Panel Creation
First, an instance of the panel table is created once, usually during the script's initial setup. This is done using the `createPanel` function.
Call `createPanel()` with parameters defining its position on the chart, border color, border width, header background color, header text color, and header text size.
This function initializes the table with three columns ("TF", "Bull FVG", "Bear FVG") and three data rows labeled "Current", "MTF", and "HTF", plus a header row.
Store the returned `table` object in a `var` variable to persist it across bars.
// Example:
var table infoPanel = na
if barstate.isfirst
infoPanel := panel.createPanel(
position.top_right,
color.gray,
1,
color.new(color.gray, 50),
color.white,
size.small
)
Step 2: Panel Updates
On each bar, or whenever the FVG data changes (typically on `barstate.islast` or `barstate.isrealtime` for efficiency), the panel's content needs to be refreshed. This is done using the `updatePanel` function.
Populate an instance of the `panelData` UDT with the latest FVG information. This includes setting the nearest bullish/bearish mitigation levels for LTF, MTF, and HTF, their LV status, and their desired background and text colors.
Call `updatePanel()`, passing the persistent `table` object (from Step 1), the populated `panelData` object, the icon string for LV FVGs, the default text color for FVG levels, the background color for "N/A" cells, and the general text size for the data cells.
The `updatePanel` function will then clear previous data and fill the table cells with the new values and styles provided in the `panelData` object.
// Example (inside a conditional block like 'if barstate.islast'):
var panelData fvgDisplayData = panelData.new()
// ... (logic to populate fvgDisplayData fields) ...
// fvgDisplayData.nearestBullMitLvl = ...
// fvgDisplayData.ltfBullBgColor = ...
// ... etc.
if not na(infoPanel)
panel.updatePanel(
infoPanel,
fvgDisplayData,
"🔥", // LV FVG Icon
color.white,
color.new(color.gray, 70), // NA Cell Color
size.small
)
This workflow ensures that the panel is drawn only once and its cells are efficiently updated as new data becomes available.
█ NOTES
Data Source: This library is solely responsible for the visual presentation of FVG data in a table. It does not perform any FVG detection or calculation. The calling script must compute or retrieve the FVG levels, LV status, and desired styling to populate the `panelData` object.
Styling Responsibility: While `updatePanel` applies colors passed via the `panelData` object, the logic for *determining* those colors (e.g., highlighting the closest FVG to the current price) resides in the calling script.
Performance: The library uses `table.cell()` to update individual cells, which is generally more efficient than deleting and recreating the table on each update. However, the frequency of `updatePanel` calls should be managed by the main script (e.g., using `barstate.islast` or `barstate.isrealtime`) to avoid excessive processing on historical bars.
`series float` Handling: The price level fields within the `panelData` UDT (e.g., `nearestBullMitLvl`) can accept `series float` values, as these are typically derived from price data. The internal `formatPrice` function correctly handles `series float` for display.
Dependencies: The `FvgPanel` itself is self-contained and does not import other user libraries. It uses standard Pine Script™ table and string functionalities.
█ EXPORTED TYPES
panelData
Represents the data structure for populating the FVG information panel.
Fields:
nearestBullMitLvl (series float) : The price level of the nearest bullish FVG's mitigation point (bottom for bull) on the LTF.
isNearestBullLV (series bool) : True if the nearest bullish FVG on the LTF is a Large Volume FVG.
ltfBullBgColor (series color) : Background color for the LTF bullish FVG cell in the panel.
ltfBullTextColor (series color) : Text color for the LTF bullish FVG cell in the panel.
nearestBearMitLvl (series float) : The price level of the nearest bearish FVG's mitigation point (top for bear) on the LTF.
isNearestBearLV (series bool) : True if the nearest bearish FVG on the LTF is a Large Volume FVG.
ltfBearBgColor (series color) : Background color for the LTF bearish FVG cell in the panel.
ltfBearTextColor (series color) : Text color for the LTF bearish FVG cell in the panel.
nearestMtfBullMitLvl (series float) : The price level of the nearest bullish FVG's mitigation point on the MTF.
isNearestMtfBullLV (series bool) : True if the nearest bullish FVG on the MTF is a Large Volume FVG.
mtfBullBgColor (series color) : Background color for the MTF bullish FVG cell.
mtfBullTextColor (series color) : Text color for the MTF bullish FVG cell.
nearestMtfBearMitLvl (series float) : The price level of the nearest bearish FVG's mitigation point on the MTF.
isNearestMtfBearLV (series bool) : True if the nearest bearish FVG on the MTF is a Large Volume FVG.
mtfBearBgColor (series color) : Background color for the MTF bearish FVG cell.
mtfBearTextColor (series color) : Text color for the MTF bearish FVG cell.
nearestHtfBullMitLvl (series float) : The price level of the nearest bullish FVG's mitigation point on the HTF.
isNearestHtfBullLV (series bool) : True if the nearest bullish FVG on the HTF is a Large Volume FVG.
htfBullBgColor (series color) : Background color for the HTF bullish FVG cell.
htfBullTextColor (series color) : Text color for the HTF bullish FVG cell.
nearestHtfBearMitLvl (series float) : The price level of the nearest bearish FVG's mitigation point on the HTF.
isNearestHtfBearLV (series bool) : True if the nearest bearish FVG on the HTF is a Large Volume FVG.
htfBearBgColor (series color) : Background color for the HTF bearish FVG cell.
htfBearTextColor (series color) : Text color for the HTF bearish FVG cell.
█ EXPORTED FUNCTIONS
createPanel(position, borderColor, borderWidth, headerBgColor, headerTextColor, headerTextSize)
Creates and initializes the FVG information panel (table). Sets up the header rows and timeframe labels.
Parameters:
position (simple string) : The position of the panel on the chart (e.g., position.top_right). Uses position.* constants.
borderColor (simple color) : The color of the panel's border.
borderWidth (simple int) : The width of the panel's border.
headerBgColor (simple color) : The background color for the header cells.
headerTextColor (simple color) : The text color for the header cells.
headerTextSize (simple string) : The text size for the header cells (e.g., size.small). Uses size.* constants.
Returns: The newly created table object representing the panel.
updatePanel(panelTable, data, lvIcon, defaultTextColor, naCellColor, textSize)
Updates the content of the FVG information panel with the latest FVG data.
Parameters:
panelTable (table) : The table object representing the panel to be updated.
data (panelData) : An object containing the FVG data to display.
lvIcon (simple string) : The icon (e.g., emoji) to display next to Large Volume FVGs.
defaultTextColor (simple color) : The default text color for FVG levels if not highlighted.
naCellColor (simple color) : The background color for cells where no FVG data is available ("---").
textSize (simple string) : The text size for the FVG level data (e.g., size.small).
Returns: _void

FvgObject█ OVERVIEW
This library provides a suite of methods designed to manage the visual representation and lifecycle of Fair Value Gap (FVG) objects on a Pine Script™ chart. It extends the `fvgObject` User-Defined Type (UDT) by attaching object-oriented functionalities for drawing, updating, and deleting FVG-related graphical elements. The primary goal is to encapsulate complex drawing logic, making the main indicator script cleaner and more focused on FVG detection and state management.
█ CONCEPTS
This library is built around the idea of treating each Fair Value Gap as an "object" with its own visual lifecycle on the chart. This is achieved by defining methods that operate directly on instances of the `fvgObject` UDT.
Object-Oriented Approach for FVGs
Pine Script™ v6 introduced the ability to define methods for User-Defined Types (UDTs). This library leverages this feature by attaching specific drawing and state management functions (methods) directly to the `fvgObject` type. This means that instead of calling global functions with an FVG object as a parameter, you call methods *on* the FVG object itself (e.g., `myFvg.updateDrawings(...)`). This approach promotes better code organization and a more intuitive way to interact with FVG data.
FVG Visual Lifecycle Management
The core purpose of this library is to manage the complete visual journey of an FVG on the chart. This lifecycle includes:
Initial Drawing: Creating the first visual representation of a newly detected FVG, including its main box and optionally its midline and labels.
State Updates & Partial Fills: Modifying the FVG's appearance as it gets partially filled by price. This involves drawing a "mitigated" portion of the box and adjusting the `currentTop` or `currentBottom` of the remaining FVG.
Full Mitigation & Tested State: Handling how an FVG is displayed once fully mitigated. Depending on user settings, it might be hidden, or its box might change color/style to indicate it has been "tested." Mitigation lines can also be managed (kept or deleted).
Midline Interaction: Visually tracking if the price has touched the FVG's 50% equilibrium level (midline).
Visibility Control: Dynamically showing or hiding FVG drawings based on various criteria, such as user settings (e.g., hide mitigated FVGs, timeframe-specific visibility) or external filters (e.g., proximity to current price).
Deletion: Cleaning up all drawing objects associated with an FVG when it's no longer needed or when settings dictate its removal.
Centralized Drawing Logic
By encapsulating all drawing-related operations within the methods of this library, the main indicator script is significantly simplified. The main script can focus on detecting FVGs and managing their state (e.g., in arrays), while delegating the complex task of rendering and updating them on the chart to the methods herein.
Interaction with `fvgObject` and `drawSettings` UDTs
All methods within this library operate on an instance of the `fvgObject` UDT. This `fvgObject` holds not only the FVG's price/time data and state (like `isMitigated`, `currentTop`) but also the IDs of its associated drawing elements (e.g., `boxId`, `midLineId`).
The appearance of these drawings (colors, styles, visibility, etc.) is dictated by a `drawSettings` UDT instance, which is passed as a parameter to most drawing-related methods. This `drawSettings` object is typically populated from user inputs in the main script, allowing for extensive customization.
Stateful Drawing Object Management
The library's methods manage Pine Script™ drawing objects (boxes, lines, labels) by storing their IDs within the `fvgObject` itself (e.g., `fvgObject.boxId`, `fvgObject.mitigatedBoxId`, etc.). Methods like `draw()` create these objects and store their IDs, while methods like `updateDrawings()` modify them, and `deleteDrawings()` removes them using these stored IDs.
Drawing Optimization
The `updateDrawings()` method, which is the most comprehensive drawing management function, incorporates optimization logic. It uses `prev_*` fields within the `fvgObject` (e.g., `prevIsMitigated`, `prevCurrentTop`) to store the FVG's state from the previous bar. By comparing the current state with the previous state, and also considering changes in visibility or relevant drawing settings, it can avoid redundant and performance-intensive drawing operations if nothing visually significant has changed for that FVG.
█ METHOD USAGE AND WORKFLOW
The methods in this library are designed to be called in a logical sequence as an FVG progresses through its lifecycle. A crucial prerequisite for all visual methods in this library is a properly populated `drawSettings` UDT instance, which dictates every aspect of an FVG's appearance, from colors and styles to visibility and labels. This `settings` object must be carefully prepared in the main indicator script, typically based on user inputs, before being passed to these methods.
Here’s a typical workflow within a main indicator script:
1. FVG Instance Creation (External to this library)
An `fvgObject` instance is typically created by functions in another library (e.g., `FvgCalculations`) when a new FVG pattern is identified. This object will have its core properties (top, bottom, startTime, isBullish, tfType) initialized.
2. Initial Drawing (`draw` method)
Once a new `fvgObject` is created and its initial visibility is determined:
Call the `myFvg.draw(settings)` method on the new FVG object.
`settings` is an instance of the `drawSettings` UDT, containing all relevant visual configurations.
This method draws the primary FVG box, its midline (if enabled in `settings`), and any initial labels. It also initializes the `currentTop` and `currentBottom` fields of the `fvgObject` if they are `na`, and stores the IDs of the created drawing objects within the `fvgObject`.
3. Per-Bar State Updates & Interaction Checks
On each subsequent bar, for every active `fvgObject`:
Interaction Check (External Logic): It's common to first use logic (e.g., from `FvgCalculations`' `fvgInteractionCheck` function) to determine if the current bar's price interacts with the FVG.
State Field Updates (External Logic): Before calling the `FvgObjectLib` methods below, ensure that your `fvgObject`'s state fields (such as `isMitigated`, `currentTop`, `currentBottom`, `isMidlineTouched`) are updated using the current bar's price data and relevant functions from other libraries (e.g., `FvgCalculations`' `checkMitigation`, `checkPartialMitigation`, etc.). This library's methods render the FVG based on these pre-updated state fields.
If interaction occurs and the FVG is not yet fully mitigated:
Full Mitigation Update (`updateMitigation` method): Call `myFvg.updateMitigation(high, low)`. This method updates `myFvg.isMitigated` and `myFvg.mitigationTime` if full mitigation occurs, based on the interaction determined by external logic.
Partial Fill Update (`updatePartialFill` method): If not fully mitigated, call `myFvg.updatePartialFill(high, low, settings)`. This method updates `myFvg.currentTop` or `myFvg.currentBottom` and adjusts drawings to show the filled portion, again based on prior interaction checks and fill level calculations.
Midline Touch Check (`checkMidlineTouch` method): Call `myFvg.checkMidlineTouch(high, low)`. This method updates `myFvg.isMidlineTouched` if the price touches the FVG's 50% level.
4. Comprehensive Visual Update (`updateDrawings` method)
After the FVG's state fields have been potentially updated by external logic and the methods in step 3:
Call `myFvg.updateDrawings(isVisibleNow, settings)` on each FVG object.
`isVisibleNow` is a boolean indicating if the FVG should currently be visible.
`settings` is the `drawSettings` UDT instance.
This method synchronizes the FVG's visual appearance with its current state and settings, managing all drawing elements (boxes, lines, labels), their styles, and visibility. It efficiently skips redundant drawing operations if the FVG's state or visibility has not changed, thanks to its internal optimization using `prev_*` fields, which are also updated by this method.
5. Deleting Drawings (`deleteDrawings` method)
When an FVG object is no longer tracked:
Call `myFvg.deleteDrawings(deleteTestedToo)`.
This method removes all drawing objects associated with that `fvgObject`.
This workflow ensures that FVG visuals are accurately maintained throughout their existence on the chart.
█ NOTES
Dependencies: This library relies on `FvgTypes` for `fvgObject` and `drawSettings` definitions, and its methods (`updateMitigation`, `updatePartialFill`) internally call functions from `FvgCalculations`.
Drawing Object Management: Be mindful of TradingView's limits on drawing objects per script. The main script should manage the number of active FVG objects.
Performance and `updateDrawings()`: The `updateDrawings()` method is comprehensive. Its internal optimization (checking `hasStateChanged` based on `prev_*` fields) is crucial for performance. Call it judiciously.
Role of `settings.currentTime`: The `currentTime` field in `drawSettings` is key for positioning time-dependent elements like labels and the right edge of non-extended drawings.
Mutability of `fvgObject` Instances: Methods in this library directly modify the `fvgObject` instance they are called upon (e.g., its state fields and drawing IDs).
Drawing ID Checks: Methods generally check if drawing IDs are `na` before acting on them, preventing runtime errors.
█ EXPORTED FUNCTIONS
method draw(this, settings)
Draws the initial visual representation of the FVG object on the chart. This includes the main FVG box, its midline (if enabled), and a label
(if enabled for the specific timeframe). This method is typically invoked
immediately after an FVG is first detected and its initial properties are set. It uses drawing settings to customize the appearance based on the FVG's timeframe type.
Namespace types: types.fvgObject
Parameters:
this (fvgObject type from no1x/FvgTypes/1) : The FVG object instance to be drawn. Core properties (top, bottom,
startTime, isBullish, tfType) should be pre-initialized. This method will
initialize boxId, midLineId, boxLabelId (if applicable), and
currentTop/currentBottom (if currently na) on this object.
settings (drawSettings type from no1x/FvgTypes/1) : A drawSettings object providing all visual parameters. Reads display settings (colors, styles, visibility for boxes, midlines, labels,
box extension) relevant to this.tfType. settings.currentTime is used for
positioning labels and the right boundary of non-extended boxes.
method updateMitigation(this, highVal, lowVal)
Checks if the FVG has been fully mitigated by the current bar's price action.
Namespace types: types.fvgObject
Parameters:
this (fvgObject type from no1x/FvgTypes/1) : The FVG object instance. Reads this.isMitigated, this.isVisible,
this.isBullish, this.top, this.bottom. Updates this.isMitigated and
this.mitigationTime if full mitigation occurs.
highVal (float) : The high price of the current bar, used for mitigation check.
lowVal (float) : The low price of the current bar, used for mitigation check.
method updatePartialFill(this, highVal, lowVal, settings)
Checks for and processes partial fills of the FVG.
Namespace types: types.fvgObject
Parameters:
this (fvgObject type from no1x/FvgTypes/1) : The FVG object instance. Reads this.isMitigated, this.isVisible,
this.isBullish, this.currentTop, this.currentBottom, original this.top/this.bottom,
this.startTime, this.tfType, this.isLV. Updates this.currentTop or
this.currentBottom, creates/updates this.mitigatedBoxId, and may update this.boxId's
top/bottom to reflect the filled portion.
highVal (float) : The high price of the current bar, used for partial fill check.
lowVal (float) : The low price of the current bar, used for partial fill check.
settings (drawSettings type from no1x/FvgTypes/1) : The drawing settings. Reads timeframe-specific colors for mitigated
boxes (e.g., settings.mitigatedBullBoxColor, settings.mitigatedLvBullColor),
box extension settings (settings.shouldExtendBoxes, settings.shouldExtendMtfBoxes, etc.),
and settings.currentTime to style and position the mitigatedBoxId and potentially adjust the main boxId.
method checkMidlineTouch(this, highVal, lowVal)
Checks if the FVG's midline (50% level or Equilibrium) has been touched.
Namespace types: types.fvgObject
Parameters:
this (fvgObject type from no1x/FvgTypes/1) : The FVG object instance. Reads this.midLineId, this.isMidlineTouched,
this.top, this.bottom. Updates this.isMidlineTouched if a touch occurs.
highVal (float) : The high price of the current bar, used for midline touch check.
lowVal (float) : The low price of the current bar, used for midline touch check.
method deleteDrawings(this, deleteTestedToo)
Deletes all visual drawing objects associated with this FVG object.
Namespace types: types.fvgObject
Parameters:
this (fvgObject type from no1x/FvgTypes/1) : The FVG object instance. Deletes drawings referenced by boxId,
mitigatedBoxId, midLineId, mitLineId, boxLabelId, mitLineLabelId,
and potentially testedBoxId, keptMitLineId. Sets these ID fields to na.
deleteTestedToo (simple bool) : If true, also deletes drawings for "tested" FVGs
(i.e., testedBoxId and keptMitLineId).
method updateDrawings(this, isVisibleNow, settings)
Manages the comprehensive update of all visual elements of an FVG object
based on its current state (e.g., active, mitigated, partially filled) and visibility. It handles the drawing, updating, or deletion of FVG boxes (main and mitigated part),
midlines, mitigation lines, and their associated labels. Visibility is determined by the isVisibleNow parameter and relevant settings
(like settings.shouldHideMitigated or timeframe-specific show flags). This method is central to the FVG's visual lifecycle and includes optimization
to avoid redundant drawing operations if the FVG's relevant state or appearance
settings have not changed since the last bar. It also updates the FVG object's internal prev_* state fields for future optimization checks.
Namespace types: types.fvgObject
Parameters:
this (fvgObject type from no1x/FvgTypes/1) : The FVG object instance to update. Reads most state fields (e.g.,
isMitigated, currentTop, tfType, etc.) and updates all drawing ID fields
(boxId, midLineId, etc.), this.isVisible, and all this.prev_* state fields.
isVisibleNow (bool) : A flag indicating whether the FVG should be currently visible. Typically determined by external logic (e.g., visual range filter). Affects
whether active FVG drawings are created/updated or deleted by this method.
settings (drawSettings type from no1x/FvgTypes/1) : A fully populated drawSettings object. This method extensively
reads its fields (colors, styles, visibility toggles, timeframe strings, etc.)
to render FVG components according to this.tfType and current state. settings.currentTime is critical for positioning elements like labels and extending drawings.

MonthlyPnLTableLibrary "MonthlyPnLTable"
monthlyPnL(currentClose, initialOpenPrice, monthsToDisplay)
Parameters:
currentClose (float)
initialOpenPrice (float)
monthsToDisplay (int)
displayPnLTable(pnls, pnlMonths, pnlYears, textSizeOption, labelColor)
Parameters:
pnls (array)
pnlMonths (array)
pnlYears (array)
textSizeOption (string)
labelColor (color)
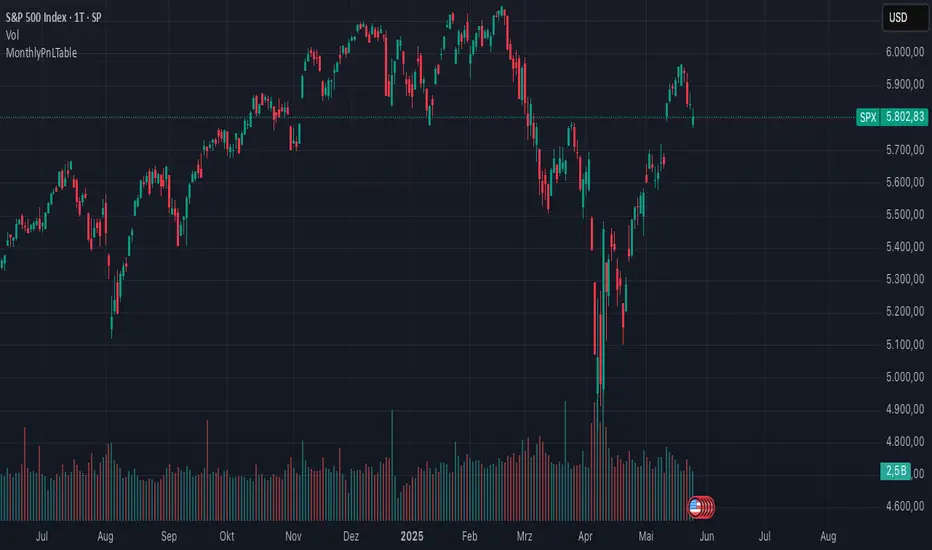
VolumeFlowOscillatorLibVolume Flow Oscillator Library
Overview
The Volume Flow Oscillator library provides a comprehensive framework for analyzing directional volume flow in financial markets. It creates a multi-band oscillator system that transforms price and volume data into a spectrum of sensitivity bands, revealing the underlying buying and selling pressure.
Technical Approach
The library combines price direction with trading volume to generate an oscillator that fluctuates around a zero line, with positive values indicating buying pressure and negative values showing selling pressure. Using sophisticated ALMA (Arnaud Legoux Moving Average) smoothing techniques with asymmetric sensitivity, the library creates seven distinct bands that help identify various intensity levels of volume flow.
Key Features
Multi-band oscillator system with seven sensitivity levels
Directional volume flow analysis combining price movement and volume
Zero-line oscillation showing the balance between buying and selling pressure
Asymmetric ALMA smoothing for different sensitivity on positive/negative bands
Customizable lookback periods and multipliers for fine-tuning
Color-coded visualization for intuitive chart reading
Applications
This library offers developers a versatile foundation for creating volume-based indicators that go beyond simple volume measurement to reveal the directional force behind market movements. Ideal for confirming price trends, detecting divergences, identifying volume climaxes, and assessing overall market strength.
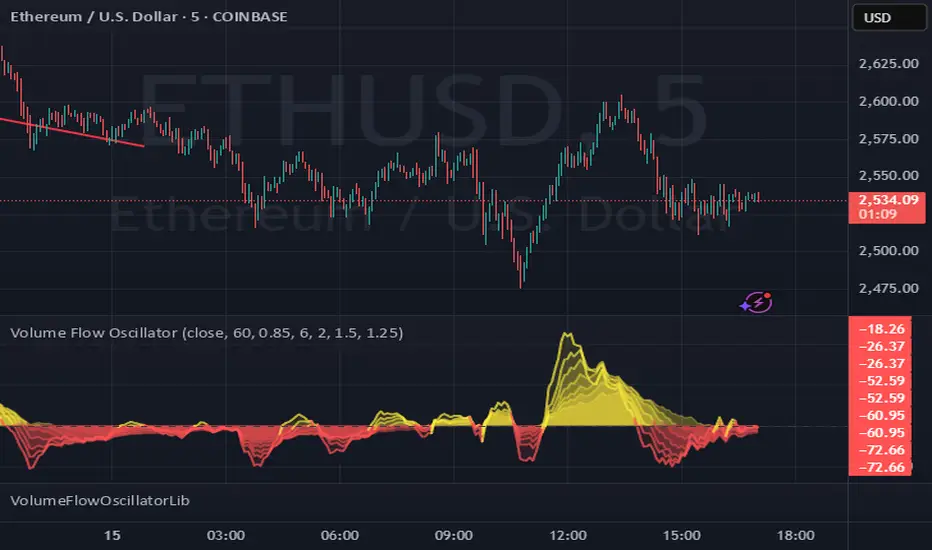
StrategyUtilsLibrary "StrategyUtils"
getHeikinAshi(open, high, low, close)
getHeikinAshi
Parameters:
open (float) : float: Raw open price
high (float) : float: Raw high price
low (float) : float: Raw low price
close (float) : float: Raw close price
Returns: tuple of haOpen, haClose, haHigh, haLow
getFibExtensions(high, low)
getFibExtensions
Parameters:
high (float) : float: Highest point before trade
low (float) : float: Lowest point before trade
Returns: tuple of extension levels
inBacktestWindow(time, start, end)
inBacktestWindow
Parameters:
time (int) : int: Current bar time
start (int) : int: Start timestamp
end (int) : int: End timestamp
Returns: bool: true if within Fbrange
getCurrentState(buy, sell)
getCurrentState
Parameters:
buy (bool) : bool: Buy signal condition
sell (bool) : bool: Sell signal condition
Returns: string: "Buy", "Sell", or "None"
formatPrice(price)
formatPrice
Parameters:
price (float) : float: Input price value
Returns: string: Formatted price string
getColorByProfit(netprofit, initial, green, red)
getColorByProfit
Parameters:
netprofit (float) : float: Strategy net profit
initial (float) : float: Initial capital
green (color) : color: Positive color
red (color) : color: Negative color
Returns: color: Display color based on PnL
UTSConvenienceToolsLibrary "UTSConvenienceTools"
Convenience tool library containing helper functions for drawing and charting.
isDarkColor(color)
Determines on base of the luminance of the given color if the color can be considered a 'dark' color. Usefull for determining the readable font color for arbitrary colored backgrounds. Credits out to:
Parameters:
color (color) : (color): The actual color value.
Returns: (bool): A boolean value.
smallLabelLowerRight(txt, yPos, bgColor)
Displays the specified `txt` in a small label at the `yPos` of the current bar. The label points to the lower right.
Parameters:
txt (string)
yPos (float) : (float): The y-position value. To have it positioned above the candle pass 'high'.
bgColor (color) : (color): The background color value.
Returns: (bool): A boolean value.
smallLabelUpperRight(txt, yPos, bgColor)
Displays the specified `txt` in a small label at the `yPos` of the current bar. The label points to the upper right.
Parameters:
txt (string)
yPos (float) : (float): The y-position value. To have it positioned below the candle pass 'low'.
bgColor (color) : (color): The background color value.
Returns: (bool): A boolean value.
smallLabelCenter(txt, yPos, bgColor)
Displays the specified `txt` in a small label at the `yPos` of the current bar. The label points to the center.
Parameters:
txt (string)
yPos (float) : (float): The y-position value. To have it positioned above the candle pass 'high'. To have it positioned below the candle pass 'low'.
bgColor (color) : (color): The background color value.
Returns: (bool): A boolean value.
smallLabelDown(txt, yPos, bgColor)
Displays the specified `txt` in a small label at the `yPos` of the current bar. The label points down.
Parameters:
txt (string)
yPos (float) : (float): The y-position value. To have it positioned above the candle pass 'high'.
bgColor (color) : (color): The background color value.
Returns: (bool): A boolean value.
smallLabelUp(txt, yPos, bgColor)
Displays the specified `txt` in a small label at the `yPos` of the current bar. The label points down.
Parameters:
txt (string)
yPos (float) : (float): The y-position value. To have it positioned below the candle pass 'low'.
bgColor (color) : (color): The background color value.
Returns: (bool): A boolean value.
normalLabelLowerRight(txt, yPos, bgColor)
Displays the specified `txt` in a normal label at the `yPos` of the current bar. The label points to the lower right.
Parameters:
txt (string)
yPos (float) : (float): The y-position value. To have it positioned above the candle pass 'high'.
bgColor (color) : (color): The background color value.
Returns: (bool): A boolean value.
normalLabelUpperRight(txt, yPos, bgColor)
Displays the specified `txt` in a normal label at the `yPos` of the current bar. The label points to the upper right.
Parameters:
txt (string)
yPos (float) : (float): The y-position value. To have it positioned below the candle pass 'low'.
bgColor (color) : (color): The background color value.
Returns: (bool): A boolean value.
normalLabelCenter(txt, yPos, bgColor)
Displays the specified `txt` in a normal label at the `yPos` of the current bar. The label points to the center.
Parameters:
txt (string)
yPos (float) : (float): The y-position value. To have it positioned above the candle pass 'high'. To have it positioned below the candle pass 'low'.
bgColor (color) : (color): The background color value.
Returns: (bool): A boolean value.
normalLabelDown(txt, yPos, bgColor)
Displays the specified `txt` in a normal label at the `yPos` of the current bar. The label points down.
Parameters:
txt (string)
yPos (float) : (float): The y-position value. To have it positioned above the candle pass 'high'.
bgColor (color) : (color): The background color value.
Returns: (bool): A boolean value.
normalLabelUp(txt, yPos, bgColor)
Displays the specified `txt` in a normal label at the `yPos` of the current bar. The label points down.
Parameters:
txt (string)
yPos (float) : (float): The y-position value. To have it positioned below the candle pass 'low'.
bgColor (color) : (color): The background color value.
Returns: (bool): A boolean value.
largeLabelLowerRight(txt, yPos, bgColor)
Displays the specified `txt` in a large label at the `yPos` of the current bar. The label points to the lower right.
Parameters:
txt (string)
yPos (float) : (float): The y-position value. To have it positioned above the candle pass 'high'.
bgColor (color) : (color): The background color value.
Returns: (bool): A boolean value.
largeLabelUpperRight(txt, yPos, bgColor)
Displays the specified `txt` in a large label at the `yPos` of the current bar. The label points to the upper right.
Parameters:
txt (string)
yPos (float) : (float): The y-position value. To have it positioned below the candle pass 'low'.
bgColor (color) : (color): The background color value.
Returns: (bool): A boolean value.
largeLabelCenter(txt, yPos, bgColor)
Displays the specified `txt` in a large label at the `yPos` of the current bar. The label points to the center.
Parameters:
txt (string)
yPos (float) : (float): The y-position value. To have it positioned above the candle pass 'high'. To have it positioned below the candle pass 'low'.
bgColor (color) : (color): The background color value.
Returns: (bool): A boolean value.
largeLabelDown(txt, yPos, bgColor)
Displays the specified `txt` in a large label at the `yPos` of the current bar. The label points down.
Parameters:
txt (string)
yPos (float) : (float): The y-position value. To have it positioned above the candle pass 'high'.
bgColor (color) : (color): The background color value.
Returns: (bool): A boolean value.
largeLabelUp(txt, yPos, bgColor)
Displays the specified `txt` in a large label at the `yPos` of the current bar. The label points down.
Parameters:
txt (string)
yPos (float) : (float): The y-position value. To have it positioned below the candle pass 'low'.
bgColor (color) : (color): The background color value.
Returns: (bool): A boolean value.
autoLabelLowerRight(txt, yPos, bgColor)
Displays the specified `txt` in a auto label at the `yPos` of the current bar. The label points to the lower right.
Parameters:
txt (string)
yPos (float) : (float): The y-position value. To have it positioned above the candle pass 'high'.
bgColor (color) : (color): The background color value.
Returns: (bool): A boolean value.
autoLabelUpperRight(txt, yPos, bgColor)
Displays the specified `txt` in a auto label at the `yPos` of the current bar. The label points to the upper right.
Parameters:
txt (string)
yPos (float) : (float): The y-position value. To have it positioned below the candle pass 'low'.
bgColor (color) : (color): The background color value.
Returns: (bool): A boolean value.
autoLabelCenter(txt, yPos, bgColor)
Displays the specified `txt` in a auto label at the `yPos` of the current bar. The label points to the center.
Parameters:
txt (string)
yPos (float) : (float): The y-position value. To have it positioned above the candle pass 'high'. To have it positioned below the candle pass 'low'.
bgColor (color) : (color): The background color value.
Returns: (bool): A boolean value.
autoLabelDown(txt, yPos, bgColor)
Displays the specified `txt` in a auto label at the `yPos` of the current bar. The label points down.
Parameters:
txt (string)
yPos (float) : (float): The y-position value. To have it positioned above the candle pass 'high'.
bgColor (color) : (color): The background color value.
Returns: (bool): A boolean value.
autoLabelUp(txt, yPos, bgColor)
Displays the specified `txt` in a auto label at the `yPos` of the current bar. The label points down.
Parameters:
txt (string)
yPos (float) : (float): The y-position value. To have it positioned below the candle pass 'low'.
bgColor (color) : (color): The background color value.
Returns: (bool): A boolean value.