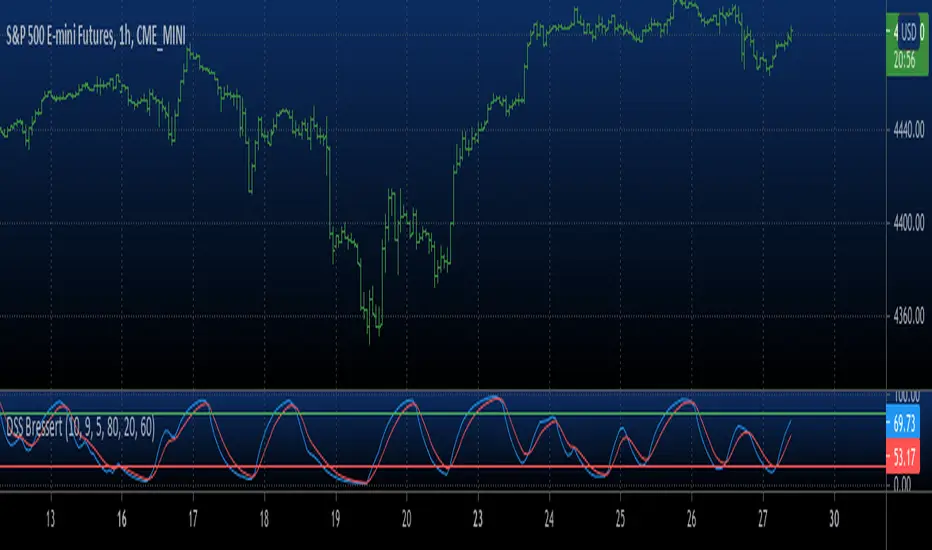
Robby DSS Bressert Colored DotsIntroduction
The Robby DSS Bressert Colored Dots is a technical analysis tool designed to measure momentum and identify potential overbought or oversold conditions in a market. It is a visually enhanced version of the Double Smoothed Stochastic (DSS) indicator, which was developed to be a smoother and more responsive version of the traditional Stochastic Oscillator.
This specific version provides at-a-glance information about momentum shifts through the use of colored dots, making it easy to interpret.
The Core Engine: DSS Bressert
The foundation of this indicator is the Double Smoothed Stochastic, a concept attributed to both William Blau and Walter Bressert, who introduced similar ideas. The goal of the DSS is to filter out the "noise" and false signals common in standard oscillators without introducing significant lag.
It achieves this through a two-step smoothing process:
First Smoothing: A standard Stochastic value is calculated based on the price. This value is then smoothed using an Exponential Moving Average (EMA). This creates a cleaner, less erratic line than the raw stochastic.
Second Smoothing: The indicator then takes this newly smoothed line and performs a second Stochastic calculation on it. This result is then smoothed one final time with another EMA.
This double-application of smoothing results in a very clean oscillator line that reacts quickly to price changes but is less prone to whipsaws.
The Visual Modification: "Robby" Colored Dots
The "Robby DSS Bressert Colored Dots" version takes the powerful DSS calculation and adds a unique visual layer for easier interpretation.
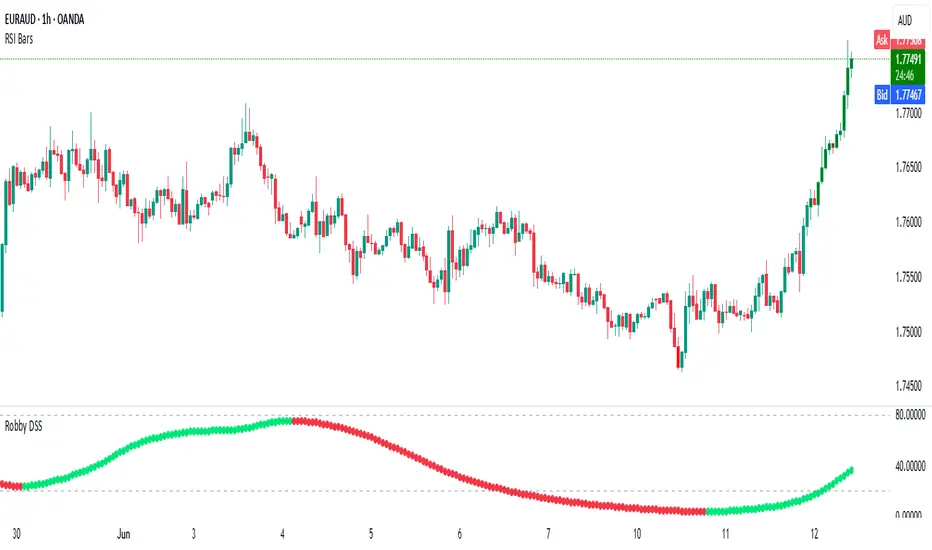
Colored Dots: Instead of plotting a continuous line, the indicator displays a dot for each candle. The color of this dot instantly tells you about the indicator's momentum:
Lime/Green dots appear when the DSS value is rising, indicating bullish or positive momentum.
Red dots appear when the DSS value is falling, indicating bearish or negative momentum.
If the value is unchanged, the dot retains the color of the previous one.
The "Robby" Name: In trading communities like Forex Factory and MQL5, it's common for programmers to modify popular indicators. These enhanced versions are often named after the member who created or popularized them. The "Robby" version specifically refers to this popular colored-dot modification of the DSS Bressert.
How to Interpret and Use It
Traders typically use the Robby DSS Bressert Colored Dots in a few key ways:
Momentum Shifts: The most straightforward signal is the change of dot color. A switch from red to lime can signal that downside momentum is waning and a potential move up is beginning. A switch from lime to red signals the opposite.
Overbought & Oversold Conditions: Like a standard stochastic, the indicator uses levels (typically 80 and 20).
When the dots are above 80, the market is considered overbought. A color change from lime to red in this zone can be a strong signal for a potential reversal down.
When the dots are below 20, the market is considered oversold. A color change from red to lime here can signal a potential reversal up.
Trend Confirmation: In a strong uptrend, traders might ignore red dots and use the appearance of lime dots in the oversold zone (or after a minor pullback) as a signal to join the trend. The opposite is true in a downtrend.
---
This is just an indicator that can found publicly online for mt4, and just translated it to Pinescript.
DSS
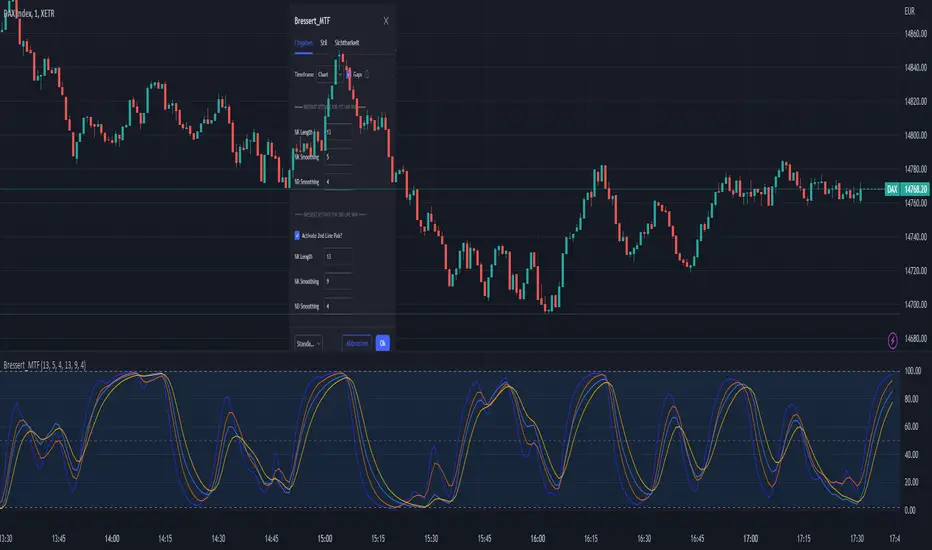
DSS Bressert Stochastic MTFDouble Smoothed Stochastics – DSS Bressert is an oscillator introduced by William Blau and Walter Bressert shortly after each other in two slightly different versions. The calculation of DSS Bressert values is similar to the stochastic indicator. The difference is the use of double exponential smoothing. The advantages over the classic stochastic oscillators are the fast response to price changes in a still very smooth pattern. In addition, the extreme zones at the other end of the scale are reached quite frequently, even in strong trends, resulting in many trend conforming signals. Double Smoothed Stochastics – DSS The Bressert values are the same as the stochastics – values above 80 indicate an overbought condition of the market, values below 20 indicate an oversold condition of the market.
This is a full implementation of the original Stochastic Calulation with Multi-Time-Frame options. Other available scrips are lagging here and messing MTF up...
This Scrip will plot 2 lines for the double smoothed Stochastic based on the original exponential calculation from Blau/Bressert. Whilst the original stochastic is only simple moving average.
If you are a daytrader or scalper, the script is able to show a slow line and a fast line pair. Preferred Settings are embedded as screenshot.
"DSS" Bessert Double Smooth Stochastic Alma Variant Hi colleagues I share this time DSS bressert.
As usual they have all the adjustable colors and signals. I hope you enjoy them and leave here below the length of signals that best suit your needs so that we can continue sharing content
Description
One after the other, William Blau and Walter Bressert each presented a version of the Double Smoothed Stochastics. Two exponentially smoothed MAs are used to even out the input values (H, L and C), in a similar way to the well-known stochastic formula.
Parameters
The adjustable period length can be chosen from 2 to 500. The most common settings will have a period length ranging from 5 to 30. In addition, the indicator can be smoothed in the interval from 1 to 50. Meaningful smoothing values lie in the short-term range.
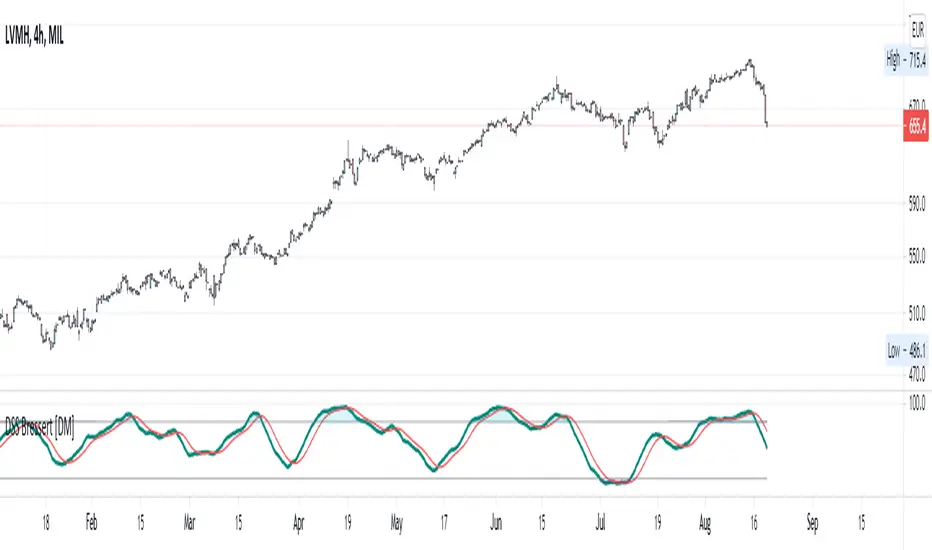
Interpretation
The application of the DSS is comparable with that of the stochastic method. Accordingly, values above 70 or 80 must be regarded as overbought and values below 20 or 30 as oversold. A rise of the DSS above its center line should be viewed as bullish, and a fall of the DSS below its center line as bearish.
/// Quick Explained ALMA ///
//Window size: The window size is the look-back period and it is a basic setting of ALMA.
//Experienced traders can change this setting according to their preference.
//But if you are using this indicator for the first time, it is recommended to go with the default setting.
//Offset: The offset value is used to tweak the ALMA so that it will be more inclined
//towards responsiveness or smoothness. You can set the offset in decimals between the 0 to1.
//The value of 0.01 makes it smoother, while a setting of 0.99 makes the indicator more responsive.
//Sigma: The sigma is used for the filter. Any value less than 6 makes the indicator
//more focused, whereas the setting of 6 makes the filter large. According to Mr Arnaud,
//a sigma value of 6 is offer good performance.
/// Explain DSS ///
//Parameters
//The adjustable period length can be chosen from 2 to 500.
//The most common settings will have a period length ranging from 5 to 30.
//In addition, the indicator can be smoothed in the interval from 1 to 50.
//Meaningful smoothing values lie in the short-term range.
//Interpretation
//The application of the DSS is comparable with that of the stochastic method.
//Accordingly, values above 70 or 80 must be regarded as overbought and values below 20 or 30 as oversold.
//A rise of the DSS above its center line should be viewed as bullish,
//and a fall of the DSS below its center line as bearish
/// End Of The Code///
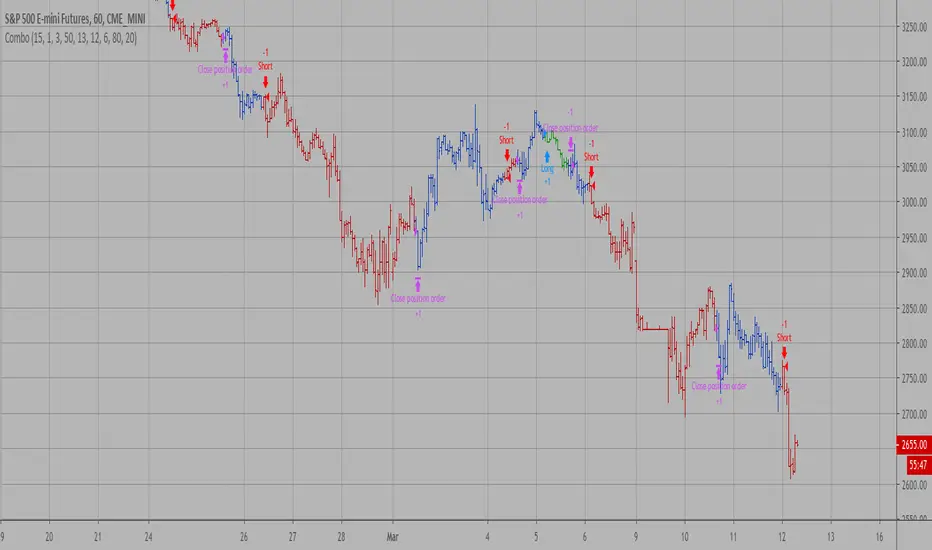
Combo Backtest 123 Reversal & DSS Bressert This is combo strategies for get a cumulative signal.
First strategy
This System was created from the Book "How I Tripled My Money In The
Futures Market" by Ulf Jensen, Page 183. This is reverse type of strategies.
The strategy buys at market, if close price is higher than the previous close
during 2 days and the meaning of 9-days Stochastic Slow Oscillator is lower than 50.
The strategy sells at market, if close price is lower than the previous close price
during 2 days and the meaning of 9-days Stochastic Fast Oscillator is higher than 50.
Second strategy
Double Smoothed Stochastics (DSS) is designed by William Blaw.
It attempts to combine moving average methods with oscillator principles.
WARNING:
- For purpose educate only
- This script to change bars colors.
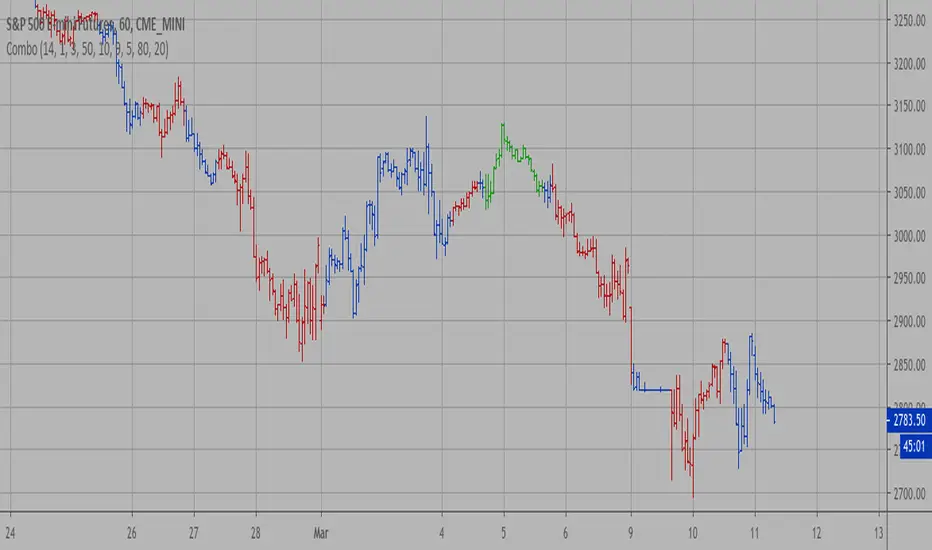
Combo Strategy 123 Reversal & DSS Bressert This is combo strategies for get a cumulative signal.
First strategy
This System was created from the Book "How I Tripled My Money In The
Futures Market" by Ulf Jensen, Page 183. This is reverse type of strategies.
The strategy buys at market, if close price is higher than the previous close
during 2 days and the meaning of 9-days Stochastic Slow Oscillator is lower than 50.
The strategy sells at market, if close price is lower than the previous close price
during 2 days and the meaning of 9-days Stochastic Fast Oscillator is higher than 50.
Second strategy
Double Smoothed Stochastics (DSS) is designed by William Blaw.
It attempts to combine moving average methods with oscillator principles.
WARNING:
- For purpose educate only
- This script to change bars colors.
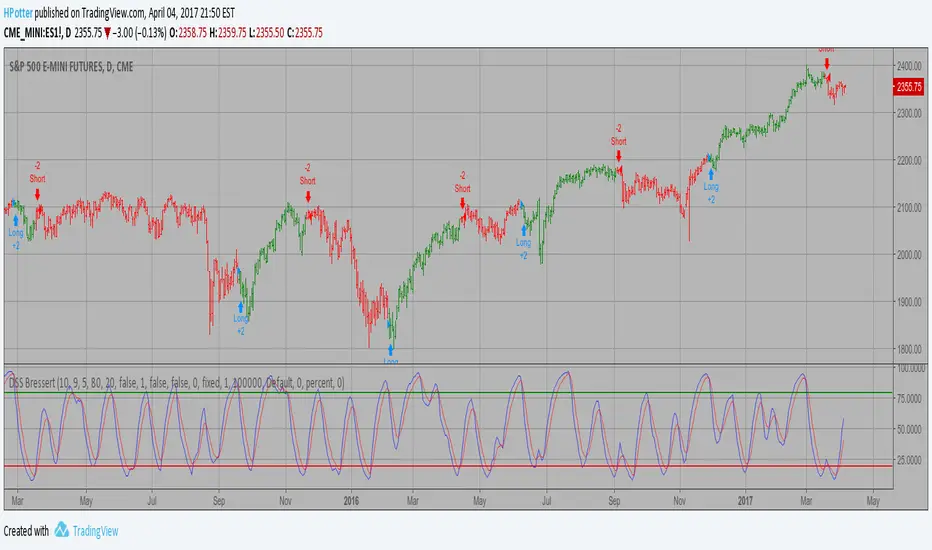
DSS Bressert (Double Smoothed Stochastic) Strategy Backtest Double Smoothed Stochastics (DSS) is designed by William Blaw.
It attempts to combine moving average methods with oscillator principles.
You can change long to short in the Input Settings
Please, use it only for learning or paper trading. Do not for real trading.
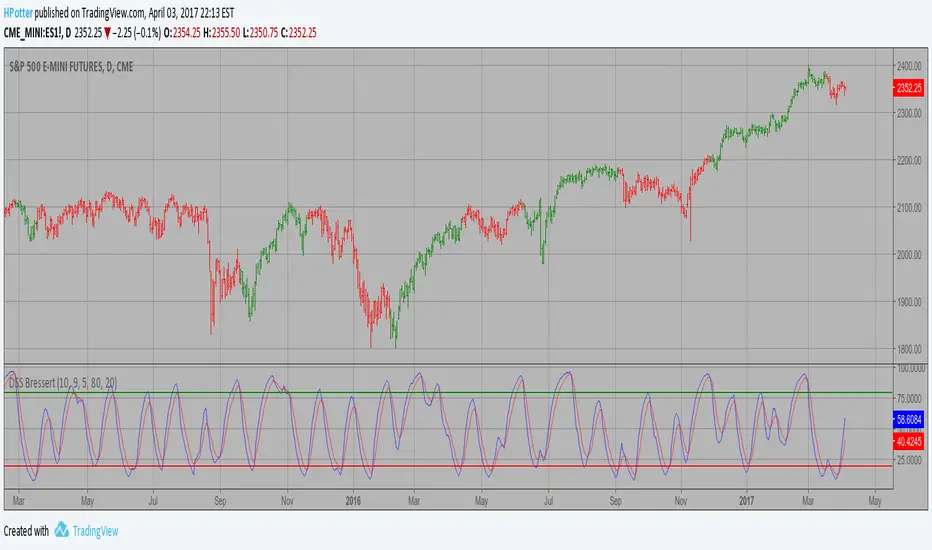
DSS Bressert (Double Smoothed Stochastic) Strategy Double Smoothed Stochastics (DSS) is designed by William Blaw.
It attempts to combine moving average methods with oscillator principles.
DSS Bressert (Double Smoothed Stochastic)Hi
Let me introduce my DSS Bressert (Double Smoothed Stochastic) script.
Double Smoothed Stochastics (DSS) is designed by William Blaw.
It attempts to combine moving average methods with oscillator principles.