WaveRider Momentum OscillatorWaveRider Momentum Oscillator
The WaveRider Momentum Oscillator applies principles inspired by fluid dynamics to model price momentum as a flowing system, rather than relying on traditional static calculations. By interpreting market movement through the lens of velocity, viscosity, and turbulence—core concepts in fluid mechanics—this indicator offers a more adaptive and nuanced view of momentum that adjusts dynamically to changing market conditions.
Conceptual Foundation
Velocity: Just as fluid velocity measures the speed of flow at a point, WaveRider calculates momentum velocity by measuring the rate of price change over a specified period, smoothed to reduce noise.
Viscosity: In fluid dynamics, viscosity represents internal friction that resists flow. Here, viscosity is modeled based on volatility, modulating momentum signals to account for the “thickness” or noise level of the market. High volatility increases viscosity’s damping effect, reducing false signals during turbulent price action.
Turbulence: Turbulence characterizes sudden, chaotic changes in fluid flow. WaveRider detects rapid acceleration bursts in momentum analogous to turbulence, highlighting moments when momentum is shifting sharply and potentially signaling strong upcoming price moves.
Technical Features and Interpretation
Adaptive Momentum Calculation: Momentum is scaled by volatility-adjusted viscosity, making the oscillator less prone to whipsaws and more responsive during stable trends.
Turbulence Burst Detection: The oscillator incorporates a turbulence factor, identifying abrupt momentum accelerations that traditional oscillators often miss. This feature provides early warning signals of potential breakout or reversal points.
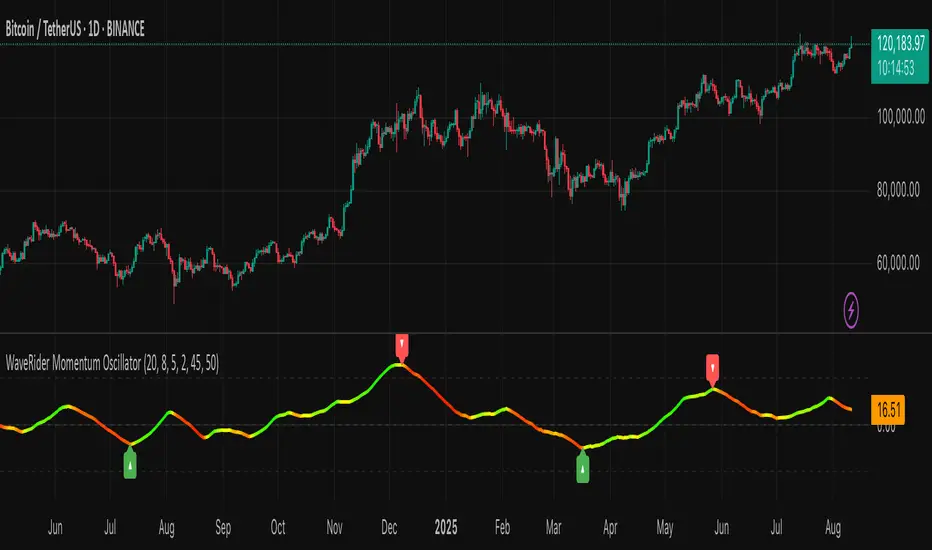
HSV Gradient Color Mapping: The oscillator visualizes acceleration using a continuous hue gradient—ranging from red (deceleration) through yellow (neutral) to green (acceleration). This continuous color transition provides intuitive, real-time insight into momentum dynamics beyond mere numeric values.
Pivot Point Identification: WaveRider automatically marks momentum pivots, signaling local maxima and minima in momentum flow. These points serve as critical confirmation markers for potential entry and exit decisions.
How to Interpret WaveRider
Colors:
Green hues indicate positive acceleration — momentum is increasing, favoring bullish positions.
Yellow hues represent neutral momentum — the market is consolidating or pausing.
Red hues signal negative acceleration — momentum is weakening, suggesting caution or bearish bias.
Oscillator Direction:
An upward sloping oscillator line reflects strengthening momentum.
A downward slope indicates weakening momentum or a potential reversal.
Pivot Labels:
▲ (Pivot Low): Denotes local momentum troughs; potential points to consider initiating long positions.
▼ (Pivot High): Marks local momentum peaks; useful for identifying possible short entries or profit-taking zones.
Summary
By grounding momentum analysis in fluid dynamics, WaveRider transcends the limitations of traditional oscillators. It accounts for the market’s inherent volatility and captures real-time acceleration changes, enabling traders to detect meaningful momentum shifts with greater accuracy and clarity.
WaveRider is designed for traders seeking a scientifically informed tool that adapts fluidly with market conditions—offering deeper insight into momentum flow and better timing for entries and exits.