Greer Free Cash Flow Yield✅ Title
Greer Free Cash Flow Yield (FCF%) — Long-Term Value Signal
📝 Description
The Greer Free Cash Flow Yield indicator is part of the Greer Financial Toolkit, designed to help long-term investors identify fundamentally strong and potentially undervalued companies.
📊 What It Does
Calculates Free Cash Flow Per Share (FY) from official financial reports
Divides by the current stock price to produce Free Cash Flow Yield %
Tracks a static average across all available financial years
Color-codes the yield line:
🟩 Green when above average (stronger value signal)
🟥 Red when below average (weaker value signal)
💼 Why It Matters
FCF Yield is a powerful metric that reveals how efficiently a company turns revenue into usable cash. This can be a better long-term value indicator than earnings yield or P/E ratios, especially in capital-intensive industries.
✅ Best used in combination with:
📘 Greer Value (fundamental growth score)
🟢 Greer BuyZone (technical buy zone detection)
🔍 Designed for:
Fundamental investors
Value screeners
Dividend and FCF-focused strategies
📌 This tool is for informational and educational use only. Always do your own research before investing.
Freecashflow

Greer Value📈 Greer Value
This indicator evaluates the year-over-year (YoY) growth consistency of five key fundamental metrics for any stock:
Book Value Per Share
Free Cash Flow
Operating Margin
Total Revenue
Net Income
The script tracks whether each metric increases annually based on financial statement data (FY), then calculates both individual and aggregate increase percentages over time. A color-coded table is displayed on the most recent bar showing:
Raw counts of increases vs. checks per metric
Percentage of years with growth
Overall "Greer Value" score indicating total consistency across all five metrics
✅ Green = Strong YoY growth
❌ Red = Weak or inconsistent growth
Use this tool to help identify fundamentally improving companies with long-term value creation potential.

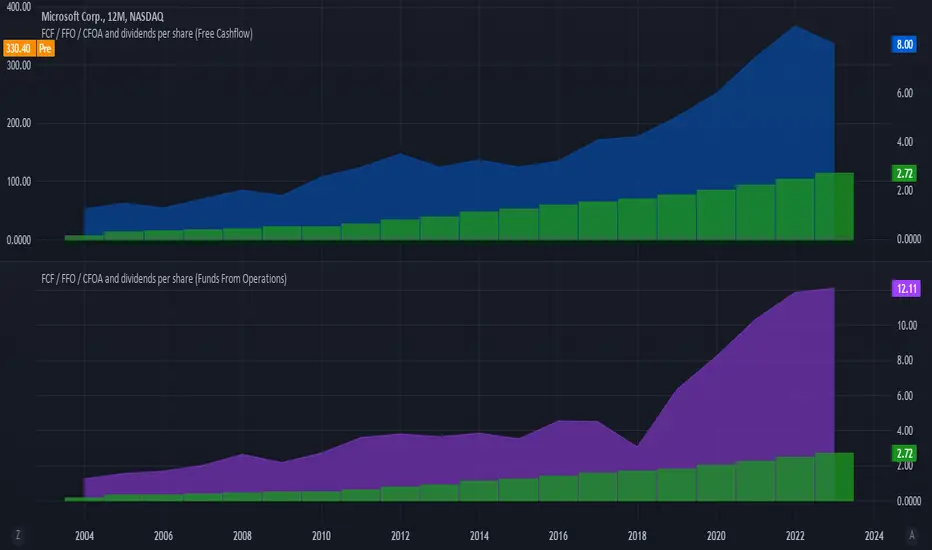
FCF / FFO / CFOA and dividends per shareThe indicator shows the Free Cashflow, Funds From Operations or Cash From Operating Activities per share and you can compare it to the dividends per share. You can see at a glance whether the dividends could be paid by one of this KPI. Please use the 12M time unit for the best result.
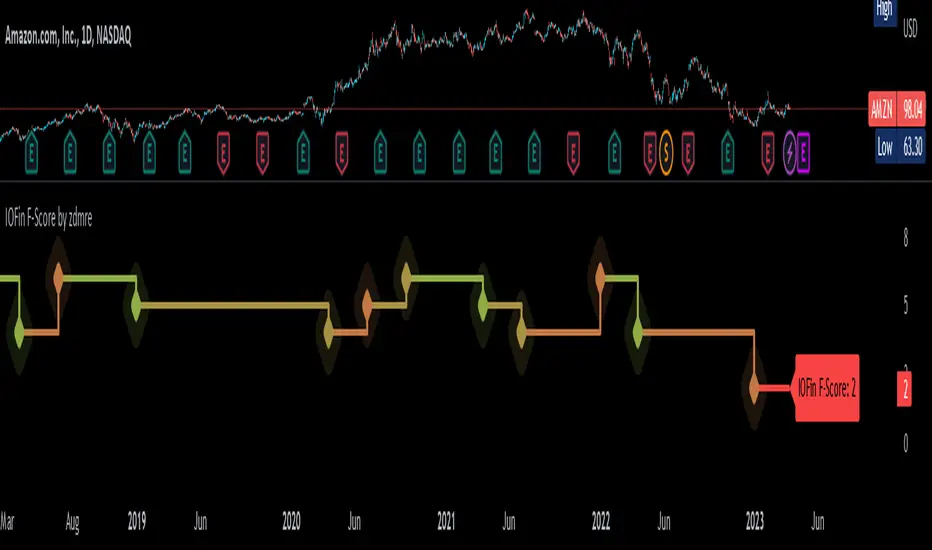
IOFin F-Score by zdmre🗣The IOFin F-Score is a discrete score between zero and ten that reflects ten criteria used to determine the strength of a firm's financial position.
🗣It is used to determine the best value stocks, with ten being the best and zero being the worst.
The IOFin F-Score broken down into the following categories:
Profitability
Equity, cash flow, liquidity, and source of funds
Operating efficiency
Criteria Include:
Price to book (P/B) lower than 3 (1 point)
Debt to Equity (D/E) lower than 0.5 (1 point)
Price to FreeCashFlow (P/FCF) equal to or lower than 20 (1 point)
Peg Ratio lower than 1 (1 point)
Sustainable Growth Rate higher than 0.3 (1 point)
Return on Assets (ROIC) higher than 0.07 (1 point)
Return on Equity (ROE) higher than 0.3 (1 point)
EnterpriseValue/Ebitda lower than 10 (1 point)
Quick Ratio equal to or higher than 1 (1 point)
Operating Margin higher than 0.15 (1 point)