Deviation Trend Profile [BigBeluga]🔵 OVERVIEW
A statistical trend analysis tool that combines moving average dynamics with standard deviation zones and trend-specific price distribution.
This is an experimental indicator designed for educational and learning purposes only.
🔵 CONCEPTS
Trend Detection via SMA Slope: Detects trend shifts when the slope of the SMA exceeds a ±0.1 threshold.
Standard Deviation Zones: Calculates ±1, ±2, and ±3 levels from the SMA using ATR, forming dynamic envelopes around the mean.
Trend Distribution Profile: Builds a histogram that shows how often price closed within each deviation zone during the active trend phase.
🔵 FEATURES
Trend Signals: Immediate shift markers using colored circles at trend reversals.
SMA Gradient Coloring: The SMA line dynamically changes color based on its directional slope.
Trend Duration Label: A label above the histogram shows how many bars the current trend has lasted.
Trend Distribution Histogram: Visual bin-based profile showing frequency of price closes within deviation bands during trend lookback period.
Adjustable Bin Count: Set the granularity of the distribution using the “Bins Amount” input.
Deviation Labels and Zones: Clearly marked ±1, ±2, ±3 lines with consistent color scheme.
Trend Strength Insight:
• Wide profile skewed to ±2/3 = strong directional trend.
• Profile clustered near SMA = potential trend exhaustion or range.
🔵 HOW TO USE
Use trend shift dots as entry signals:
• 🔵 = Bullish start
• 🔴 = Bearish start
Trade with the trend when price clusters in outer zones (±2 or ±3).
Be cautious or fade the trend when price distribution contracts toward the SMA.
View across multiple timeframes for trend confluence or divergence.
🔵 CONCLUSION
Deviation Trend Profile visualizes how price distributes during trends relative to statistical deviation zones.
It’s a powerful confluence tool for identifying strength, exhaustion, and the rhythm of price behavior—ideal for swing traders and volatility analysts alike.
Frequencyanalysis

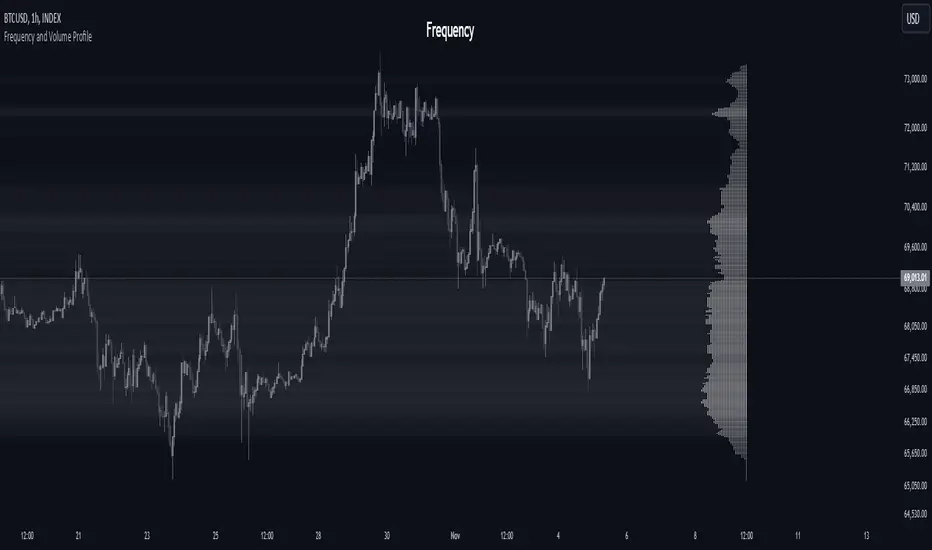
Frequency and Volume ProfileFREQUENCY & VOLUME PROFILE
⚪ OVERVIEW
The Frequency and Volume Profile indicator plots a frequency or volume profile based on the visible bars on the chart, providing insights into price levels with significant trading activity.
⚪ USAGE
● Market Structure Analysis:
Identify key price levels where significant trading activity occurred, which can act as support and resistance zones.
● Volume Analysis:
Use the volume mode to understand where the highest trading volumes have occurred, helping to confirm strong price levels.
● Trend Confirmation:
Analyze the distribution of trading activity to confirm or refute trends, mark important levels as support and resistance, aiding in making more informed trading decisions.
● Frequency Distribution:
In statistics, a frequency distribution is a list of the values that a variable takes in a sample. It is usually a list. Displayed as a histogram.
⚪ SETTINGS
Source: Select the price data to use for the profile calculation (default: hl2).
Move Profile: Set the number of bars to offset the profile from the current bar (default: 100).
Mode: Choose between "Frequency" and "Volume" for the profile calculation.
Profile Color: Customize the color of the profile lines.
Lookback Period: Uses 5000 bars for daily and higher timeframes, otherwise 10000 bars.
The Frequency Profile indicator is a powerful tool for visualizing price levels with significant trading activity, whether in terms of frequency or volume. Its dynamic calculation and customizable settings make it a versatile addition to any trading strategy.