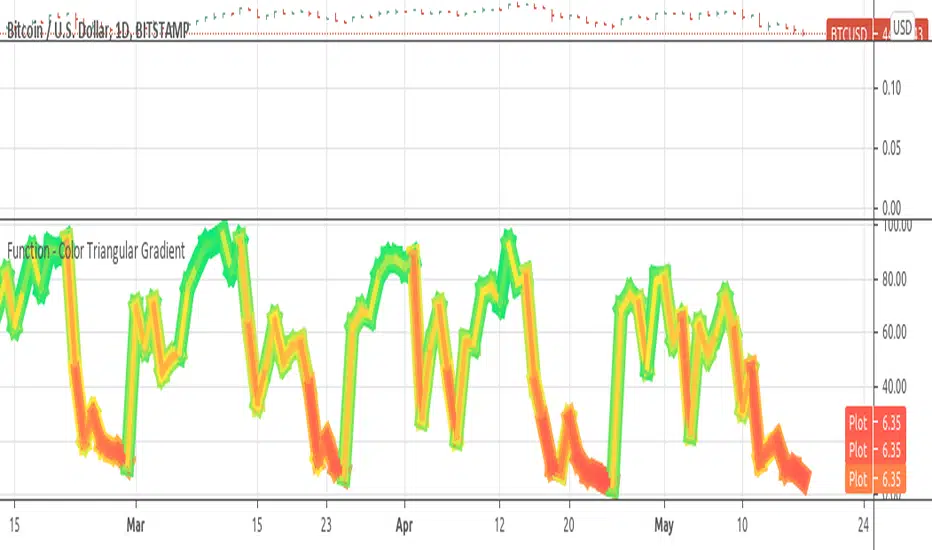
Linear Regression & RSI Multi-Function Screener with Table-LabelHi fellow traders..
Happy to share a Linear Regression & RSI Multi-Function Custom Screener with Table-Labels...
The Screener scans for Linear Regression 2-SD Breakouts and RSI OB/OS levels for the coded tickers and gives Summary alerts
Uses Tables (dynamica resizing) for the scanner output instead of standard labels!
This Screener cum indicator collection has two distinct objectives..
1. Attempt re-entry into trending trades.
2. Attempt Counter trend trades using linear regression , RSI and Zigzag.
Briefly about the Screener functions..
a. It uses TABLES as Labels a FIRST for any Screener on TV.
b. Tables dynamically resize based on criteria..
c. Alerts for breakouts of the UPPER and the LOWER regression channels.(2 SD)
d. In addition to LinReg it also Screens RSI for OB/OS levels so a multifunction Screener.
e. Of course has the standard summary Alerts and programmable format for Custom functions.
f. Uses only the inbuilt Auto Fib and Lin Reg code for the screener.(No proprietary stuff)
g. The auto Zigzag code is derived(Auto fib).
Question what are all these doing in a single screener ??
ZigZag is very useful in determining Trend Up or Down from one Pivot to another.
So Once you have a firm view of the Current Trend for your chosen timeframe and ticker…
We can consider few possible trading scenarios..
a. Re-entry in an Up Trend - Combination of OS Rsi And a Lower Channel breach followed by a re-entry back into the regression channel CAN be used as an effective re-entry.
b. Similarily one can join a Down Trend on OB Rsi and Upper Channel line breach followed by re-entry into the regression channel.
If ZigZag signals a range-bound market, bound within channel lines then the Upper breakout can be used to Sell and vice-versa!
In short many possibilities for using these functions together with Scanner and Alerts.
This facilitates timely PROFITABLE Trending and Counter trend opportunities across multiple tickers.
You must give a thorough READ to the various available tutorials on ZigZag / Regression and Fib retracements before attempting counter trend trades using these tools!!
A small TIP – Markets are sideways or consolidating 70% of the time!!
Acknowledgements: - Thanks a lot DGTRD for the Auto ZigZag code and also for the eagerness to help wherever possible..Respect!!
Disclaimer: The Alerts and Screener are just few tools among many and not any kind of Buy/Sell recommendations. Unless you have sufficient trading experience please consult a Financial advisor before investing real money.
*The alerts are set for crossovers however for viewing tickers trading above or below the channel use code in line 343 and 344 after setting up the Alerts!
** RSI alerts are disabled by default to avoid clutter, but if needed one can activate code lines 441,442,444 and 445
Wish you all, Happy Profitable Trading!
Function

Function - Weighted Standard DeviationCalculates weighted mean, variance, standard deviation, MSE and RMSE from time series variables or arrays.
When calculating from arrays, the function expects index 0 to be the most recent sample and weight values.


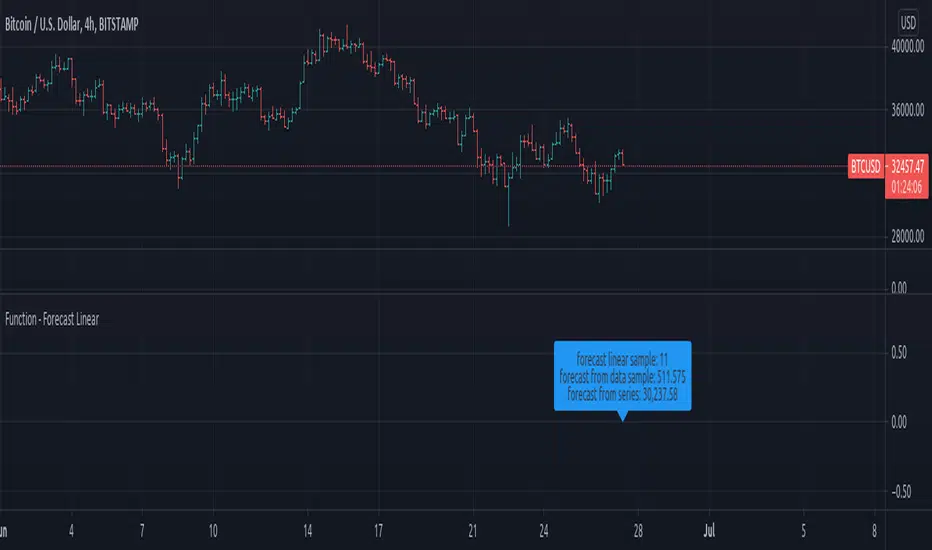
Function - Forecast LinearFunction to calculate a forecast using a linear regression approach, this is the same function used on excel and other data sheet programs.
reference:
- support.microsoft.com
- stackoverflow.com
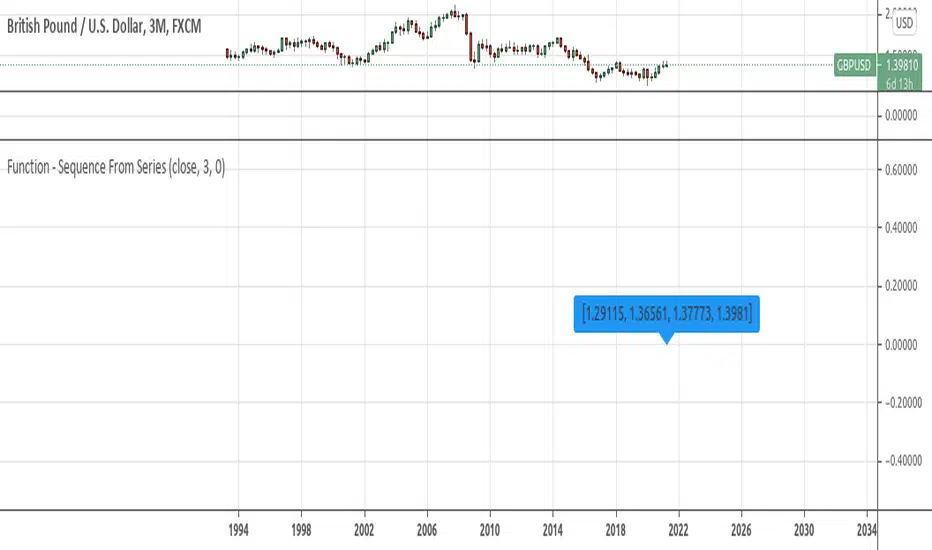
Function - Sequence From SeriesFunction to create a array from a sample taken from a series (ex:. close, hlc3...).
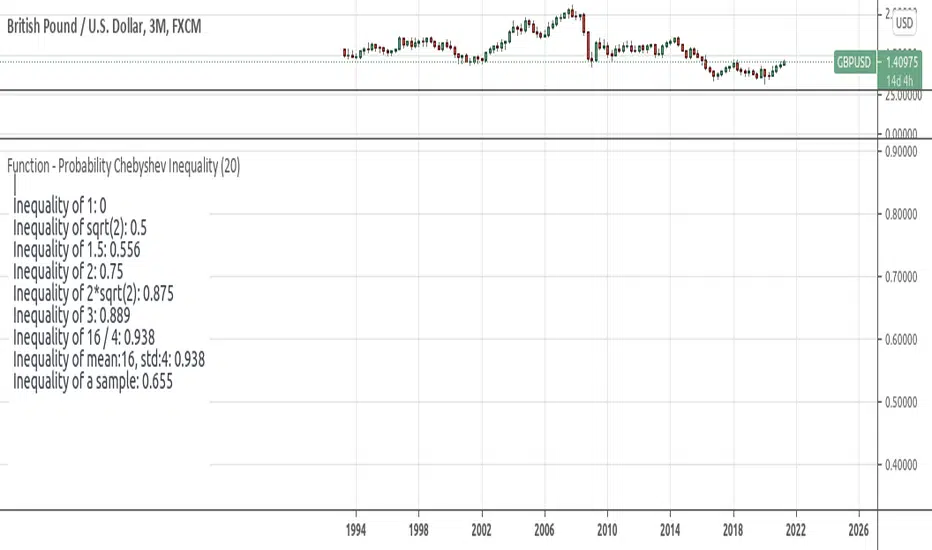
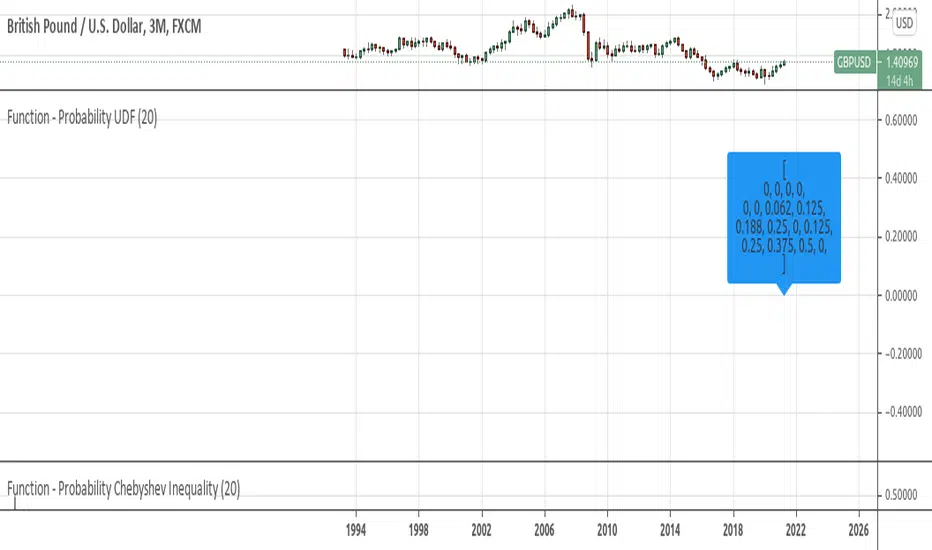
Function - Probability Chebyshev Inequalityfunction to calculate Chebyshev Inequality. wich can be used to compute the probability that we will diverge from what we expect to obtain.
reference:
- www.omnicalculator.com
- github.com
- statisticstopics.wordpress.com
- en.wikipedia.org
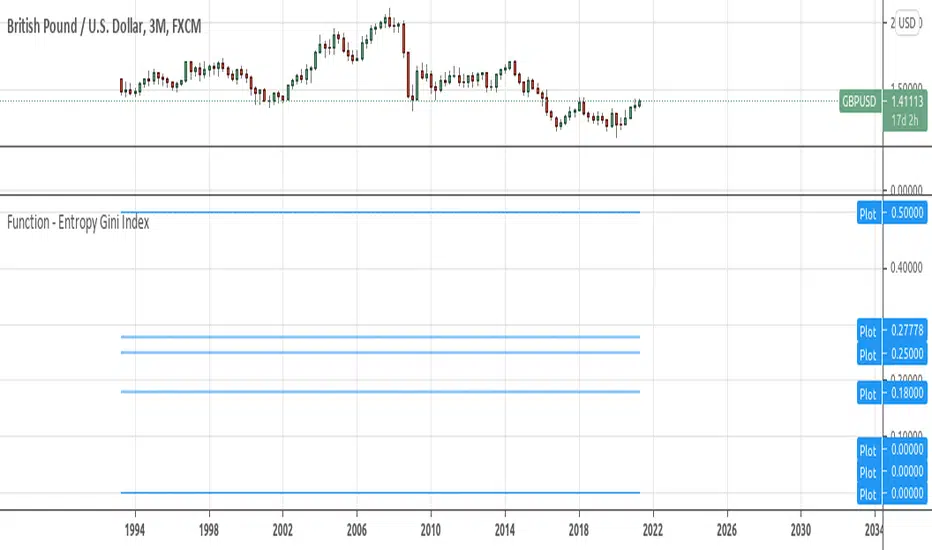
Function - Entropy Gini Indexfunction to retrieve Gini Impurity / Gini Index.
reference:
- victorzhou.com
- en.wikipedia.org
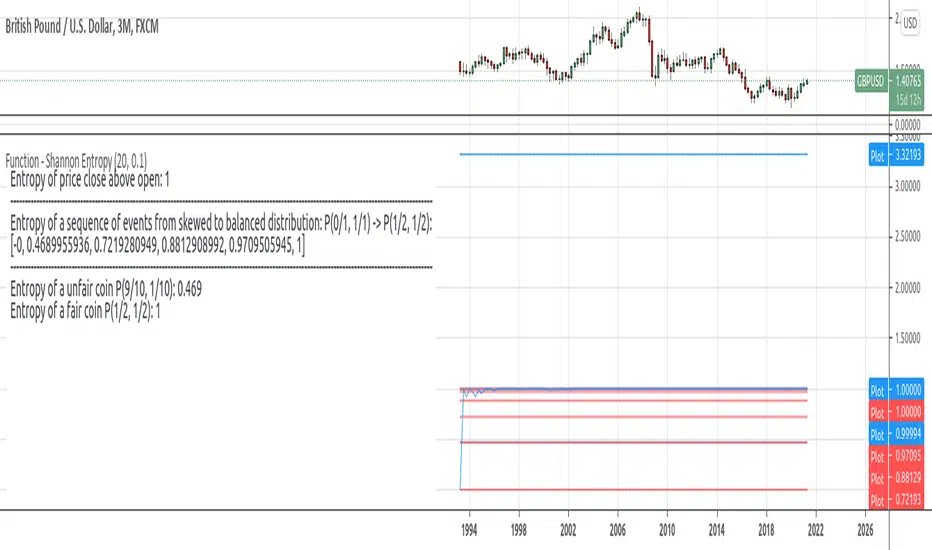
Function - Shannon Entropyfunctions for shannon's entropy
reference:
- en.wiktionary.org
- machinelearningmastery.com
test - event distributiondisplays the distribution of the outcome of a event over the last event.
similar to this script:
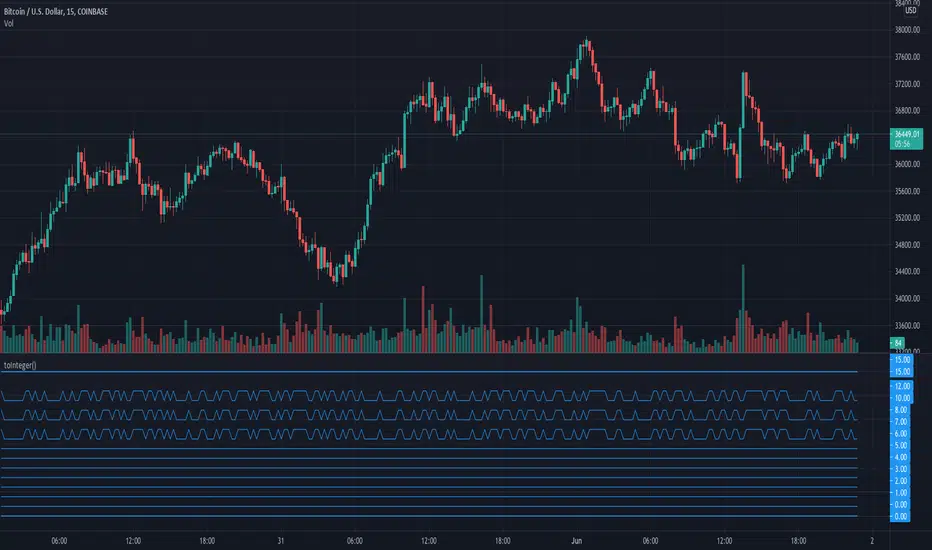
To Integer FunctionCustom toInteger() function accepts and truncates the following forms: const, input, simple, and series of the following types: float, integer, and string.
Special thanks and credit to BeeHolder for idea on using str.format("{0}", string) as workaround for accepting and handling string types!
NOTICE: This is an example script and not meant to be used as an actual strategy. By using this script or any portion thereof, you acknowledge that you have read and understood that this is for research purposes only and I am not responsible for any financial losses you may incur by using this script!
[UTILS] Session Input ParserAn utility function to parse session inputs. Extracts hours, minutes and weekdays (if defined) and returns a tuple as the result.
_parseSession(sessionString) => (hourStart, minuteStart, hourEnd, minuteEnd, weekdaysArray)
Examples presented on the chart.

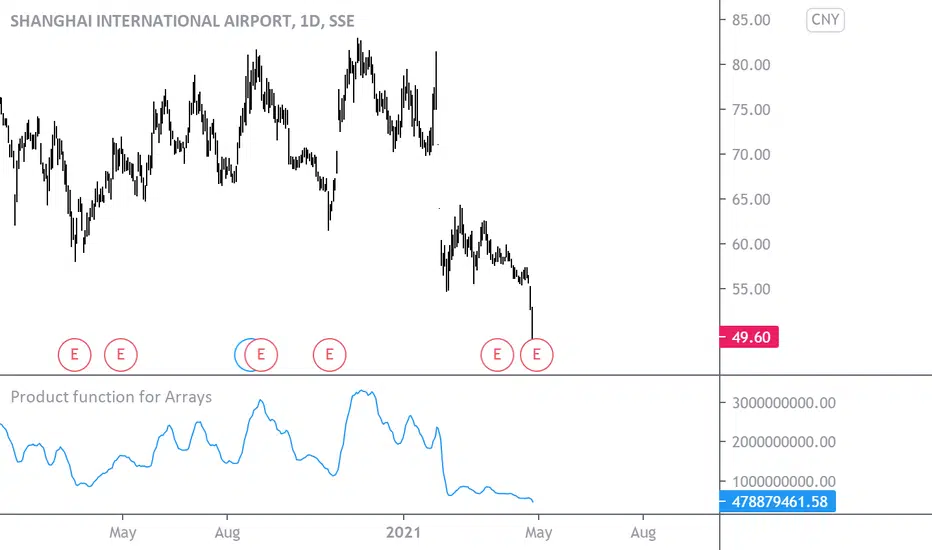
Product function for ArraysHello,
This code may be useful for Pine script coders only.
Arrays were welcomed in Pine script, as they are a foundation for coding properly many useful things, like studies and strategies here in TradingView :)
TradingView recently released new functions for arrays, like array.median and more, but the "PRODUCT" function was still missing, so I created it. I've no doubt that array.product() will soon be proposed by the platform, but for the time being, one can use mine.
It does the same thing as the PRODUCT() function in Excel : it multiplies all the source values included in the specified lookback, and returns the product. This function can accept Series or Arrays as source input.
Unicode Font Function V2 - JDThis script is a continuation from Duyck's Unicode font function
A different approach made on this function to able change font type on a single string
Now you can call it as a function to change the font type on every string that you need,
either it is for a Label or regular Text
Shoutout to @Duyck for his amazing works on this function.
Thank you to PineScript Community as well
Let me know if you guys have any suggestion or idea.
Greets,
dddfault

Function Square WaveThis is a script to draw a square wave on the chart, with an indicator for current price.
Markets undergoing Dow Jones or Wyckoff Accumulation/Distribution cycles tend to move in such waves, and if the period of the cycles are detected, a signal for accumulation/distribution phases can be created as an early warning.
Useful inputs:
- Average True Range as the wave height.
- Assumed Wave period as the wave duration.
I divided the current price wave by 2 to make the indicator more visually friendly.
GLHF
- DPT

Function Sawtooth WaveThis is an indicator to draw a sawtooth wave on the chart.
It can be a useful perspective, as decaying markets tend to oscillate in reverse sawtooth waves, and bullish markets can oscillate in conventional sawtooth waves. With the right inputs, it can be an early warning signal for potential movements.
Something I've noted is that large waves cause a ripple effect and sets the frequency for the market until a change occurs. Sawtooth waves may help in capturing ripple waves.
Useful inputs are:
- Average True Range as wave height (amplitude)
- Periodicity of market as wave duration (frequency)
(Inputs will change the wave from conventional to reverse)
I hope that it is helpful.
GLHF
- DPT
