EPS+Sales+Net Profit+MCap+Sector & Industry📄 Full Description
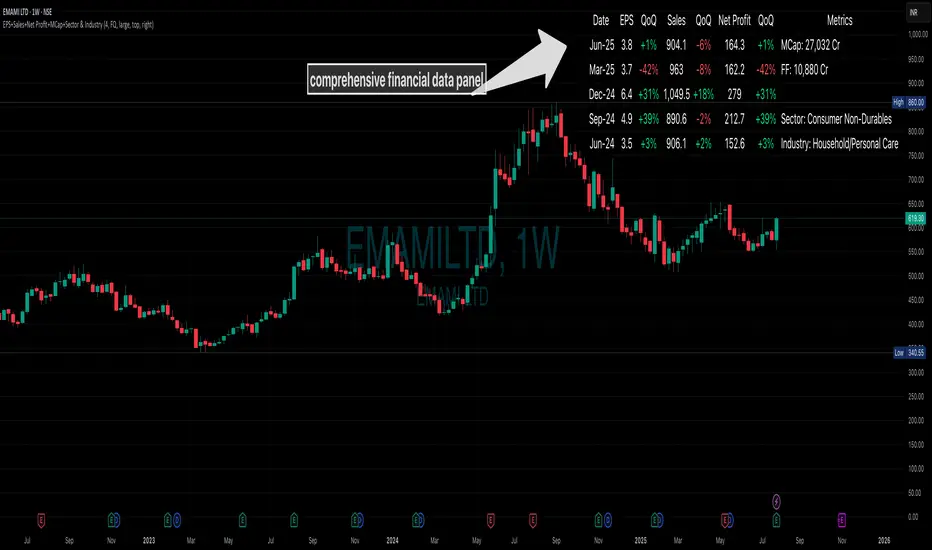
This script displays a comprehensive financial data panel directly on your TradingView chart, helping long-term investors and swing traders make informed decisions based on fundamental trends. It consolidates key financial metrics and business classification data into a single, visually clear table.
🔍 Key Features:
🧾 Financial Metrics (Auto-Fetched via request.financial):
EPS (Earnings Per Share) – Displayed with trend direction (QoQ or YoY).
Sales / Revenue – In ₹ Crores (for Indian stocks), trend change also included.
Net Profit – Also in ₹ Crores, along with percentage change.
Market Cap – Automatically calculated using outstanding shares × price, shown in ₹ Cr.
Free Float Market Cap – Based on float shares × price, also in ₹ Cr.
🏷️ Sector & Industry Info:
Automatically identifies and displays the Sector and Industry of the stock using syminfo.sector and syminfo.industry.
Displayed inline with metrics, making it easy to know what business the stock belongs to.
📊 Table View:
Compact and responsive table shown on your chart.
Columns: Date | EPS | QoQ | Sales | QoQ | Net Profit | QoQ | Metrics
Metrics column dynamically shows:
Market Cap
Free Float
Sector (Row 4)
Industry (Row 5)
🌗 Appearance:
Supports Dark Mode and Mini Mode toggle.
You can also customize:
Number of data points (last 4+ quarters or years)
Table position and size
🎯 Use Case:
This script is ideal for:
Fundamental-focused traders who use EPS/Sales trends to identify momentum.
Swing traders who combine price action with fundamental tailwinds.
Portfolio builders who want to see sector/industry alignment quickly.
It works best with fundamentally sound stocks where earnings and profitability are a major factor in price movements.
✅ Important Notes:
Script uses request.financial which only works with supported symbols (mostly stocks).
Market Cap and Free Float are calculated in ₹ Crores.
All financial values are rounded and formatted for readability (e.g., 1,234 Cr).
🙏 Credits:
Developed and published by Sameer Thorappa
Built with a clean, minimalist approach for high readability and functionality.
Fundamentales
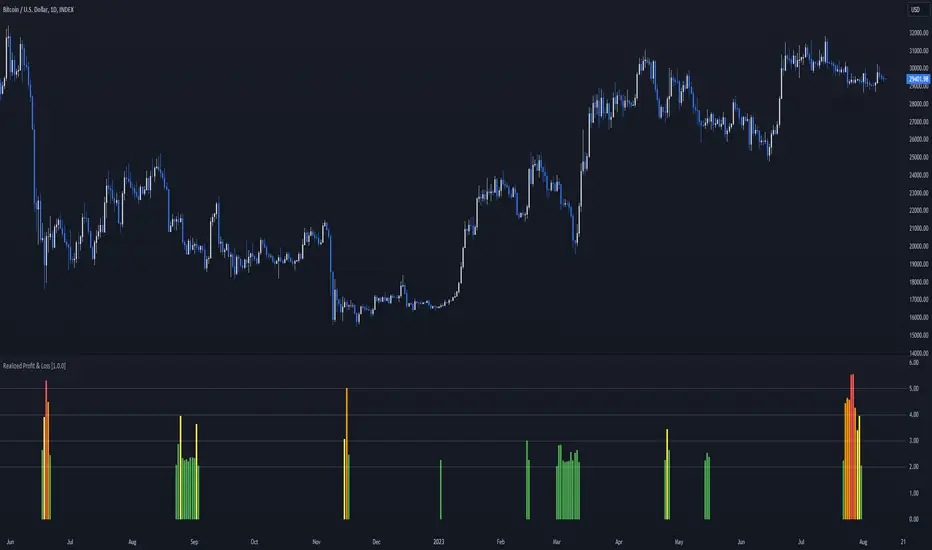
Realized Profit & Loss [BigBeluga]The Realized Loss & Profit indicator aims to find potential dips and tops in price by utilizing the security function syminfo.basecurrency + "_LOSSESADDRESSES".
The primary objective of this indicator is to present an average, favorable buying/selling opportunity based on the number of people currently in profit or loss.
The script takes into consideration the syminfo.basecurrency, so it should automatically adapt to the current coin.
🔶 USAGE
Users have the option to enable the display of either Loss or Profit, depending on their preferred visualization.
Examples of displaying Losses:
Example of displaying Profits:
🔶 CONCEPTS
The concept aims to assign a score to the data in the ticker representing the realized losses. This score will provide users with an average of buying/selling points that are better to the typical investor.
🔶 SETTINGS
Users have complete control over the script settings.
🔹 Calculation
• Profit: Display people in profit on an average of the selected length.
• Loss: Display people in loss on an average of the selected length.
🔹 Candle coloring
• True: Color the candle when data is above the threshold.
• False: Do not color the candle.
🔹 Levels
- Set the level of a specific threshold.
• Low: Low losses (green).
• Normal: Low normal (yellow).
• Medium: Low medium (orange).
• High: Low high (red).
🔹 Z-score Length: Length of the z-score moving window.
🔹 Threshold: Filter out non-significant values.
🔹 Histogram width: Width of the histogram.
🔹 Colors: Modify the colors of the displayed data.
🔶 LIMITATIONS
• Since the ticker from which we obtain data works only on the daily timeframe, we are
restricted to displaying data solely from the 1D timeframe.
• If the coin does not have any realized loss data, we can't use this script.
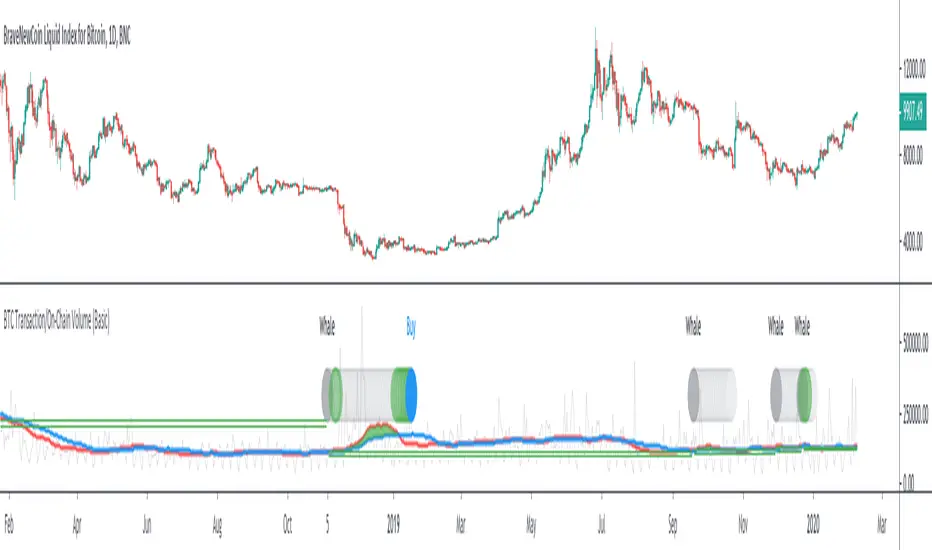
BTC Transaction/On-Chain Volume (Basic)Description:
Whale: Whale utilizing discounted prices (increasing on-chain volume & decreasing price)
Recovering: Positive momentum in price after potential whale activity
Cycle Volume Support: The transaction volume support during a cycle
What’s the best time to invest?
After institutions make up their mind at low price levels.
How’s on-chain volume related to whales or institutional money?
On-chain volume is contributed not only by using BTC as payment methods, but more importantly by large custodians using the BTC chain to settle internal whale trades. When OTC volume is estimated 2-3 times of exchange volume, and when total on-chain volume is only a small fraction of the exchange volume, the OTC settlement plays a big factor in moving the on-chain volume around.
Why does the price drop further after spotting whale money?
Does new money equal higher true value? Yes.
Does new money equal higher price? No.
Whales could not only ladder in when they see the price on discount, but also push the price further down to accumulate at better price levels. However, either route chosen, it’s most likely for the price to rise to a higher level compared to the level when the whales enter. Whales are here to make money after all.