Fibonacci Optimal Entry Zone [OTE] (Zeiierman)█ Overview
Fibonacci Optimal Entry Zone (Zeiierman) is a high-precision market structure tool designed to help traders identify ideal entry zones during trending markets. Built on the principles of Smart Money Concepts (SMC) and Fibonacci retracements, this indicator highlights key areas where price is most likely to react — specifically within the "Golden Zone" (between the 50% and 61.8% retracement).
It tracks structural pivot shifts (CHoCH) and dynamically adjusts Fibonacci levels based on real-time swing tracking. Whether you're trading breakouts, pullbacks, or optimal entries, this tool brings unparalleled clarity to structure-based strategies.
Ideal for traders who rely on confluence, this indicator visually synchronizes swing highs/lows, market structure shifts, Fibonacci retracement levels, and trend alignment — all without clutter or lag.
⚪ The Structural Assumption
Price moves in waves, but key retracements often lead to continuation or reversal — especially when aligned with structure breaks and trend shifts.
The Optimal Entry Zone captures this behavior by anchoring Fibonacci levels between recent swing extremes. The most powerful area — the Golden Zone — marks where institutional re-entry is likely, providing traders with a sniper-like roadmap to structure-based entries.
█ How It Works
⚪ Structure Tracking Engine
At its core, the indicator detects pivots and classifies trend direction:
Structure Period – Determines the depth of pivots used to detect swing highs/lows.
CHoCH – Break of structure logic identifies where the trend shifts or continues, marked visually on the chart.
Bullish & Bearish Modes – Independently toggle uptrend and downtrend detection and styling.
⚪ Fibonacci Engine
Upon each confirmed structural shift, Fibonacci retracement levels are projected between swing extremes:
Custom Levels – Choose which retracements (0.50, 0.618, etc.) are shown.
Real-Time Adjustments – When "Swing Tracker" is enabled, levels and labels update dynamically as price forms new swings.
Example:
If you disable the Swing Tracker, the Golden Level is calculated using the most recent confirmed swing high and low.
If you enable the Swing Tracker, the Golden Level is calculated from the latest swing high or low, making it more adaptive as the trend evolves in real time.
█ How to Use
⚪ Structure-Based Entry
Wait for CHoCH events and use the resulting Fibonacci projection to identify entry points. Enter trades as price taps into the Golden Zone, especially when confluence forms with swing structure or order blocks.
⚪ Real-Time Reaction Tracking
Enable Swing Tracker to keep the tool live — constantly updating zones as price shifts. This is especially useful for scalpers or intraday traders who rely on fresh swing zones.
█ Settings
Structure Period – Number of bars used to define swing pivots. Larger values = stronger structure.
Swing Tracker – Auto-updates fib levels as new highs/lows form.
Show Previous Levels – Keep older fib zones on chart or reset with each structure shift.
-----------------
Disclaimer
The content provided in my scripts, indicators, ideas, algorithms, and systems is for educational and informational purposes only. It does not constitute financial advice, investment recommendations, or a solicitation to buy or sell any financial instruments. I will not accept liability for any loss or damage, including without limitation any loss of profit, which may arise directly or indirectly from the use of or reliance on such information.
All investments involve risk, and the past performance of a security, industry, sector, market, financial product, trading strategy, backtest, or individual's trading does not guarantee future results or returns. Investors are fully responsible for any investment decisions they make. Such decisions should be based solely on an evaluation of their financial circumstances, investment objectives, risk tolerance, and liquidity needs.
Goldenzonefibonacci

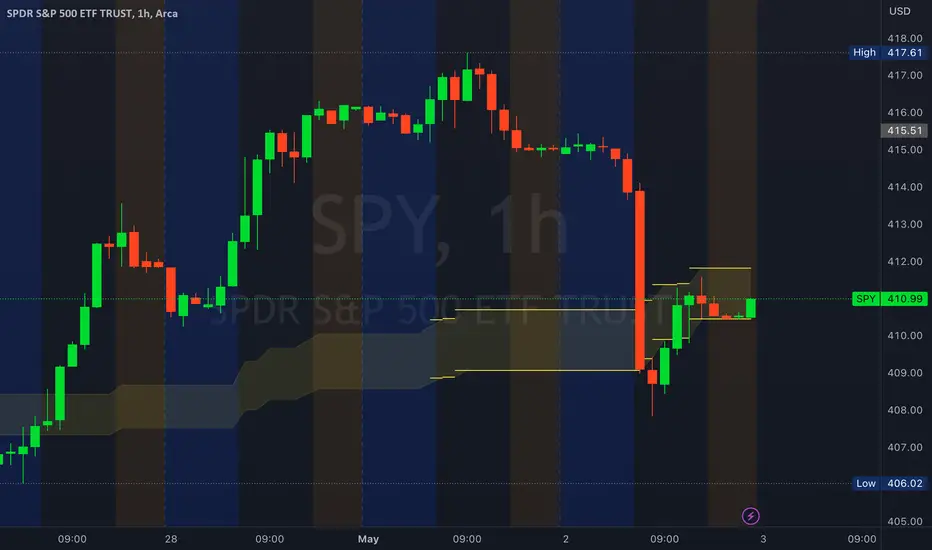
Golden ZoneIntroducing the "Golden Zone" indicator, a powerful tool that simplifies the Fibonacci indicator by creating a clear Golden Zone to identify potential future price movements. The Golden Zone is a supply or demand zone that corresponds to the 61.8% and 50% Fibonacci retracement levels. These levels are important because they often mark zones where the price reacts, making it an essential area for traders to watch.
The script plots the Fibonacci levels in the background, enabling traders to identify potential support and resistance levels quickly. The Golden Zone is highlighted with a yellow filled area, making it easy to spot on the chart. Traders use this zone to identify areas where the stock price may react, either bouncing off the support level or encountering resistance at the resistance level.
For example, if a stock price is moving up and reaches the Golden Zone, a trader may look for signs of resistance and consider selling the stock if the price begins to move back down. Conversely, if a stock price is moving down and reaches the Golden Zone, a trader may look for signs of support and consider buying the stock if the price begins to move back up.
The "Golden Zone" indicator is highly versatile and can be used in all markets, whether you are a swing trader or a day trader. It can be combined with other strategies, such as an EMA crossover strategy or price action, or as an area of confluence.
In summary, the "Golden Zone" indicator is a must-have tool for traders looking to identify potential price movements and locate key support and resistance levels. Its user-friendly inputs and clear display make it a valuable addition to any trading arsenal.
So, the "Golden Zone" indicator is like a magic tool that helps people who trade in the stock market find valuable things to buy or sell. And with its ability to identify key support and resistance levels, it can help traders make better-informed decisions when buying or selling stocks.
I hope you like it!